

Abstract
Background
There is some evidence pointing toward better renal function in kidney transplant recipients (KTR) treated with once-daily tacrolimus (QD-TAC) vs. twice-daily tacrolimus (BID-TAC).
Methods
This is an extension study of a 1-year, single arm prospective study of stable KTR who were converted from BID-TAC to QD-TAC (4.9 ± 4.0 years after transplantation) in Spanish routine clinical practice. Patient and graft survival, renal function, acute rejection episodes, and other analytic parameters were assessed at 24 and 36 months after conversion.
Results
A total of 1798 KTR were included in the extension study. Tacrolimus doses at 36 months were significantly lower compared to those at time of conversion (−0.2 mg/day; P = 0.023). Blood levels were lower than baseline during all the study (P < 0.001). Graft and patient survival at 3 years after conversion were 93.9% and 95.1%, respectively. Compared with baseline, the mean estimated glomerular filtration rate (eGFR) remained very stable at all timepoints (56.7 ± 19.8 vs 58.1 ± 24.6 mL/min per 1.73 m2 at month 36; P = 0.623). Even when patients reinitiating dialysis were counted as eGFR = 0, the mean eGFR was very stable. In fact, a small but significant increase was observed at 36 months versus baseline (+0.1 mL/min per 1.73 m2; P = 0.025). An increase in proteinuria was observed at 36 months versus baseline (+0.11 g/24 h; P < 0.001). Acute rejection rates were low during the study.
Conclusions
Conversion from BID-TAC to QD-TAC in a large cohort of stable KTR was safe and associated with a very stable renal function after 3 years. Comparative studies are warranted to assess the feasibility of such conversion.
The prolonged-release formulation of tacrolimus (TAC) was developed to provide a more convenient once-daily (QD) dosing to improve patient adherence, whereas showing pharmacokinetic, efficacy and safety profile comparable to twice-daily (BID) TAC (Prograf; Astellas Pharma Inc., Tokyo, Japan).1-4
In a randomized multicenter controlled trial, kidney transplant patients randomized to QD-TAC showed superior adherence to medical treatment, specifically superior regimen implementation, than those randomized to BID-TAC, because the burden of the patient taking an additional dose each day was eliminated.5 In addition, the QD regimen eliminated the evening dose, which posed higher incidence of missed doses relative to morning doses in the BID regimen (an average of 14.2% vs 11.7% doses, respectively; P = 0.003).5
Furthermore, in prospective, as well as retrospective studies, stable adult kidney transplant recipients (KTRs) converted milligram for milligram from BID-TAC to QD-TAC showed a significant reduction in coefficient of variation of TAC blood concentrations after the conversion.6,7 Stiff et al8 found that the conversion from BID-TAC to QD-TAC in KTR was associated with a significant reduction of the within-patient variability of TAC exposure measured by the area under the curve. It is known that high within-patient variability of blood concentration of TAC, as that of other immunosuppressive drugs, leads to blood concentrations more frequently outside the therapeutic window (overexposure, which could cause toxic effects and underexposure, which could cause acute rejection) increasing the risk of rejection and graft loss after kidney transplantation.9 Thus, the achievement of more stable blood levels is an advantage for transplanted patients.
In addition, patients seem to prefer the QD to the BID formulation, because 99.4% of kidney recipients, who switched from BID-TAC to QD-TAC in a study conducted in the clinical practice, had a positive feeling after the conversion, mainly due to the increased patient convenience by avoiding the evening dose of TAC (66% of patients), and to better adherence to medication (34%).10 The mentioned study (Evaluation of Advagraf Conversion and Long-Term Use in Kidney Transplantation study) was a multicenter, prospective, observational, 12-month study that was conducted in 1832 stable kidney recipients to assess the efficacy and safety of conversion, as well as patient preference, from BID-TAC to the QD formulation. The study showed high graft and patient survival at 1 year (99.8%), low acute rejection (0.4%), and a tolerability profile similar to that of standard TAC. In addition, a stable renal function was observed (mean glomerular filtration rate [GFR] did not change significantly during follow-up). This renal function stability has been observed in other transplant population on QD-TAC, both in the short11 and in the long term.12 Indeed, mean serum creatinine and mean creatinine clearance stayed stable for 4 years in 240 kidney or liver transplant patients, who had received QD-TAC de novo or had been converted from BID-TAC to QD-TAC.12 Furthermore, an improvement in glomerular filtration has been observed in 2 studies involving a relatively low number of kidney transplant patients converted from BID-TAC to QD-TAC.13,14 In this regard, it has been recently suggested in healthy volunteers that QD-TAC is associated with significant renal hemodynamic improvement versus BID-TAC.15
So far, QD-TAC has shown to improve patient adherence, decrease the within patient variability of TAC blood concentrations, and be preferred by the patients over the BID formulation. Although there is some evidence pointing toward better renal function in the long term, as compared to the BID formulation, it has not been confirmed. Thus, we decided to extend the EVOLUTION study from 1 to 3 years and focus on renal function.
MATERIALS AND METHODS
This is a 3-year extension study of a previous prospective study of KTRs converted from BID-TAC to QD-TAC (Advagraf; Astellas Pharma Inc.) and followed up for 1 year to describe the efficacy and safety of such conversion (EVOLUTION study [Evaluation of Advagraf Conversion and Long-Term Use in Kidney Transplantation]).10 Briefly, the EVOLUTION study was a prospective, single arm observational study, in which 1832 stable KTRs were converted from BID-TAC to QD-TAC in the routine clinical practice of 21 Spanish hospitals, between September 2007 and March 2009. Stable patients were defined as those without acute rejections and without an increase greater than 10% in serum creatinine in the last 12 months. Patients who were not stable or considered to be at immunologic risk were excluded. All the patients included in the REVOLUTION study were treated with Prograf [Astellas Pharma Inc.] (no generic formulation of BID-TAC was used). Patients were followed up for 12 months after conversion, until March 2010. Data at 12 months on safety and efficacy were compared with data at baseline. Because it was an observational study, there was no control group. Further details on the conversion process and study design, along with the results observed at 1 year after conversion, have been previously published.10
After the completion of the 1-year original study, follow-up was continued in yearly visits. All patients who had completed the 1-year original study were invited to continue in the extension study. The data presented in the current article correspond to the data obtained at the third year after the conversion (follow-up until December 2011).
The parameters monitored at conversion and at different time points during the first-year were also measured at 24 and 36 months from conversion: TAC dose and trough levels; patient and graft survival; renal function measured by estimated GFR (eGFR; which was estimated from serum creatinine using the Modification of Diet in Renal Disease Study [MDRD-4] equation); biopsy-proven acute rejection episodes; evolution of proteinuria, blood pressure, lipid, glucose, and liver parameters; and adverse events.
The Local Ethics Committee of each participating center approved the protocol of the extension of the EVOLUTION study and all patients gave written informed consent before inclusion. The study procedures were in accordance with the International Conference on Harmonisation of Technical Requirements for Registration of Pharmaceuticals for Human Use/Good Clinical Practice Guidelines Guidelines and the ethical Standards of Helsinki Declaration
Statistical Analysis
All statistical analyses were performed using the SPSS statistical package version 15.0 (SPSS Inc., Chicago, IL). Categorical variables were described using frequency tables and percentages, and continuous variables using measures of central tendency and dispersion (mean, standard deviation or median, range). Analyses were based on observed data only. Paired Student t tests or Wilcoxon signed-rank tests, as appropriate, were applied to evaluate differences in mean values between different time points, and McNemar tests were used to evaluate differences in qualitative variables.
Statistical significance was defined as P values less than 0.05. All P values were 2-sided.
RESULTS
A total of 1798 patients completed the 1-year EVOLUTION study and were included in the extension study. Of these, 1496 (83.2%) completed the extension study up to 3 years (Figure 1). The sociodemographic and clinical characteristics of the patients included in the study are shown in Table 1. Mean time from transplantation to conversion to QD-TAC was 4.9 ± 4.0 years and mean follow-up since QD-TAC conversion was 2.92 ± 0.34 years.
FIGURE 1.
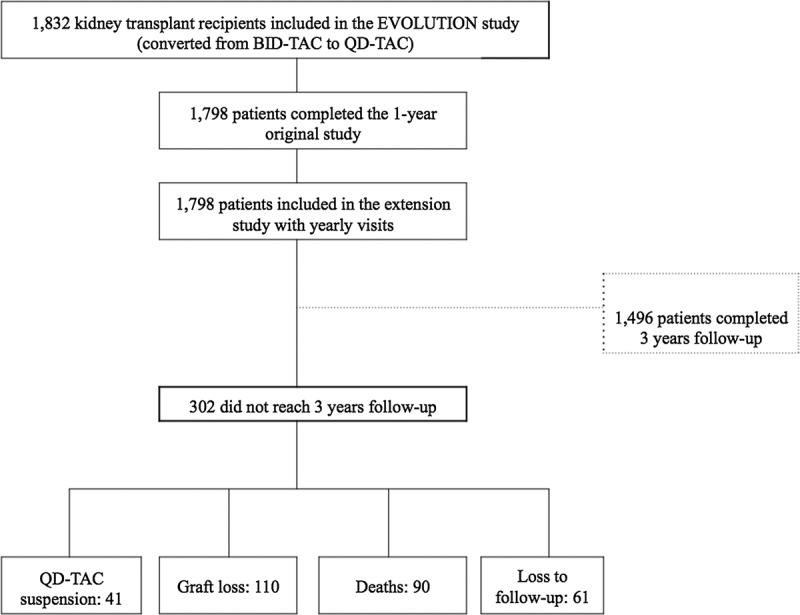
Patients' flowchart of the 3-year extension of the EVOLUTION study.
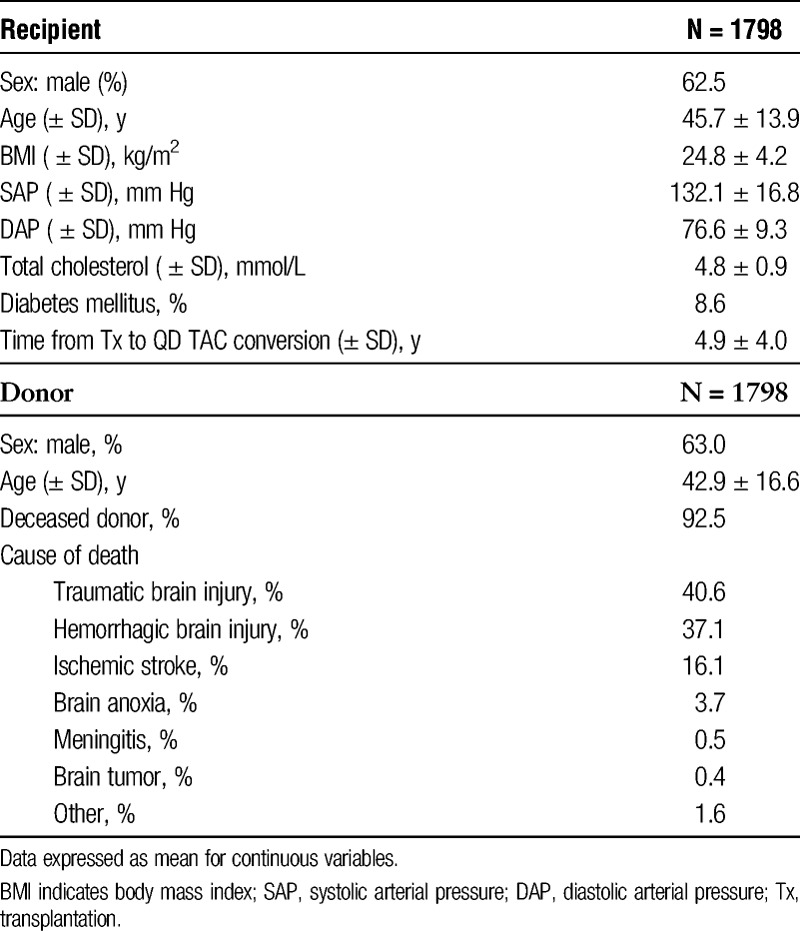
TABLE 1.
Donors and recipients sociodemographic and clinical characteristics
Three hundred and two (16.8%) patients did not complete the extension study: Graft loss occurred in 110 patients, 90 patients died, QD-TAC was suspended in 41 patients (converted to mechanistic target of rapamycin inhibitors due to neoplasia: 8; difficulty in reaching TAC target levels: 6; side effects: 19; others: 8), and 61 patients were lost to follow-up.
Tacrolimus Dose and Levels
After conversion to QD-TAC, the dose of TAC was significantly higher at 12 months as compared to baseline (4.1 ± 2.4 mg/day vs 4.0 ± 2.4 mg/day, respectively; P = 0.009), but decreased at similar baseline levels at 24 months (4.0 ± 2.2 mg/day; P = 0.452); and at 36 months, the mean dose of TAC was significantly lower compared with the baseline (3.8 ± 2.2 mg/day; P = 0.023) (Figure 2A).
FIGURE 2.
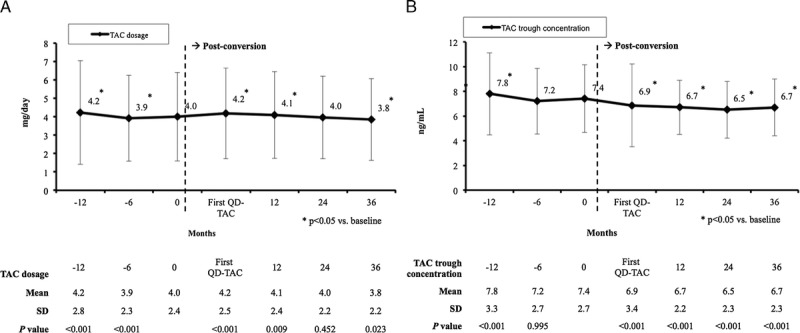
Mean (±SD) tacrolimus dose (mg/day) (A) and blood levels (ng/mL) (B). First QD-TAC: first determination under once-daily tacrolimus (normally at 10-14 days after conversion from twice-daily tacrolimus).
The TAC levels significantly decreased just after conversion and remained stable thereafter (Figure 2B). The TAC levels at 24 and 36 months were 0.9 and 0.7 ng/mL lower versus baseline, respectively (P < 0.001).
The dose adjusted trough concentrations are presented in Figure 3. They were significantly decreased at all timepoints after conversion versus baseline (P < 0.001), except at 36 months, when similar baseline values were observed (2.3 ± 1.5 [ng/mL]/mg vs 2.5 ± 2.0 [ng/mL]/mg, respectively; P = 0.908).
FIGURE 3.
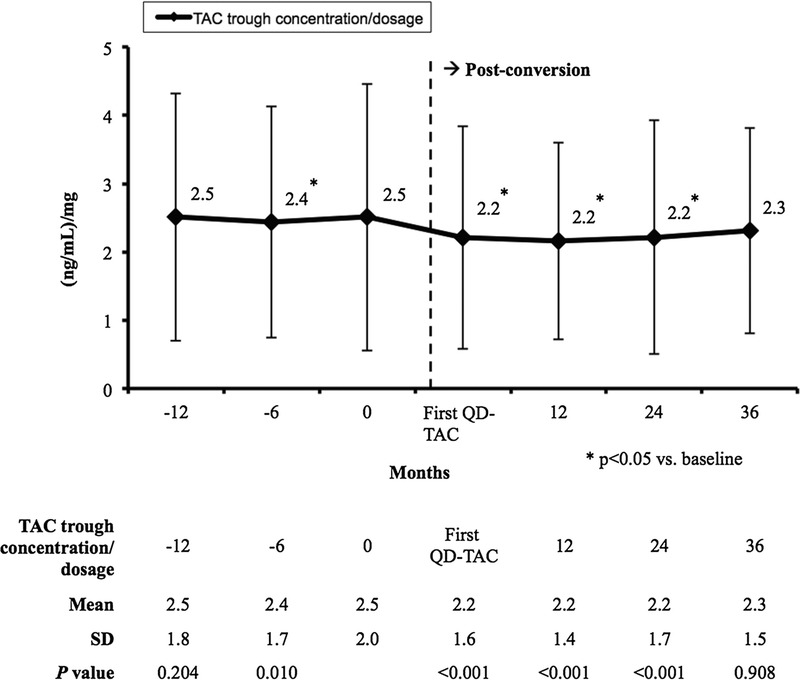
Mean (±SD) tacrolimus dose adjusted through concentrations ([ng/mL]/mg).
Figure 4 presents the number of patients with low (≤20) or high (>20) percent coefficient of variation of TAC levels before and after the conversion from BID-TAC to QD-TAC. The number of patients with a low percent coefficient of variation increased significantly from 667 before the conversion (patients treated with BID-TAC) to 735 after the conversion (patients treated with QD-TAC) (P = 0.01).
FIGURE 4.
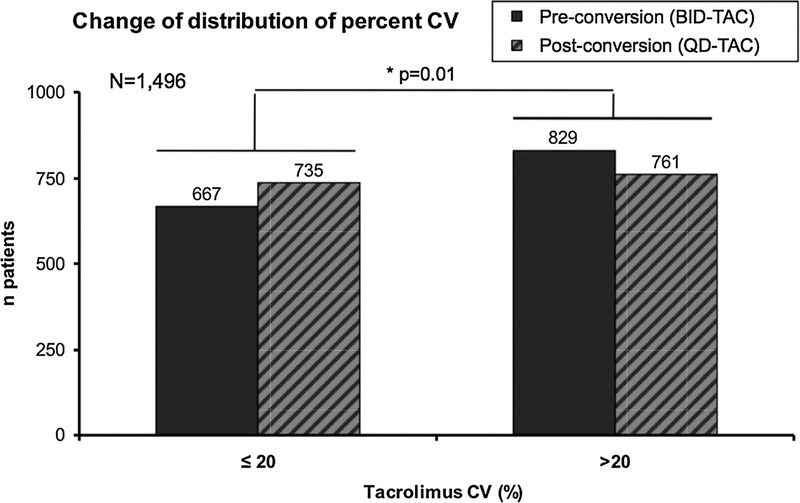
Patients with low (≤20) or high (>20) coefficient of variability of tacrolimus levels before (BID-TAC) and after the conversion (QD-TAC). CV indicates coefficient of variability.
Patient and Graft Survival
Death-censored graft survival at 3 years after conversion was 93.9%. Allografts were lost in 110 patients (chronic humoral rejection: 36 [32.7%]; interstitial fibrosis/tubular atrophy: 33 [30%]; chronic allograft nephropathy [non histologically confirmed]: 22 [20%]; calcineurin inhibitor nephrotoxicity: 5 [4.5%]; acute rejection: 2 [1.8%]; other: 12 [10.9%]).
Patient survival at 3 years after conversion to QD-TAC was 95.1%. Ninety patients died, 25 due to cardiovascular disease (27.8%), 25 due to neoplasia (27.8%), 13 due to infection (14.4%; including 6 cases of bacterial infection and one case of Mycobacterium tuberculosis), 16 due to other reasons (17.8%) and 11 unknown (12.2%).
Renal Function
When excluding from the analysis of the renal function evolution, those patients who had to reinitiate dialysis, a small decrease in mean eGFR was observed at 12 months after conversion to QD-TAC versus baseline (55.7 ± 20.9 mL/min per 1.73 m2 vs 56.7 ± 19.8 mL/min per 1.73 m2, respectively; P < 0.001). However, at month 24, mean eGFR had increased at similar baseline levels, and at month 36, a numerically (but not significant) higher value of eGFR was observed compared with baseline (58.1 ± 24.6 mL/min per 1.73 m2; P = 0.623) (Figure 5A).
FIGURE 5.
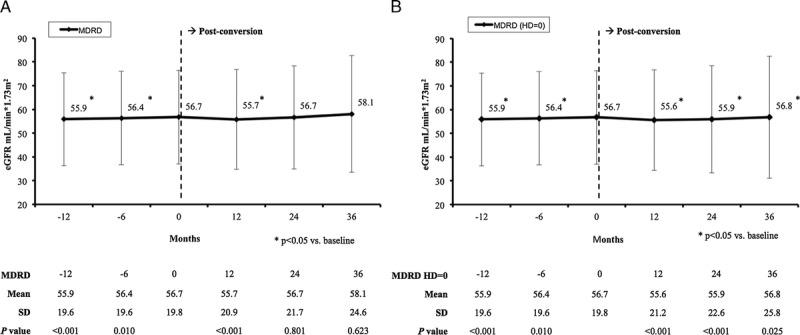
Mean (±SD) estimated glomerular filtration rate (mL/min per 1.73 m2) censoring patients reinitiating hemodialysis (A) or counting patients reinitiating hemodialysis as having MDRD = 0 (B). HD indicates hemodialysis.
When patients reinitiating dialysis were counted as patients with MDRD = 0, a significant decrease was observed in the mean eGFR at months 12 and 24 after conversion (P < 0.001); but at 36 months, the mean eGFR was +0.1 mL/min per 1.73 m2 higher than baseline, with P value reaching statistical significance (56.8 ± 25.8 mL/min per 1.73 m2 vs 56.7 ± 19.8 mL/min per 1.73 m2, respectively; P = 0.025) (Figure 5B).
A significant increase in proteinuria was observed at months 24 and 36 after conversion versus baseline (0.389 ± 0.754 g/day and 0.405 ± 0.776 g/day vs. 0.294 ± 0.656 g/day, respectively; P < 0.001) (Figure 6). At the time of conversion, 544 patients of the 1832 patients included in the study (29.7%) were treated with angiotensin converting enzyme inhibitors or angiotensin II receptor blockers. After 3 years, 597 patients of the 1435 patients who completed the extension study were being treated with these drugs (41.6%).
FIGURE 6.
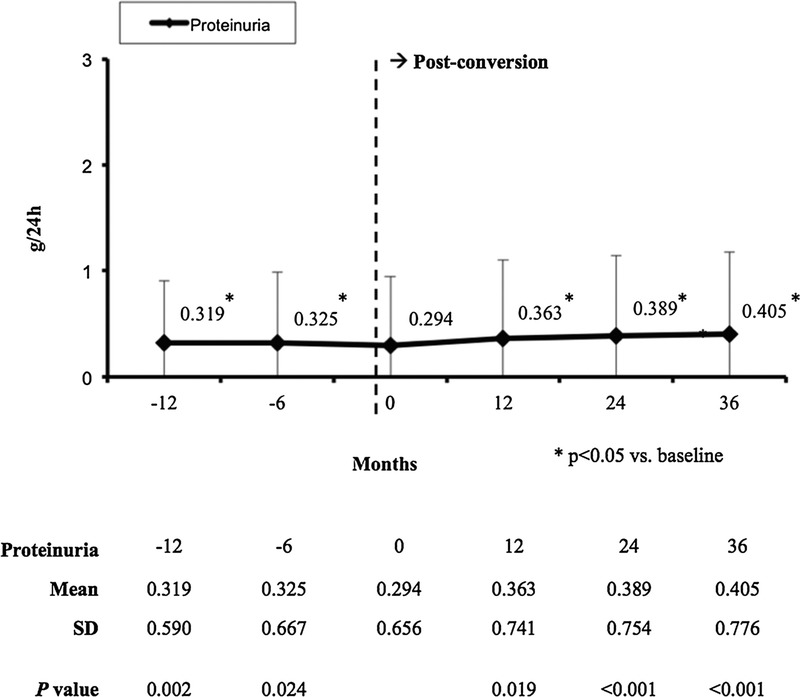
Mean (± SD) proteinuria (g/24 h).
Rejection Incidence
The incidences of acute rejections during the first, second, and third postconversion years were 0.6%, 1.1%, and 0.4%, respectively.
Other Variables
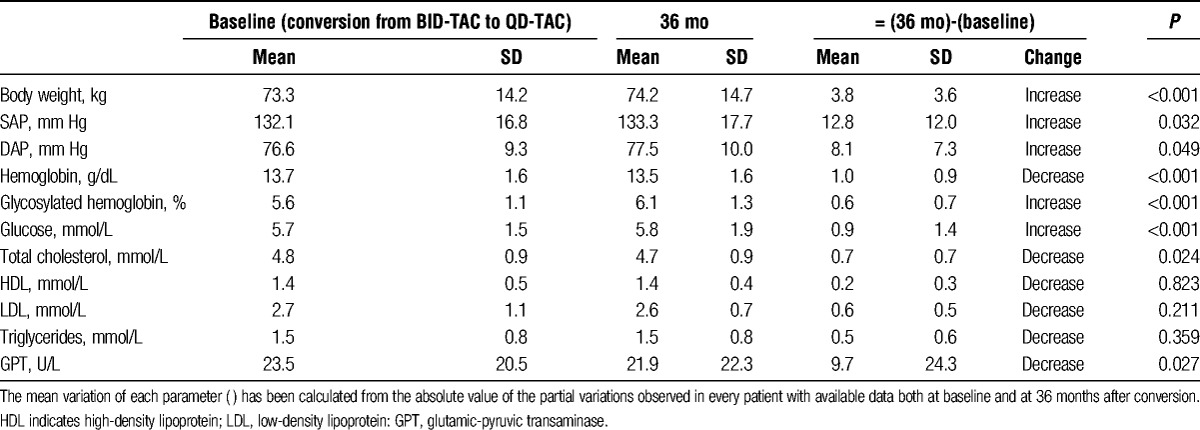
Compared with baseline, some changes that reached statistical significance were found at 36 months after conversion in the values of body weight, blood pressure, hemoglobin, blood glucose, glycosylated hemoglobin, total cholesterol, and glutamic-pyruvic transaminase (P < 0.05) (Table 2).
TABLE 2.
Evolution of clinical and analytical parameters during the study
DISCUSSION
The prolonged release formulation of TAC has provided a more convenient QD dosing, which has improved patient adherence, decreased the within-patient variability of TAC blood concentrations and is preferred by the patients over the BID formulation.5-7,10 This QD formulation has shown to be noninferior to the BID formulation regarding efficacy failure (including graft loss, biopsy-confirmed acute rejection and graft dysfunction) in an immunosuppressive regimen based on the same TAC starting dose and no induction therapy.16 In addition, previous studies showed some evidence pointing toward QD-TAC being associated with better renal function, as compared to the BID formulation.12-14
In the current 3-year extension study of a previously published 1-year prospective study of conversion from BID-TAC to QD-TAC,10 we wanted to assess mainly the medium-term evolution of the renal function after the conversion. Three years after the conversion from BID-TAC to QD-TAC, the observation was that, when censoring patients who needed to go back to dialysis, renal function was very stable.
It is well known that renal function declines gradually after transplantation. In a large cohort of renal transplant recipients treated with BID-TAC, after 6 months from transplantation, the GFR decreased an average of −1.66 mL/min per 1.73 m2 per year over a median follow-up of 5.7 years.17 This GFR decline rate varies according to the GFR baseline level, with lower levels showing more rapid rates of decline.18-20 The transplant registry of the Autonomous Community of Catalonia (a North-East region of Spain) is an observational initiative that records the evolution of all KTRs since the mid 1980s. The cohort of patients included in this registry might be considered as a “control cohort,” suitable for comparing with our cohort of patients converted from BID-TAC to QD-TAC in the routine clinical practice, because it includes a large number of KTRs treated in the clinical setting in Spain, which frequently involves the use of BID-TAC (81% of the patients in the registry are treated with BID-TAC). According to the 1990 to 2011 period report of the registry, the eGFR of first renal transplant recipients decreased at an annual average of −1.21 ± 11.2 mL/min per 1.73 m2 (N = 4180).21 In this analysis, patients who lost their graft were considered as MDRD = 0 in that year's follow-up but were censored from 1 year onward to estimate the evolution of the eGFR. Thus, the reported registry's annual eGFR decrease rate can be compared to that of the current study, when censoring patients who lost their graft function and reinitiated dialysis. In this regard, it is remarkable that mean eGFR of our patients stayed at similar levels at 3 years since conversion from BID-TAC to QD-TAC, that is, no significant decrease was observed between the value at conversion and the value at 36 months. If any, a numerical improvement in function was observed from baseline to month 36, although not statistically significant (from 56.7 to 58.1 mL/min per 1.73 m2 [+1.4 mL/min per 1.73 m2; annual change rate at 3 years after conversion: +0.47 mL/min per 1.73 m2]). Even when patients who needed to go back to dialysis were counted in the analysis as having an eGFR = 0, the eGFR remained very stable. In fact, a significant (but not clinically relevant) increase of +0.1 mL/min per 1.73 m2 was observed in the mean eGFR values between baseline and the end of the extension study (from 56.7 to 56.8 mL/min per 1.73 m2; annual change rate at 3 years after conversion: +0.03 mL/min per 1.73 m2]). Thus, the renal function in patients converted from BID-TAC to QD-TAC remains very stable and better than expected.
Despite the percentage of patients treated with angiotensin-converting enzyme inhibitors or angiotensin II receptor blockers was increased at 3 years after the conversion versus baseline (+12%), a significant increase in proteinuria was observed at the end of follow-up. However, this increase was small (only +0.1 g/day approximately) and nonclinically relevant.
Maintenance of the target blood levels of immunosuppressive drugs is a main factor determining transplant function, with high variability of blood concentrations potentially leading to over or underexposure of the drug (2 situations that can be associated with a greater risk of toxicity or acute rejection and graft loss, respectively).9 In this regard, a possible explanation of the stability in renal function observed with QD-TAC might be the more stable TAC blood concentration compared with the BID formulation.6-8 In our study, the numerically smaller standard deviations of the TAC trough levels observed at 12, 24, and 36 months after conversion versus preconversion suggest that the interpatient variability of the TAC levels was lower with QD-TAC and that more stable levels were achieved with the QD formulation (Figure 2B). Lower within-patient variability of the TAC levels has also been observed with the conversion from BID-TAC to QD-TAC. In a prospective 6-month study by Wu et al6, in which 129 stable KTRs were converted milligram-for-milligram from BID-TAC to QD-TAC, the mean within-patient percent coefficient of variation of TAC trough concentration was significantly lower with QD-TAC (8.5 ± 5.0% vs 14.0 ± 7.5%; P < 0.05). In our study, the coefficient of variation of the TAC levels changed after the conversion from BID-TAC to QD-TAC, with significantly more patients presenting a low coefficient (defined as a coefficient ≤20%) with the QD formulation versus the BID formulation. Before the conversion (patients treated with BID-TAC), 44.5% of the patients had a coefficient of variation of the TAC levels of 20% or less. After the conversion to QD-TAC, this percentage was 49.1%. Additionally, BID-TAC has 2 peaks of concentration (morning and evening), whereas QD-TAC produces only the morning peak, which is lower than the BID-TAC morning one.2,22 Because high peak levels may be associated with toxic effects, having lower peaks should have a positive effect regarding toxicity, which would result in less graft function decline. Also, QD-TAC provides lower exposure to the drug23-25 and lower variability in 24-hour exposure,8 which would also result in less toxicity and more stable function (although whether a lower exposure is associated with lesser calcineurin inhibitor toxicity-related graft injury remains undetermined).
As seen in other prospective conversion studies,6 in the EVOLUTION study, a moderate significant decrease of less than 1 ng/mL in the TAC levels was observed after the conversion from BID-TAC to QD-TAC, which required a temporal increase in the daily dose during the first year of follow-up10 (in the routine clinical practice in Spain the most frequent targeted TAC C0 levels for maintenance patients are 6–7 ng/mL). During the extension period up to 3 years, the TAC levels were very stable (∼0.8 ng/mL significantly lower vs baseline) with mean daily doses similar to those at the time of conversion (the mean dosage value at 36 months after conversion was found to be significantly lower vs baseline, but a difference of −0.2 mg/day can be considered nonclinically relevant). Despite this moderate decrease in the TAC levels observed with QD-TAC, the low acute rejection rate, similar to that observed in patients treated with the BID formulation,26 probably suggests that sufficient immunosuppression was provided in the majority of these patients. However, it must be taken into account that only stable patients (without acute rejections and without relevant increases in serum creatinine during the year before conversion) were included in the original EVOLUTION study. On the other hand, the main cause of allograft loss was chronic humoral rejection (2% of the patients). Unfortunately, data regarding the immunological status of the patients during follow-up (i.e., the determination of the de novo donor-specific antibodies) are lacking, because most of the participant centers did not routinely collect this kind of information at the time of the study. Additionally, the obtaining of biopsies was not routinely performed because it was an observational study.
Tolerability was similar to that observed in other studies with the BID formulation26 and the percentage of treatment discontinuations was low. Some changes regarding body weight, blood pressure, or blood glucose, among others, reached statistical significance at month 36 versus the time of conversion. None of these changes were clinically relevant, and most of them are frequently seen in the majority of KTRs as the time of transplantation progresses (e.g., an increasing body weight, which is frequently related with sedentary lifestyles or the chronic use of steroids). Regarding glycosylated hemoglobin, it has been observed in kidney and liver transplant recipients that after the conversion from BID-TAC to QD-TAC, it remains stable.27,28 However, glycosylated hemoglobin was increased in our study at 3 years after the conversion from BID-TAC to QD-TAC (+0.6%). In our opinion, this was probably due to the influence over time of steroids, the increase in age, and the increase in body weight.
The limitations of the study are those inherent to the observational design (some of them have been already mentioned), being the absence of a control group the most important. We did not control for potential confounders as comorbidities in the analysis of renal function. The potential correlation between the TAC levels observed during follow-up and eGFR, acute rejection or graft loss was not assessed (although no correlation was found between any of these parameters in the original 1-year prospective study). However, our study provides information about the use of QD-TAC in routine clinical practice in a large number of patients of different profiles followed for up to 3 years. To our knowledge, this is the longest observational study assessing the safety and efficacy of conversion from BID standard release TAC to QD prolonged release TAC in maintenance KTRs.
In conclusion, KTRs converted from BID-TAC to QD-TAC show a medium-term stable dose and trough levels of TAC and good preservation of renal function. Remarkably, the mean average of eGFR annual change observed 3 years after the conversion was +0.47 mL/min per 1.73 m2, in contrast with the negative change rates observed in other similar kidney transplant cohorts in Spain. The potential reasons by which QD-TAC may help preserve renal function are multiple: by improving adherence to immunosuppressive treatment, by decreasing the within-patient variability to TAC, by maintaining stable levels, and by maintaining an adequate equilibrium between immunosuppressive action and nephrotoxicity, all of which help to preserve renal function. Comparative studies to confirm these findings are warranted.
Footnotes
The authors declare no funding or conflicts of interest.
L.G. participated in the research design, the performance of the research, the data analysis and the writing of the article. D.B. participated in the performance of the research and the writing of the article. C.C. participated in the performance of the research and the writing of the article. A.F. participated in the performance of the research and the writing of the article. A.F. participated in the performance of the research and the writing of the article. M.Á.G. participated in the performance of the research and the writing of the article. A.M. participated in the performance of the research and the writing of the article. J.V.T. participated in the performance of the research and the writing of the paper. E.G.H. participated in the performance of the research and the writing of the article. J.C.R. participated in the performance of the research and the writing of the article. J.S.P. participated in the performance of the research and the writing of the article. J.P. participated in the performance of the research and the writing of the article. R.L. participated in the performance of the research and the writing of the article. S.Z. participated in the performance of the research and the writing of the article. A.O. participated in the performance of the research and the writing of the article. C.J. participated in the performance of the research and the writing of the article. Á.A. participated in the performance of the research and the writing of the article. A.R. participated in the performance of the research and the writing of the article. B.B. participated in the data analysis and the writing of the article. D.H. participated in the performance of the research and the writing of the article.
Contributor Information
Collaborators: Spanish Group of New Projects in Transplantation (Grupo Español de Actualizaciones en Trasplante)
REFERENCES
- 1. Chisholm MA, Middleton MD. Modified-release tacrolimus. Ann Pharmacother. 2006; 40: 270– 275. [DOI] [PubMed] [Google Scholar]
- 2. Alloway R, Steinberg S, Khalil K, et al. Conversion of stable kidney transplant recipients from a twice daily Prograf-based regimen to a once daily modified release tacrolimus-based regimen. Transplant Proc. 2005; 37: 867– 870. [DOI] [PubMed] [Google Scholar]
- 3. Silva HT, Jr, Yang HC, Abouljoud M, et al. One-year results with extended-release tacrolimus/MMF, tacrolimus/MMF and cyclosporine/MMF in de novo kidney transplant recipients. Am J Transplant. 2007; 7: 595– 608. [DOI] [PubMed] [Google Scholar]
- 4. Krämer BK, Charpentier B, Bäckman L, et al. Tacrolimus once daily (ADVAGRAF) versus twice daily (PROGRAF) in de novo renal transplantation: a randomized phase III study. Am J Transplant. 2010; 10: 2632– 2643. [DOI] [PubMed] [Google Scholar]
- 5. Kuypers DR, Peeters PC, Sennesael JJ, et al. Improved adherence to tacrolimus once-daily formulation in renal recipients: a randomized controlled trial using electronic monitoring. Transplantation. 2013; 95: 333– 340. [DOI] [PubMed] [Google Scholar]
- 6. Wu MJ, Cheng CY, Chen CH, et al. Lower variability of tacrolimus trough concentration after conversion from Prograf to Advagraf in stable kidney transplant recipients. Transplantation. 2011; 92: 648– 652. [DOI] [PubMed] [Google Scholar]
- 7. Kurnatowska I, Krawczyk J, Oleksik T, et al. Tacrolimus dose and blood concentration variability in kidney transplant recipients undergoing conversion from twice daily to once daily modified release tacrolimus. Transplant Proc. 2011; 43: 2954– 2956. [DOI] [PubMed] [Google Scholar]
- 8. Stifft F, Stolk LM, Undre N, et al. Lower variability in 24-hour exposure during once-daily compared to twice-daily tacrolimus formulation in kidney transplantation. Transplantation 2013; 97: 775– 780. [DOI] [PubMed] [Google Scholar]
- 9. Borra LC, Roodnat JI, Kal JA, et al. High within-patient variability in the clearance of tacrolimus is a risk factor for poor long-term outcome after kidney transplantation. Nephrol Dial Transplant. 2010; 25: 2757– 2763. [DOI] [PubMed] [Google Scholar]
- 10. Guirado L, Cantarell C, Franco A, et al. Efficacy and safety of conversion from twice-daily to once-daily tacrolimus in a large cohort of stable kidney transplant recipients. Am J Transplant. 2011; 11: 1965– 1971. [DOI] [PubMed] [Google Scholar]
- 11. Lauzurica R, Morales JM, van Hooff J, et al. Renal function and safety in stable kidney transplant recipients converted from immediate-release to prolonged-release tacrolimus. Transpl Int. 2012; 25: 48– 55. [DOI] [PubMed] [Google Scholar]
- 12. van Hooff JP, Alloway RR, Trunečka P, et al. Four-year experience with tacrolimus once-daily prolonged release in patients from phase II conversion and de novo kidney, liver, and heart studies. Clin Transplant. 2011; 25: E1– E12. [DOI] [PubMed] [Google Scholar]
- 13. Kolonko A, Chudek J, Wiecek A. Improved kidney graft function after conversion from twice daily tacrolimus to a once daily prolonged-release formulation. Transplant Proc. 2011; 43: 2950– 2953. [DOI] [PubMed] [Google Scholar]
- 14. Tinti F, Meçule A, Poli L, et al. Improvement of graft function after conversion to once daily tacrolimus of stable kidney transplant patients. Transplant Proc. 2010; 42: 4047– 4048. [DOI] [PubMed] [Google Scholar]
- 15. Zaltzman JS, Lai V, Schulz MZ, et al. A randomized cross-over comparison of short-term exposure of once-daily extended release tacrolimus and twice-daily tacrolimus on renal function in healthy volunteers. Transpl Int. 2014; 27: 1294– 1302. [DOI] [PMC free article] [PubMed] [Google Scholar]
- 16. Albano L, Banas B, Klempnauer JL, et al. OSAKA trial: a randomized, controlled trial comparing tacrolimus QD and BD in kidney transplantation. Transplantation. 2013; 96: 897– 903. [DOI] [PMC free article] [PubMed] [Google Scholar]
- 17. Gill JS, Tonelli M, Mix CH, et al. The change in allograft function among long-term kidney transplant recipients. J Am Soc Nephrol. 2003; 14: 1636– 1642. [DOI] [PubMed] [Google Scholar]
- 18. National Kidney F K/DOQI clinical practice guidelines for chronic kidney disease: evaluation, classification, and stratification. Am J Kidney Dis. 2002; 39: S1– S266. [PubMed] [Google Scholar]
- 19. Shulman NB, Ford CE, Hall WD, et al. Prognostic value of serum creatinine and effect of treatment of hypertension on renal function. Results from the hypertension detection and follow-up program. The Hypertension Detection and Follow-up Program Cooperative Group. Hypertension. 1989; 13: I80– I93. [DOI] [PubMed] [Google Scholar]
- 20. Massy ZA, Nguyen Khoa T, Lacour B, et al. Dyslipidaemia and the progression of renal disease in chronic renal failure patients. Nephrol Dial Transplant. 1999; 14: 2392– 2397. [DOI] [PubMed] [Google Scholar]
- 21. Variació anual de la funció renal (MDRD) Font: Registre de malalts renals de Catalunya. Dades fins a 31/12/2011. In Versió 03/12/2013. Edition Barcelona: Organització Catalana de Trasplantaments (OCATT); 2013. [Google Scholar]
- 22. First MR, Fitzsimmons WE. New drugs to improve transplant outcomes. Transplantation. 2004; 77: S88– S92. [DOI] [PubMed] [Google Scholar]
- 23. Hougardy JM, Broeders N, Kianda M, et al. Conversion from Prograf to Advagraf among kidney transplant recipients results in sustained decrease in tacrolimus exposure. Transplantation. 2011; 91: 566– 569. [DOI] [PubMed] [Google Scholar]
- 24. Slatinska J, Rohal T, Wohlfahrtova M, et al. Long-term follow-up of stable kidney transplant recipients after conversion from tacrolimus twice daily immediate release to tacrolimus once-daily prolonged release: a large single-center experience. Transplant Proc. 2013; 45: 1491– 1496. [DOI] [PubMed] [Google Scholar]
- 25. Niioka T, Satoh S, Kagaya H, et al. Comparison of pharmacokinetics and pharmacogenetics of once- and twice-daily tacrolimus in the early stage after renal transplantation. Transplantation. 2012; 94: 1013– 1019. [DOI] [PubMed] [Google Scholar]
- 26. Krämer BK, Del Castillo D, Margreiter R, et al. Efficacy and safety of tacrolimus compared with ciclosporin A in renal transplantation: three-year observational results. Nephrol Dial Transplant. 2008; 23: 2386– 2392. [DOI] [PubMed] [Google Scholar]
- 27. Alloway R, Steinberg S, Khalil K, et al. Two years postconversion from a Prograf-based regimen to a once-daily tacrolimus extended-release formulation in stable kidney transplant recipients. Transplantation. 2007; 83: 1648– 1651. [DOI] [PubMed] [Google Scholar]
- 28. Florman S, Alloway R, Kalayoglu M, et al. Once-daily tacrolimus extended release formulation: experience at 2 years postconversion from a Prograf-based regimen in stable liver transplant recipients. Transplantation. 2007; 83: 1639– 1642. [DOI] [PubMed] [Google Scholar]