Supplemental digital content is available in the text.
ABSTRACT
New analytical techniques for multiparametric characterisation of individual cells are likely to reveal important information about the heterogeneity of immunological responses at the single-cell level. In this proof-of-principle study, laser ablation inductively coupled plasma mass spectrometry (LA-ICP-MS) was applied to the problem of concurrently detecting 24 lineage and activation markers expressed by human leucocytes. This approach was sufficiently sensitive and specific to identify subpopulations of isolated T, B, and natural killer cells. Leucocyte subsets were also accurately detected within unfractionated peripheral blood mononuclear cells preparations. Accordingly, we judge LA-ICP-MS to be a suitable method for assessing expression of multiple tissue antigens in solid-phase biological specimens, such as tissue sections, cytospins, or cells grown on slides. These results augur well for future development of LA-ICP-MS–based bioimaging instruments for general users.
Immunologists are only now beginning to appreciate the heterogeneity of immune responses at the level of single cells.1 Developing novel technologies to measure multiple phenotypic properties of single cells in solid-phase specimens could be a key to a more sophisticated understanding of the diverse behaviors of individual cells.2 Single-cell transcriptomics,3 single-cell genomics4,5 and mass cytometry6-8 have already revealed unexpected levels of complexity to previously well-studied immune reactions. Important new insights into the function of immune cells within their native microenvironments would undoubtedly follow if an equivalent, highly multiplexed instrument were available to visualize single cells in tissues.9 To this end, our group has adapted a laser ablation inductively coupled mass spectrometry (LA-ICP-MS) system as a tool for imaging biological specimens.
The LA-ICP-MS is an analytical technique commonly used in many fields, including material and earth sciences, that involves the vaporization of small parts of a solid sample with a focused pulse of high-irradiance laser energy.10 The vaporized material is then analyzed by mass spectrometry. By contiguous sampling across a specimen, a data set relating spatial information and elemental composition is generated. This data set can then be represented by 2-dimensional scatter plots or used to construct a marker distribution map. Recently, our group has explored the use of LA-ICP-MS as a method of tracking gold-labeled cells in vitro and in vivo.10 This work demonstrated the feasiblility of detecting very infrequent metal-labeled cells in tissue sections.
Elemental tagging of tissue antigens before LA-ICP-MS using metal-labeled antibodies, such as those currently used for mass cytometry, allows for detection of specific tissue antigens.11 As many as 80 isotopes could be used as labels for detection by LA-ICP-MS; however, sensitivity is compromised by detecting multiple elements when using currently available instruments with quadrupole mass analyzers. Two complementary solutions to this problem exist, namely, “front end” adaptations that improve sampling efficiency and “back end” solutions that improve detection efficiency. Replacing a sequentially detecting mass spectrometer with a simultaneously detecting mass spectrometer (such as those used in MALDI-TOF mass spectrometers) is an obvious means of improving detection efficiency. This proof-of-principle study evaluated possible “front end” adaptations of our existing apparatus, including installation of better lasers and a more efficient sampling chamber, with the objective of building an instrument capable of multiparametric analysis of tissue antigen expression at an acceptable level of sensitivity. Using this instrument, it was possible to concurrently detect 24 lineage and activation markers expressed by human PBMC when presented as solid-phase samples.
MATERIALS AND METHODS
Isolation of Human Leucocytes
Human PBMC were isolated from whole blood by Ficoll density gradient centrifugation. To minimize biological variation across the study, all whole blood samples were drawn from 1 healthy 37-year-old white male donor. The accuracy of LA-ICP-MS analysis was tested using enriched populations of CD4+ T cells, CD8+ T cells, CD19+ B cells, and CD56+ NK cells that were obtained by MACS separation (Miltenyi Biotec, Bergisch-Gladbach, Germany).
Preparation of PBMC for Flow Cytometry
Staining was performed according to ONE Study protocols, as described previously.12 Measurements were made using a Navios cytometer (Beckman Coulter, Munich, Germany), and data were analyzed using FlowJo v7.6.5 (FlowJo LLC, Ashton, OR).
Preparation of PBMC for LA-ICP-MS
Cell-surface staining was performed at 4°C in DPBS/1% BSA/0.02% NaN3/10% FcR-block (Miltenyi) using primary metal-tagged MaxPar® antibodies (Fluidigm Sciences Inc., Sunnyvale, CA) at the recommended concentrations for mass spectrometry (Table S1, SDC, http://links.lww.com/TXD/A12). Labeled cells were then cytospun onto SuperFrost glass microscope slides (Thermo Fisher Scientific, Schwerte, Germany) and air-dried before staining with Diff-Quik Giemsa reagents (Medion Diagnostics, Munich, Germany).
Analysis of samples by LA-ICP-MS
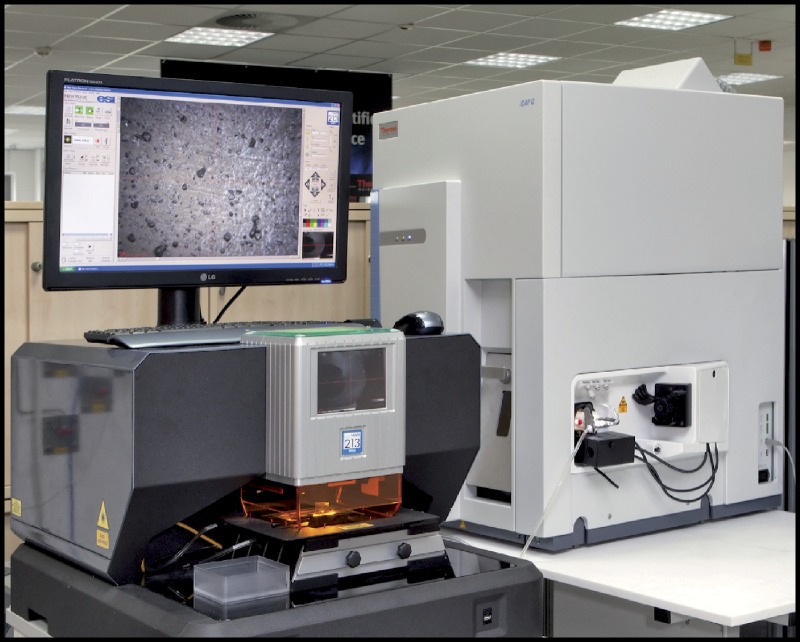
Analyses were performed on a LA system (NWR213, Nd:YAG, λ 213 nm; Electro Scientific Industries, Portland, OR) coupled to a quadrupole ICP-MS instrument (iCAP Q; Thermo Scientific, Bremen, Germany) (Figure 1). The LA system was fitted with a high-efficiency 2-volume ablation cell. Helium was used as the ablation gas, at a typical flow rate of 0.8 L/min, with an argon make-up flow introduced after the ablation cell at a flow rate of 0.75 L/min. Single cell identification was demonstrated by ablating 10-μm diameter areas at locations corresponding to individual cells. Only single cells were targeted: cells present in clusters or closer than 5 μm apart were discounted. The presence of label was determined from the time-resolved signal intensity profile of the rare-earth labels. Imaging of the cells and tissue sections was accomplished by performing adjacent line scans of a 10 μm × 5 μm rectangular pulsed laser beam over sections of the slide, measuring 24 rare-earth isotopes (m/z 141 to 176) and 191Ir in time-resolved mode. Two-dimensional scatter plots were generated in GraphPad Prism software (GraphPad Software, Inc. La Jolla, CA). Tissue images were constructed using Iolite version 2.5 (Melbourne Isotope Group, Melbourne, Australia), a freeware data deconvolution package, which runs on the IGOR-Pro 6.22A platform (WaveMetrics Inc., Lake Oswego,OR). The software converts each raw data point into a color-coded pixel, thus the color profile of the resulting image depicts the distribution of the respective elements across the sampled region.
FIGURE 1.

Analyses were performed on a laser ablation system (NWR213, Nd:YAG, λ 213 nm, ElectroScientific Industries) coupled to a quadrupole ICP-MS instrument (iCAP Q; Thermo Scientific).
RESULTS
Accurate Detection of Leucocyte Lineage Markers by LA-ICP-MS
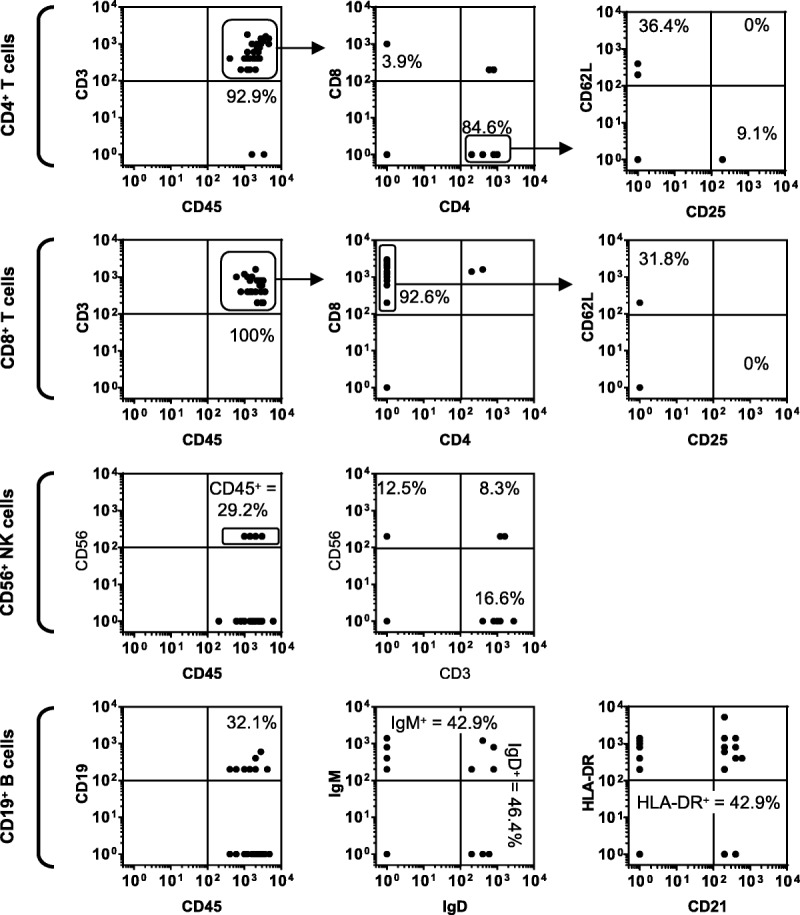
To test whether LA-ICP-MS enables accurate detection of multiple leucocyte antigens, expression of 24 lineage and activation markers was examined in cytospins of enriched human leucocyte populations stained with metal-labeled antibodies. CD4+ and CD8+ T cells, CD56+ NK cells and CD19+ B cells were positively selected from human PBMC preparations using magnetic beads before labeling with a cocktail of MaxPar monoclonal antibodies. Labeled cells were immobilized on glass slides by cytospin and then conventionally counterstained with Giemsa. These specimens were then interrogated by LA-ICP-MS with the aim of sampling at least 25 single cells. As discussed below, speed of analysis is currently a limiting consideration with LA-ICP-MS, especially when manually selecting target cells for ablation. Each cell was ablated with contiguous shots of a 10-μm diameter laser and signals corresponding to the same cell were integrated. Operating at a sampling rate of 200 Hz, the lowest positive signal for any particular label was 200 counts/s (c/s). Given a detection efficiency of 0.01%, a signal of 200 c/s corresponds to 10 000 ions entering the mass spectrometer. Accordingly, we can be confident that values above 200 c/s are true-positive signals, but signals below this limit may be true or false negatives (Figure S1, SDC, http://links.lww.com/TXD/A12).
Two-dimensional scatter plots are an intuitive way of presenting data generated by LA-ICP-MS, similar to the way that flow cytometry data are conventionally displayed (Figure 2). In the CD4+ T cell preparation, 100% of analyzed cells were CD45+ and 92.9% expressed CD3+. The mean CD45 signal intensity was 2179 c/s (48% relative SD) and the mean CD3 signal intensity for CD3+ cells was 754 c/s (62% relative SD), so detection of both antigens readily exceeded the negative cutoff. After “gating” on CD45+ CD3+ events, these T cells could be classified according to CD4 and CD8 expression, and then further subdivided according to CD62L and CD25 expression. About 84.6% of CD45+ CD3+ cells in the CD4+ preparation expressed CD4, whereas only 3.9% was CD4− CD8+. In the CD8+ T-cell preparation, 100% of analyzed cells were CD45+ with a mean CD45 signal intensity of 2059 c/s (38.9% relative SD) which was not significantly different to the level of signal measured in CD4+ T cells (p=0.64). About 92.6% of cells in the CD8+ T-cell preparations were associated with positive CD3 signals, which had a mean signal intensity for CD3+ cells of 624 c/s (54.8% relative SD) which was not significantly different to the signal measured in CD4+ T cells (P = 0.27). About 96.0% of CD45+ CD3+ cells in the CD8+ preparation expressed CD8, whereas 0% was CD4+ CD8−. Hence, the frequencies of CD4+ and CD8+ cells in the respective CD4+ T cell and CD8+ T cell preparations demonstrate the accuracy of CD4 and CD8 detection by LA-ICP-MS.
FIGURE 2.

Assessing the accuracy of cell-surface marker detection by LA-ICP-MS. Magnetic beads were used to isolate human CD4+ T cells, CD8+ T cells, CD56+ NK cells, and CD19+ B cells. These cell preparations were labeled with a cocktail of metal-tagged monoclonal antibodies against a panel of common human leucocyte lineage and activation markers. Labeled cells were cytospun onto glass microscope slides and counterstained with Giemsa. Samples were then interrogated by LA-ICP-MS. The resultant data sets are presented as 2-dimensional scatter plots showing signal intensities as counts per second.
All cells in a near-pure preparation of CD56+ NK cells were CD45+ (mean signal intensity of 1664 c/s; 72.2% relative SD) (Figure 2). However, only 29.2% of events were associated with CD56 signal (mean signal intensity of 200 c/s), indicating detection sensitivity was inadequate. Likewise, in a near-pure CD19+ B-cell preparation, 100% of cells expressed CD45 (mean signal intensity of 1980 c/s; 58.7% relative SD); however, only 32.1% detectably expressed CD19 (mean signal intensity of 267 c/s; 53.0% relative SD). Within the B-cell preparation, 42.9% cells expressed surface IgM (mean signal intensity of 517 c/s; 83.3% relative SD), 46.4% cells expressed IgD (mean signal intensity of 385 c/s; 61.7% relative SD), 85.7% cells expressed HLA-DR (mean signal intensity of 858 c/s; 117% relative SD), and 53.6% cells expressed CD21 (mean signal intensity of 293 c/s; 43.6% relative SD).
Detection of Leucocyte Lineage Markers by LA-ICP-MS in Unfractionated PBMC
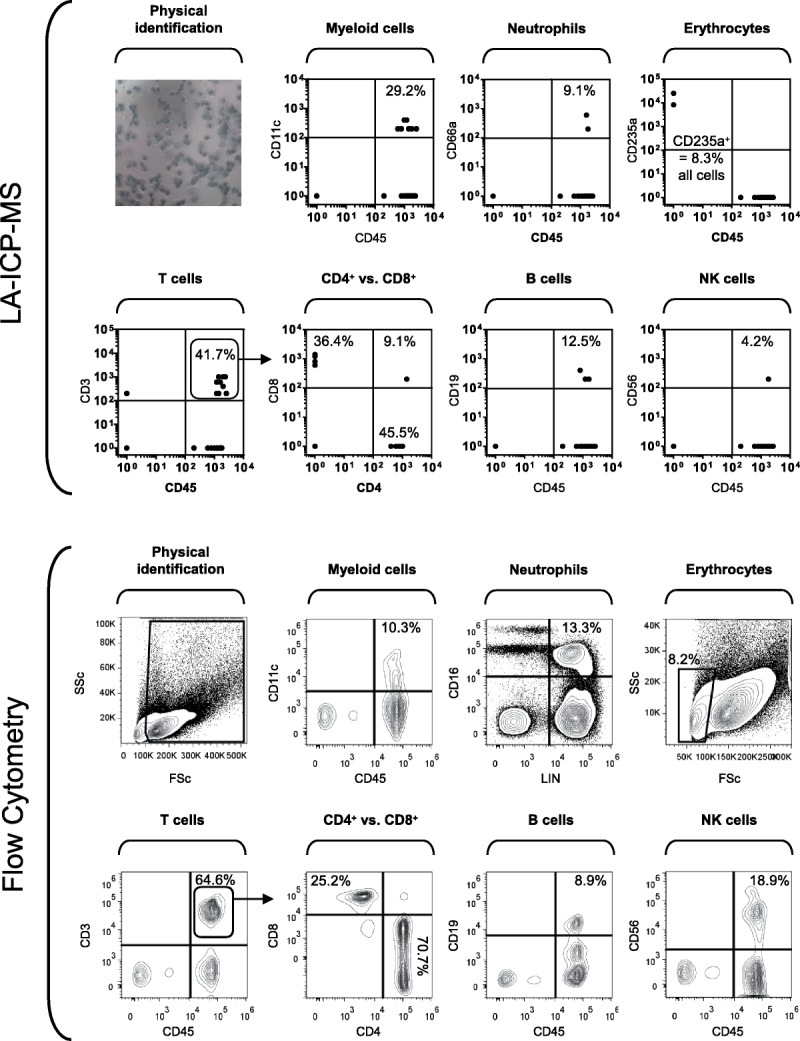
Having detected leucocyte antigen expression in enriched lymphocyte subsets, we next asked whether the same panel of antigens could be detected in unfractionated human PBMC and whether a reasonable estimate of leucocyte subset frequencies could be obtained by LA-ICP-MS. Unfractionated PBMC were prepared for LA-ICP-MS analysis using the same protocol used for fractionated PBMC. In parallel, unfractionated PBMC were stained with fluorescent antibodies for conventional immunophenotyping by flow cytometry (Figure 3). Notably, the 24 lineage markers concurrently detected by LA-ICP-MS had to be distributed into 6 separate panels for analysis by flow cytometry. Using LA-ICP-MS, it was possible to detect CD11c+ myeloid cells, CD66a+ granulocytes, CD235a+ erythrocytes, CD4+ and CD8+ T cells, CD19+ B cells and CD56+ NK cells at frequencies that were broadly similar to those measured by flow cytometry given the small number of sampled cells. Discrepancies in the frequencies of NK cells and myeloid cells determined by the 2 methods is likely due to low sensitivity of detection of CD56 signals and operator-bias in visually selecting cells for analysis. The precision of LA-ICP-MS will be improved by increasing the sampling speed and automation, which will allow the analysis of a greater number of cells, and increasing detection sensitivity using an alternative mass spectrometer.
FIGURE 3.

Analysis of cell-surface marker expression in unfractionated human PBMC immobilised on a glass surface by LA-ICP-MS compared to conventional flow cytometry. Unfractionated human PBMC were labeled with a cocktail of metal-tagged monoclonal antibodies against a panel of common human leucocyte lineage and activation markers. Labeled cells were then cytospun onto glass microscope slides before counterstaining with Giemsa. Samples were interrogated by LA-ICP-MS. The resultant data sets are presented as 2-dimensional scatter plots showing signal intensities as counts per second. For comparison, the same PBMC were also analyzed by conventional flow cytometry using fluorescence-labeled antibodies.
Construction of Antigen Expression Maps
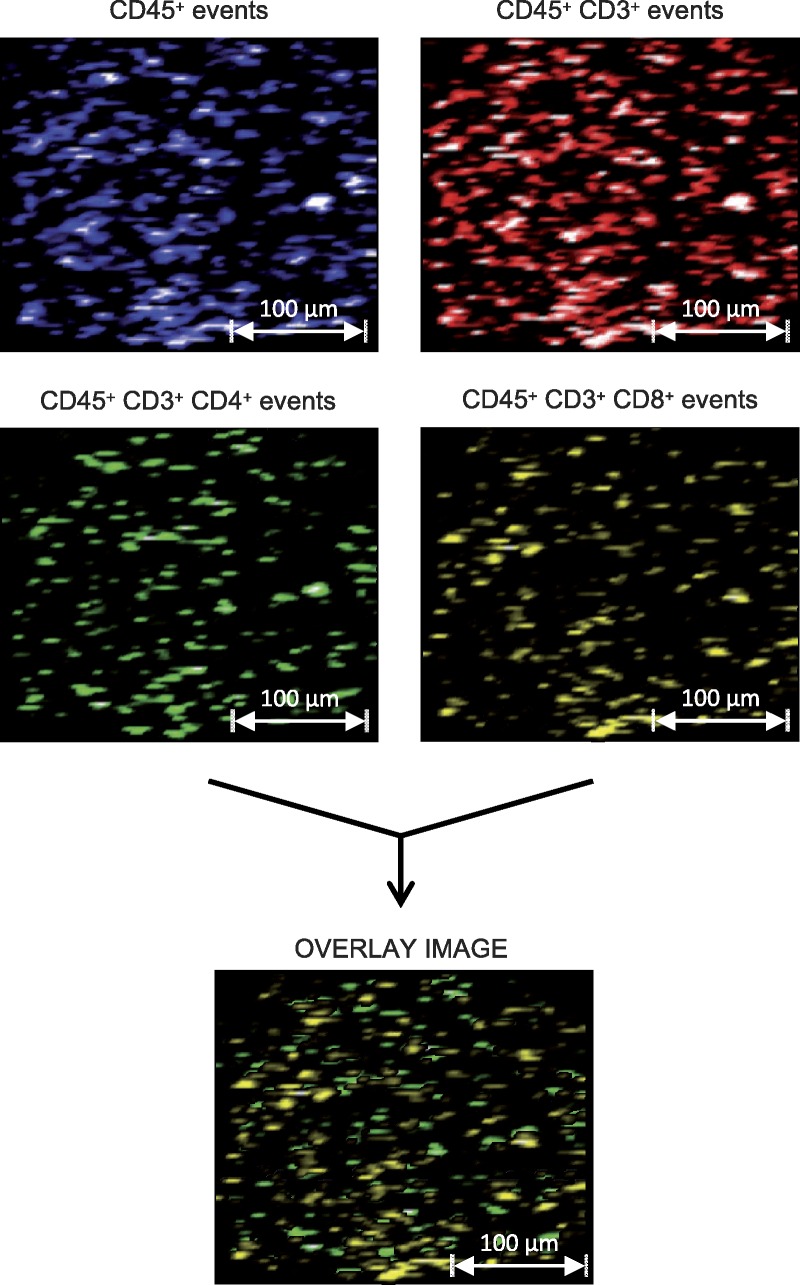
Because each laser shot is made in a defined position, it is possible to use LA-ICP-MS to reconstruct maps of the analyzed sample that use color intensity to represent signal intensity. By this approach, we can visualize the distribution of detected antigens within a sample, creating images similar to conventional immunohistochemical pictures. Accordingly, LA-ICP-MS generates a data set that can be viewed like a microscope image, but one that can be easily interconverted with numerical representations of antigen expression. To illustrate this concept, T-cell marker expression data obtained from an unfractionated PBMC preparation is displayed as intensity images (Figure 4). As with conventional fluorescence microscopy, it is possible to create “overlay” images with LA-ICP-MS data; however, LA-ICP-MS could also be used to “gate” cell populations for display within an image, which is a useful way of reducing the high-dimensionality data sets produced by LA-ICP-MS.
FIGURE 4.

Representation of cell-surface marker expression in unfractionated human PBMC preparations as signal intensity maps. Unfractionated human PBMC were labeled with a cocktail of metal-tagged monoclonal antibodies against a panel of common human leucocyte lineage and activation markers. Labeled cells were then cytospun onto glass microscope slides before counterstaining with Giemsa. Samples were interrogated by LA-ICP-MS. The resultant data sets are represented as pictures that relate spatial position and signal intensity. By “gating” the data shown, the complexity of each image can be usefully reduced.
DISCUSSION
New technologies enabling multiparametric investigation of single cells are already beginning to reveal unsuspected levels of complexity to immunological responses. Using LA-ICP-MS, our work aims to bring the same level of analytical power to immunohistochemical studies of tissue samples. Results presented here demonstrate that commercially available LA components coupled with a sequential ICP-MS allowed detection of cell-surface antigens labeled with metal-tagged antibodies at a adequate level for a 24-parameter phenotyping of PBMC. It was anticipated that use of a sequential mass spectrometer to determine such a large number of rare-earth antibody labels could compromise detection sensitivity; however, the antigens chosen for this study appear to be expressed at sufficient density that, by allowing the mass scanning device (quadrupole) to run at higher speeds than normal, positive detection of all markers was possible. It is anticipated that further improvements in sensitivity can be achieved using of simultaneous detectors (eg, ICP-TOF-MS) in future studies.
Handling multiparametric data sets presents researchers with many unfamiliar problems, not least with their statistical interpretation. Here, we demonstrate 2 qualitative methods of representing LA-ICP-MS data, namely, as images or scatter plots. Our reconstructed images of cytospun PBMC show that antigen distribution data can be plotted for interpretation in the same way as conventional micrographs; furthermore, these images show that conditional plotting of these data (eg CD45+ → CD3+ → CD8+) can reduce the image to show particular cell types without the need to reanalyze the sample. Alternatively, 2-dimensional scatter plots can be used to interrogate the phenotype of individual cells, in much the same way that conventional flow cytometry data are analyzed. The sort of high dimensionality data produced by LA-ICP-MS could also be analyzed using more sophisticated computational methods. Standard statistical approaches for reduction of multidimensional data sets, such as principal component analysis,8 could be applied to LA-ICP-MS results to reveal relationships between cell phenotypes or specimens; there are also specialized algorithms for interrogating complex phenotyping data, such as SPADE13 or viSNE.14 Unfortunately, speed of sampling (currently ∼15 cells/min) is a major limitation on the number of cells that can be analyzed with our current instrumentation, so collecting enough data for robust statistical analysis remains a practical challenge. Possible solutions for improving sampling speed are now being investigated.
At a spatial resolution of 10 μm, it was possible to identify single cells; however, some applications may demand finer resolution. There are 2 possible solutions to this problem, namely, reducing the dimensions of the laser beam or combining LA-ICP-MS technology with conventional fluorescence microscopy. Reducing the beam width is possible, but has several technical drawbacks. Most importantly, because each laser shot vaporizes a cylindrical core of material with a diameter equivalent to the beam diameter, the volume of ablated material changes with the cross-sectional area of the beam. Preliminary experiments have shown that ablation with a 1-μm laser diameter is possible; however, the sample volume is then reduced by a factor of 100 compared to a 10-μm laser diameter. Accordingly, reducing the laser beam width compromises detection sensitivity. A complementary approach is to combine LA-ICP-MS detection with conventional fluorescence microscopy, so that antigens that must be visualized in finest detail could be detected using fluorescent probes, whereas other markers could be detected by mass spectrometry. Both strategies are now being developed.
In conclusion, concurrent detection of 24 leucocyte markers represents a substantial technological advance, as previous instruments were limited to two signals. By coupling this efficient LA apparatus to a simultaneous detector, it should be possible to further improve the instrument's sensitivity. In turn, this should allow the use of a narrower laser beam, so generating finer-resolution images. The technological advances presented in this article are important steps toward the ultimate goal of developing an LA-ICP-MS-based bioimaging instruments for general users that combine the functionality of a microscope and a mass cytometer.
Supplementary Material
ACKNOWLEDGMENTS
The authors are grateful for the support of Dr. Simon Nelms of Thermo Fisher Scientific, UK.
Footnotes
Supplemental digital content (SDC) is available for this article. Direct URL citations appear in the printed text, links to the digital files are provided in the HTML text of this article on the journal’s Web site (www.transplantationdirect.com).
Grant support: The authors gratefully acknowledge the support of the European Union 7th Framework Programme through The ONE Study initiative (award 260687).
The authors declare no conflicts of interest.
REFERENCES
- 1. Chattopadhyay PK, Gierahn TM, Roederer M, et al. Single-cell technologies for monitoring immune systems. Nat Immunol. 2014; 15: 128– 35. [DOI] [PMC free article] [PubMed] [Google Scholar]
- 2. Hoppe PS, Coutu DL, Schroeder T. Single-cell technologies sharpen up mammalian stem cell research. Nat Cell Biol. 2014; 16: 919– 27. [DOI] [PubMed] [Google Scholar]
- 3. Shalek AK, Satija R, Shuga J, et al. Single-cell RNA-seq reveals dynamic paracrine control of cellular variation. Nature. 2014; 510: 363– 9. [DOI] [PMC free article] [PubMed] [Google Scholar]
- 4. Fan HC, Wang J, Potanina A, et al. Whole-genome molecular haplotyping of single cells. Nat Biotechnol. 2011; 29: 51– 7. [DOI] [PMC free article] [PubMed] [Google Scholar]
- 5. Dey SS, Kester L, Spanjaard B, et al. Integrated genome and transcriptome sequencing of the same cell. Nat Biotechnol. 2015; 33: 285– 9. [DOI] [PMC free article] [PubMed] [Google Scholar]
- 6. Becher B, Schlitzer A, Chen J, et al. High-dimensional analysis of the murine myeloid cell system. Nat Immunol. 2014; 15: 1181– 9. [DOI] [PubMed] [Google Scholar]
- 7. Bendall SC, Davis KL, Amir el-AD, et al. Single-cell trajectory detection uncovers progression and regulatory coordination in human B cell development. Cell. 2014; 157: 714– 25. [DOI] [PMC free article] [PubMed] [Google Scholar]
- 8. Newell EW, Sigal N, Bendall SC, et al. Cytometry by time-of-flight shows combinatorial cytokine expression and virus-specific cell niches within a continuum of CD8+ T cell phenotypes. Immunity. 2012; 36: 142– 52. [DOI] [PMC free article] [PubMed] [Google Scholar]
- 9. Giesen C, Wang HA, Schapiro D, et al. Highly multiplexed imaging of tumor tissues with subcellular resolution by mass cytometry. Nat Methods. 2014; 11: 417– 22. [DOI] [PubMed] [Google Scholar]
- 10. Managh AJ, SL Edwards, Bushell A, et al. Single cell tracking of gadolinium labeled CD4+ T cells by laser ablation inductively coupled plasma mass spectrometry. Anal Chem. 2013; 85: 10627– 34. [DOI] [PubMed] [Google Scholar]
- 11. Hutchinson RW, Cox AG, McLeod CW, et al. Imaging and spatial distribution of beta-amyloid peptide and metal ions in Alzheimer's plaques by laser ablation-inductively coupled plasma-mass spectrometry. Anal Biochem. 2005; 346: 225– 33. [DOI] [PubMed] [Google Scholar]
- 12. Streitz M, Miloud T, Kapinsky M, et al. Standardization of whole blood immune phenotype monitoring for clinical trials: panels and methods from the ONE study. Transplant Res. 2013; 2: 17. [DOI] [PMC free article] [PubMed] [Google Scholar]
- 13. Qiu P, Simonds EF, Bendall SC, et al. Extracting a cellular hierarchy from high-dimensional cytometry data with SPADE. Nat Biotechnol. 2011; 29: 886– 9. [DOI] [PMC free article] [PubMed] [Google Scholar]
- 14. Amir el-AD, Davis KL, Tadmor MD, et al. viSNE enables visualization of high dimensional single-cell data and reveals phenotypic heterogeneity of leukemia. Nat Biotechnol. 2013; 31: 545– 52. [DOI] [PMC free article] [PubMed] [Google Scholar]
Associated Data
This section collects any data citations, data availability statements, or supplementary materials included in this article.


