Background
Calcineurin inhibitor–associated nephrotoxicity and other adverse events have prompted efforts to minimize/eliminate calcineurin inhibitor use in kidney transplant recipients.
Methods
This open-label, randomized, multinational study evaluated the effect of planned transition from tacrolimus to sirolimus on kidney function in renal allograft recipients. Patients received tacrolimus-based immunosuppression and then were randomized 3 to 5 months posttransplantation to transition to sirolimus or continue tacrolimus. The primary end point was percentage of patients with 5 mL/min per 1.73 m2 or greater improvement in estimated glomerular filtration rate from randomization to month 24.
Results
The on-therapy population included 195 patients (sirolimus, 86; tacrolimus, 109). No between-group difference was noted in percentage of patients with 5 mL/min per 1.73 m2 or greater estimated glomerular filtration rate improvement (sirolimus, 34%; tacrolimus, 42%; P = 0.239) at month 24. Sirolimus patients had higher rates of biopsy-confirmed acute rejection (8% vs 2%; P = 0.02), treatment discontinuation attributed to adverse events (21% vs 3%; P < 0.001), and lower rates of squamous cell carcinoma of the skin (0% vs 5%; P = 0.012).
Conclusions
Our findings suggest that renal function improvement at 24 months is similar for patients with early conversion to sirolimus after kidney transplantation versus those remaining on tacrolimus.
Calcineurin inhibitors (CNIs), such as tacrolimus (TAC) and cyclosporine A (CsA), are a mainstay of immunosuppressive therapy in renal transplantation and have dramatically reduced risk of acute rejection and early allograft loss.1 However, prolonged exposure leads to progressive nephrotoxicity, characterized by decline in renal function and chronic allograft nephropathy, potentially shortening renal allograft survival.1-3 Calcineurin inhibitor–induced nephrotoxicity begins as early as 3 months posttransplantation and is associated with mild to moderate renal dysfunction.4,5 Concerns about nephrotoxicity3,4 and other CNI-associated adverse events (AEs), such as posttransplantation diabetes mellitus (PTDM),6-9 have prompted efforts to minimize or eliminate CNI use in kidney transplant recipients.
Withdrawal from CNI and transition to sirolimus (SRL) is one strategy to delay or prevent progressive renal allograft dysfunction.3 Sirolimus, an inhibitor of mammalian target of rapamycin (mTOR), has no effect on calcineurin activity.10 Relative to CNIs, SRL is less nephrotoxic. Its use for de novo immunosuppression without a CNI in renal transplantation is limited by lack of sufficient efficacy for preventing acute rejection and by early AEs, such as impaired wound healing and delayed graft function.11,12 In the maintenance setting, patients treated with SRL immunosuppressive regimens show greater incidence of acute rejection at 1 year posttransplantation versus patients treated with CNIs, but this difference is not seen at 2 years.13
The Sirolimus Renal Conversion Trial (CONVERT) was the first large randomized study to evaluate CNI-to-SRL conversion in maintenance therapy for renal allograft recipients.14 Overall, late conversion (6-120 months posttransplantation) had minimal impact on renal function 2 years postrandomization, although a post hoc analysis showed improved renal function in the subgroup of patients with baseline estimated glomerular filtration rates (eGFRs) greater than 40 mL/min and urine protein excretion within normal limits.14 These findings indicate that early conversion to SRL, before the allograft has sustained substantial CNI-induced nephrotoxicity and permanent injury, might conserve graft function.14 This premise is supported by findings from another study wherein patients switched from CsA to SRL 3 months posttransplantation had improved renal function versus patients maintained on CsA, with benefits maintained up to 4 years.5 However, in recent studies wherein TAC was the CNI and SRL was the mTOR inhibitor, early conversion was not associated with improved renal function.15,16
This open-label, randomized study was conducted to prospectively compare the effects of early transition from TAC to SRL versus continued TAC on renal function in renal allograft recipients. The broad time frame for conversion (90-150 days posttransplantation) provided flexibility, as some patients are not ready to switch at a specific time point.
MATERIALS AND METHODS
Study Design and Patients
This open-label, randomized, comparative phase 4 study was conducted at 39 centers in Europe, Latin America, North America, and the Pacific Region between June 2009 and July 2011. Patients were enrolled between 2 weeks before and 2 weeks after transplantation and were initiated on TAC + inosine monophosphate dehydrogenase (IMPDH) inhibitor (mycophenolate mofetil [MMF] or mycophenolate sodium [MPS]) ± corticosteroids within 30 days of transplantation. Between 90 and 150 days after renal transplantation, patients were randomized (1:1) to transition from TAC to SRL or continue TAC-based therapy for 19 to 21 months. The study was conducted in compliance with Good Clinical Practice guidelines in accordance with the Declaration of Helsinki, was approved by independent ethics committees at participating centers, and is registered at ClinicalTrials.gov (NCT00895583).
Eligible patients aged 18 years or older were receiving a primary renal allograft from a living or deceased donor. Patients were excluded if they had multiple organ transplants, active infection, human immunodeficiency virus, or history of malignancy within the previous 3 years (other than basal or squamous cell carcinoma), or were pregnant, breast-feeding, or willing to become pregnant. Before enrollment, patients provided written informed consent.
At 90 to 150 days posttransplantation, randomization was completed using computer-generated sequences. Select information, including investigator's site number, patient number, and patient’s date of birth, were entered by each site into the Clinical Operations Randomization Environment (CORE) II system, which provided a patient randomization number and treatment assignment. Enrolled patients with eGFR less than 40 mL/min per 1.73 m2 or spot urine protein to creatinine ratio (Up/c) 0.5 or greater within 2 weeks before randomization, Banff grade 2 or higher acute T cell–mediated or any acute antibody-mediated rejection any time posttransplantation, more than 1 episode of any acute rejection (biopsy-confirmed or presumed), or any acute rejection within 30 days before randomization could not be randomized. Patients were also excluded from randomization if they had significant laboratory abnormalities in hematologic or metabolic parameters (hematologic: total white blood cell count, <2000/mm3; absolute neutrophil count, <1000/mm3; or platelet count, <100 000/mm3; metabolic: fasting triglycerides, >400 mg/dL [>4.5 mmol/L] or fasting total cholesterol, >300 mg/dL [>7.8 mmol/L], regardless of whether or not they were on lipid-lowering therapy).
Treatment with TAC and an IMPDH inhibitor (MMF or MPS) was initiated within 30 days of transplantation and dosed per the center's standard of care. For management of AEs, temporary discontinuation of TAC and/or IMPDH inhibitor was permitted if they were both reinitiated at least 30 days prerandomization. Inosine-5′-monophosphate dehydrogenase inhibitor was maintained in both treatment groups postrandomization, dose adjustments were permitted. Therapeutic drug monitoring was not performed for IMPDH inhibitors. For patients continuing on TAC, there was no protocol-mandated range for TAC trough concentrations to allow the investigator to maintain patients according to their standard of care. For patients transitioning to SRL from TAC, SRL was initiated within 2 days postrandomization, and dosed per the center's standard of care. Tacrolimus was discontinued within 4 weeks of SRL initiation by an abrupt or a gradual method, per each center's documented standard of care. Target SRL trough levels were 7 to 15 ng/mL through 12 months posttransplantation and 5 to 15 ng/mL thereafter. Corticosteroids were permitted, but not required, to be administered as part of immunosuppression and were dosed per the center's standard of care. Withdrawal of corticosteroid therapy had to be completed at least 30 days before randomization; otherwise, stable treatment (minimum dose equivalent to prednisolone 2.5 mg/d) was maintained throughout the study. Antibody induction was also permitted per the center's standard of care. Although not required in all patients, antibody induction with rabbit antithymocyte globulin or alemtuzumab was required for patients with planned corticosteroid withdrawal. Discontinuation from either SRL or TAC after rejection was performed at the discretion of the investigator.
Assessments
The primary end point was percentage of patients with 5 mL/min per 1.73 m2 or greater improvement in eGFR from randomization to 24 months posttransplantation for the on-therapy population. The eGFR was calculated using the simplified Modification of Diet in Renal Disease formula.17
Secondary end points included percentage of patients with eGFR improvement at 12 months; change in eGFR at 6, 12, 18, and 24 months posttransplantation; percentage of patients with Up/c 0.5 or greater at 12 and 24 months; composite rate of first occurrence of biopsy-confirmed acute rejection (BCAR) (Banff 2007 criteria grades ≥1), graft loss, or death up to 24 months posttransplantation; and treatment-emergent AEs (TEAEs), including infection, malignancy, and PTDM. Posttransplantation diabetes mellitus was defined as any patient without preexisting diabetes who had any of the following after randomization: 30 days or longer of continual (defined <5-day gap between the same medication use) or at least 25 days of nonstop [no gaps] use of any diabetes treatment, fasting glucose ≥126 mg/dL, or nonfasting glucose ≥200 mg/dL. Preexisting diabetes was defined as known medical history of diabetes at transplantation, 30 days or longer of continual use of any diabetes treatment, fasting glucose ≥126 mg/dL, or nonfasting glucose ≥200 mg/dL. All patients underwent a single fasting glucose test in the 2 weeks before randomization.
Changes in glycemic parameters from baseline (randomization) were assessed through 24 months. Parameters included fasting glucose levels, hemoglobin A1c, fasting insulin concentration, homeostasis model assessment β-cell function, homeostasis model assessment insulin resistance, weight, body mass index, and waist circumference. Glycemic parameters were not assessed if the patient discontinued treatment.
Statistical Analyses
The on-therapy population comprised all randomized patients, who remained on assigned therapy until they discontinued from assigned therapy, and varied depending on the analysis time point used. For the primary end point analysis, the on-therapy population included all randomized patients who remained on study therapy through 24 months posttransplantation. Every effort was made to complete 24 months of follow-up posttransplantation in patients who discontinued from assigned treatment early (“off-therapy” patients). The intent-to-treat (ITT) population comprised all patients who took at least 1 dose of assigned therapy (TAC or SRL).
Efficacy end points were performed on the on-therapy and ITT populations; safety was assessed for the ITT population. Efficacy and safety outcomes were compared between groups using analysis of covariance, with treatment as a factor and baseline as a covariate, for continual variables, or Fisher exact test for categoric variables. For change of Up/c from baseline, log-transformation was applied before the analysis of covariance to obtain normally distributed data. Cumulative steroid dose from transplantation to 2 years posttransplantation was compared between groups using Wilcoxon rank-sum test. P values (2-sided) less than 0.05 were considered statistically significant. For the ITT analysis of GFR, data collected on-therapy or off-therapy were included. Missing GFR was imputed as follows: (1) GFR = 0 after graft loss and (2) last observed value prior to missing carried forward for death (with functioning graft), early termination, or skipped assessment.
Assuming the percentage of patients with ≥5 mL/min per 1.73 m2 improvement in eGFR 24 months posttransplantation was 45% in the SRL group and 25% in the TAC group, 256 patients had to be randomized (1:1) to achieve 80% power to detect the difference (2-sided, α = 0.05), with an estimated 30% dropout rate.
RESULTS
Of the 541 patients screened, 256 were randomized, 254 were evaluable for safety (ITT population), and 195 (SRL, n = 86; TAC, n = 109) were evaluable for the primary efficacy analysis (on-therapy population) (Figure 1). Forty-four (34%) patients discontinued from SRL treatment versus 12 (10%) patients who discontinued from TAC treatment (P < 0.001). The most common reasons for discontinuation from treatment were AEs (SRL group, 21%, TAC group, 3%; P < 0.001). No patients discontinued TAC treatment because of rejection. Of the 41 patients who discontinued from SRL treatment for reasons other than death, 28 (63.6%) were converted to TAC, and 3 (6.8%) remained on SRL after discontinuation (1 patient temporarily discontinued SRL for 20 days owing to prostate cancer and another discontinued SRL for 45 days owing to humoral rejection, a third patient did not discontinue SRL but was moved to off-therapy after not taking MMF/MPS per protocol). The remaining 10 patients discontinued SRL and had no further information available on immunosuppression. Three patients died while on-therapy.
FIGURE 1.
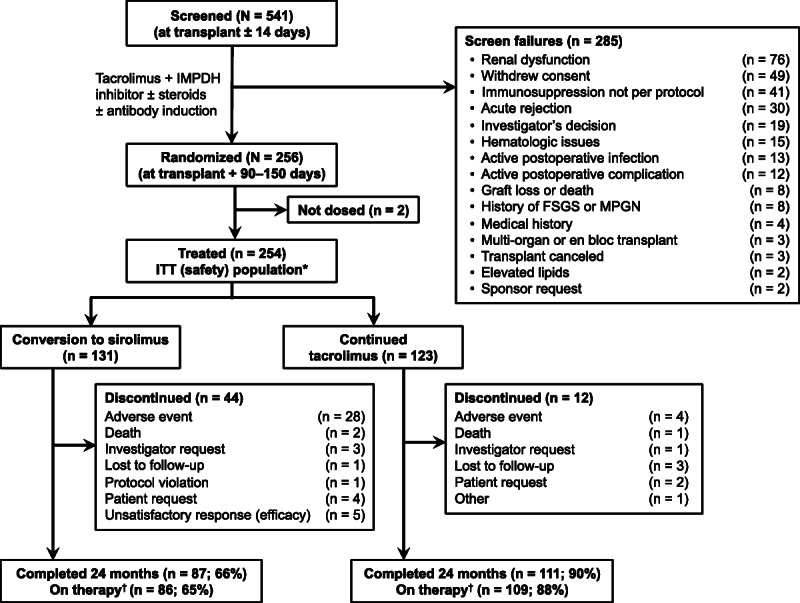
Disposition of the study population. *Received ≥1 dose of assigned therapy. †Remained on assigned therapy through 24 months after transplantation for the primary end point. d/c, discontinued; FSGS, focal segmental glomerulosclerosis; MPGN, membranoproliferative glomerulonephritis.
Baseline patient demographics and disease characteristics were generally similar between the SRL and TAC treatment groups (Table 1). The most common etiologies of end-stage renal disease were hypertension (21%), diabetes (21%), and polycystic kidney disease (18%). Donors were primarily white with a mean age of 44 years, and approximately half of all donors were deceased. The majority of patients (84%) received antibody induction, most commonly antibody-depleting agents (66%). Before randomization, the incidence of acute rejection was greater in the SRL group (8.4%) versus the TAC group (1.6%). Patients were randomized at a mean of 131.3 ± 16.9 days after transplantation in the SRL group and 128.3 ± 17.8 days in the TAC group.
TABLE 1.
Baseline demographics, donor information, and posttransplantation characteristics (ITT Population)
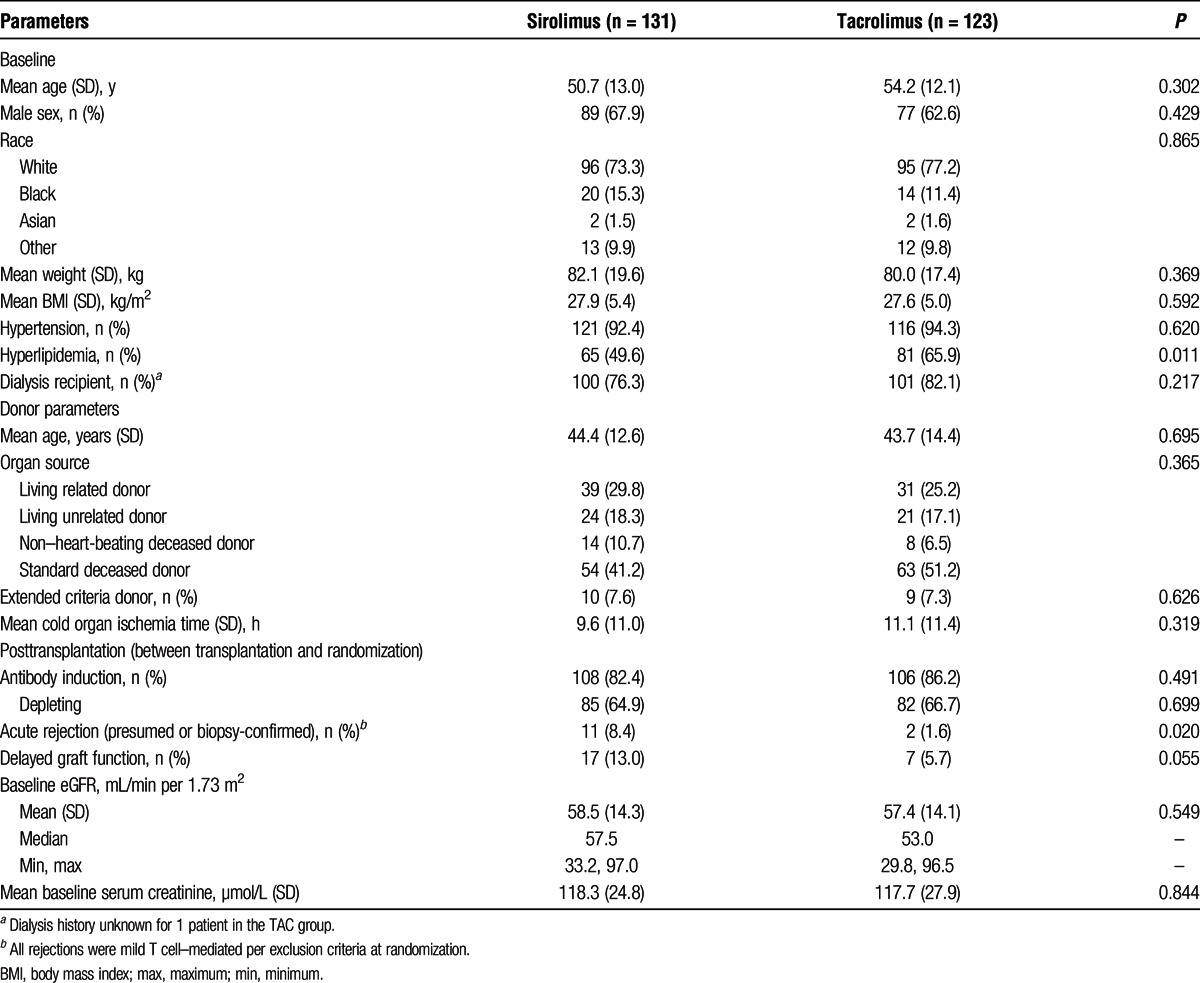
All patients received TAC almost immediately posttransplantation, and 98% were treated with corticosteroids before randomization (excluding treatment for rejection). At the time of randomization, 70% of patients treated with SRL and 67% treated with TAC continued receiving steroids as part of their maintenance immunosuppression. Median cumulative corticosteroid doses were significantly higher in the SRL group versus the TAC group during the study period (including screening) (5257.5 mg vs 4667.5 mg, respectively; P = 0.027). Mean SRL and TAC posttransplantation and postrandomization trough concentrations are summarized in Table 2.
TABLE 2.
Trough concentrations by study visit

Renal Function
The percentage of patients with ≥5 mL/min per 1.73 m2 improvement in eGFR from randomization to 24 months posttransplantation (on-therapy analysis) was not statistically different between the 2 treatment groups (SRL, 33.7% vs TAC, 42.2%; odds ratio [OR], 0.7; 95% confidence interval [95% CI], 0.4-1.3; P = 0.239) (Figure 2). The percentage of patients with 5 mL/min per 1.73 m2 or greater improvement in eGFR also was not statistically different between the 2 treatment groups at 12 months. Results from the ITT analysis were similar to those from the on-therapy analysis at 12 months (SRL, 38.2% vs TAC, 42.3%; OR, 0.8; 95% CI, 0.5-1.4; P = 0.524) and 24 months (SRL, 33.6% vs TAC, 40.7%; OR, 0.7; 95% CI, 0.4-1.2; P = 0.298). Prespecified subgroup analyses (not shown) did not reveal between-treatment statistical differences in the primary end point for any patient subset, including donor characteristics, depleting antibody and steroid use. Renal function data at 24 months were available for 23 patients who discontinued SRL and were converted back to a CNI. Of those patients, 5 (21.7%) had 5 mL/min per 1.73 m2 or greater improvement in GFR at 24 months off-therapy. The 18 remaining patients at 24 months off-therapy had GFRs that ranged from 11.6 to 69.5 mL/min per 1.73 m2. Renal function data at 24 months off-therapy were available for 7 of 12 patients who discontinued TAC; GFRs for these 7 patients ranged from 17.0 to 83.0 mL/min per 1.73 m2.
FIGURE 2.
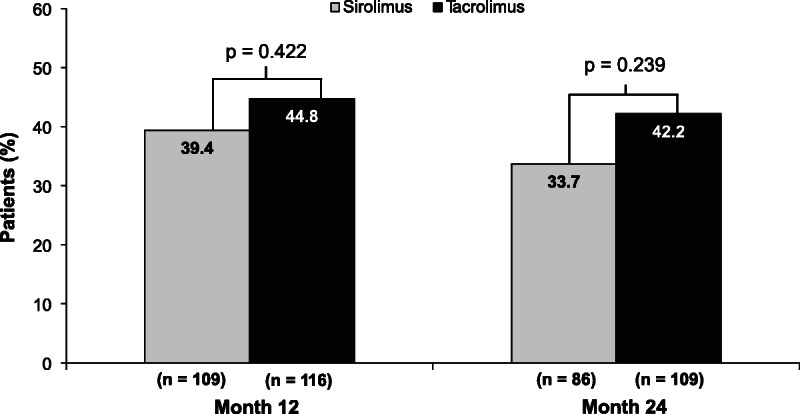
Percentage of patients with at least a 5-mL/min per 1.73 m2 improvement in renal function at 12 and 24 months after transplantation (on-therapy population).
For the on-therapy population, there was no difference between treatment groups in mean (SE) eGFR increase from baseline (randomization) to 24 months posttransplantation (SRL, 1.2 ± 1.6 mL/min per 1.73 m2 vs TAC, 0.6 ± 1.3 mL/min per 1.73 m2; least squares mean difference [SE], 0.7 [1.9]; 95% CI, −3.0 to 4.4; P = 0.710) (Figure 3). Similar results were observed for the ITT analysis (SRL, 0.7 ± 1.4 mL/min per 1.73 m2 vs TAC, 0.9 ± 1.3 mL/min per 1.73 m2; least squares mean difference [SE], 0.0 [1.9]; 95% CI; −3.7 to 3.8; P = 0.989).
FIGURE 3.
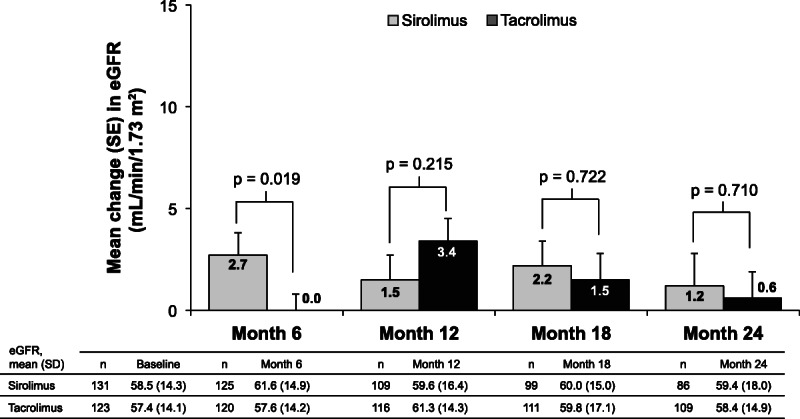
Change from baseline in eGFR by abbreviated MDRD (on-therapy population). Change from baseline was summarized based on patients with valid values available for both baseline and the study visit. MDRD, Modification of Diet in Renal Disease.
The percentage of patients with Up/c of 0.5 or greater was significantly greater in the SRL group at 12 months (SRL, 19.6% vs TAC, 9.3%; P = 0.035) and was numerically higher at 24 months (SRL, 22.5% vs TAC, 14.2%; P = 0.151). Geometric mean fold change in Up/c from baseline was significantly greater in the SRL group at 12 months (SRL, 1.7 vs TAC, 1.0; treatment ratio, 1.7; 95% CI, 1.4-2.1; P < 0.001) and at 24 months (SRL, 2.1 vs TAC, 1.1; treatment ratio, 1.8; 95% CI, 1.4-2.3; P < 0.001). Additionally, during the on-therapy period, significantly more patients were receiving angiotensin-converting enzyme inhibitors or angiotensin II receptor blockers in the SRL group than in the TAC group (43.5% vs 29.3%, respectively; P = 0.020).
BCAR, Patient Survival, and Graft Loss
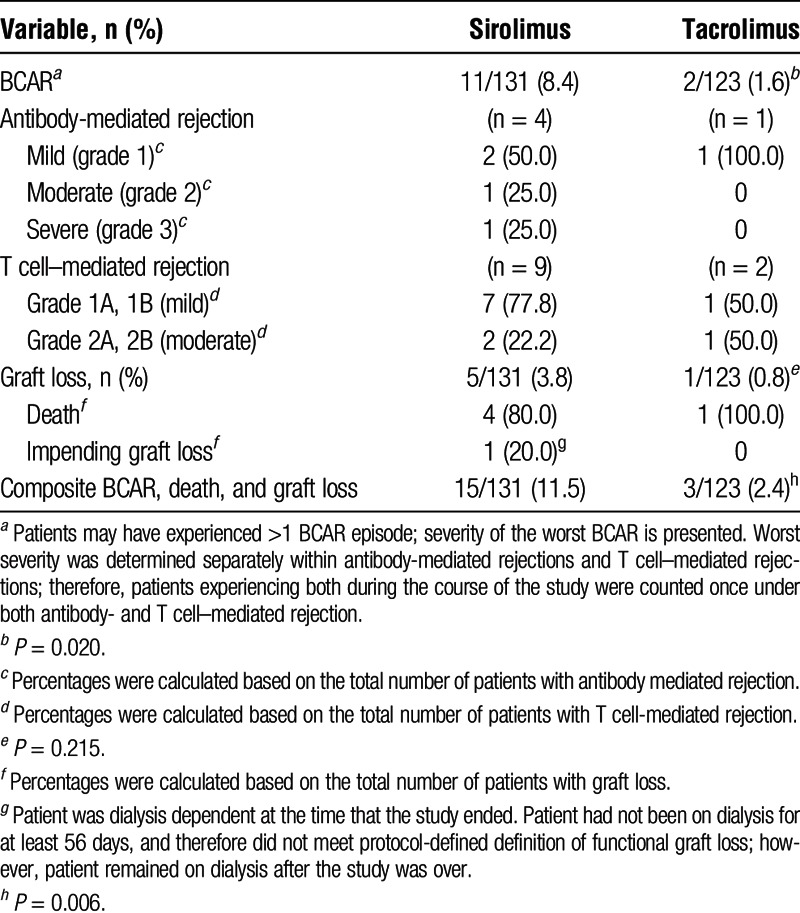
Sirolimus was associated with a greater composite rate of BCAR, graft loss, and death than TAC (15 vs 3 patients, respectively; P = 0.006) (Table 3). This difference was driven largely by the number of rejections, as BCAR occurred in significantly more patients treated with SRL versus TAC (P = 0.02). For 11 patients transitioned to SRL who had BCAR, 7 (64%) experienced their episode within the first 12 months after transplantation and 2 (18%) were off steroids at randomization as part of the immunosuppression regimen. Among those maintained on steroids, the incidence of BCAR was 9.8% (9/92). Biopsy-confirmed acute rejections were predominantly mild T cell–mediated rejections. Some patients experienced more than 1 BCAR episode. One of 17 patients in the SRL group, and no patients in the TAC group with prerandomization delayed graft function developed BCAR after randomization. None of the patients with prerandomization acute rejection in either the SRL (n = 11) or TAC (n = 2) group developed BCAR postrandomization. Four patients treated with SRL died due to metastatic squamous cell carcinoma, sudden cardiac death (off-therapy), metastatic uterine cancer, and unknown cause. One patient treated with TAC died due to metastatic squamous cell carcinoma. The fatal cases of squamous cell carcinoma in both groups were not skin cancers (primary cancer site unknown). No patient in either group experienced graft loss (excluding death); however, 1 patient treated with SRL had impending graft loss at 24 months (ie, patient was on dialysis for 25 days and continuing at the time the study ended).
TABLE 3.
Biopsy-confirmed acute rejection, death, and graft loss at 24 mo (ITT population)
Safety
Treatment-Emergent Adverse Events
Commonly reported TEAEs are summarized in Table 4. Treatment-emergent adverse events that occurred significantly more frequently with SRL than with TAC were acne, dyslipidemia and hyperlipidemia, mouth ulceration, peripheral edema, and proteinuria. More TAC-treated patients experienced squamous cell carcinoma of the skin compared with SRL-treated patients (6 vs 0; P = 0.012). However, the number of patients with any malignancy was not different between the groups (TAC, 9 vs SRL, 4; P = 0.158). A post hoc analysis of patients with TEAEs of either dyslipidemia or hyperlipidemia revealed that 29 SRL versus 6 TAC patients experienced 1 or both of these events. Of those, 25 SRL patients and all 6 TAC patients received concomitant lipid-lowering therapy; however, 11 SRL and 4 TAC patients were receiving lipid-lowering therapy before the onset of the event.
TABLE 4.
Treatment-emergent adverse events in at least 10% of patients in either group (safety population)

Significantly more SRL versus TAC patients discontinued treatment because of a TEAE (35 vs 5; P < 0.001). The most common TEAEs leading to discontinuation were rejection or suspected rejection (SRL, 10 vs TAC, 0 patients; P = 0.002), neutropenia (SRL, 2 vs TAC, 0), pyrexia (SRL, 2 vs TAC, 0), and BK virus infection (SRL, 0 vs TAC, 2).
Posttransplantation Diabetes Mellitus
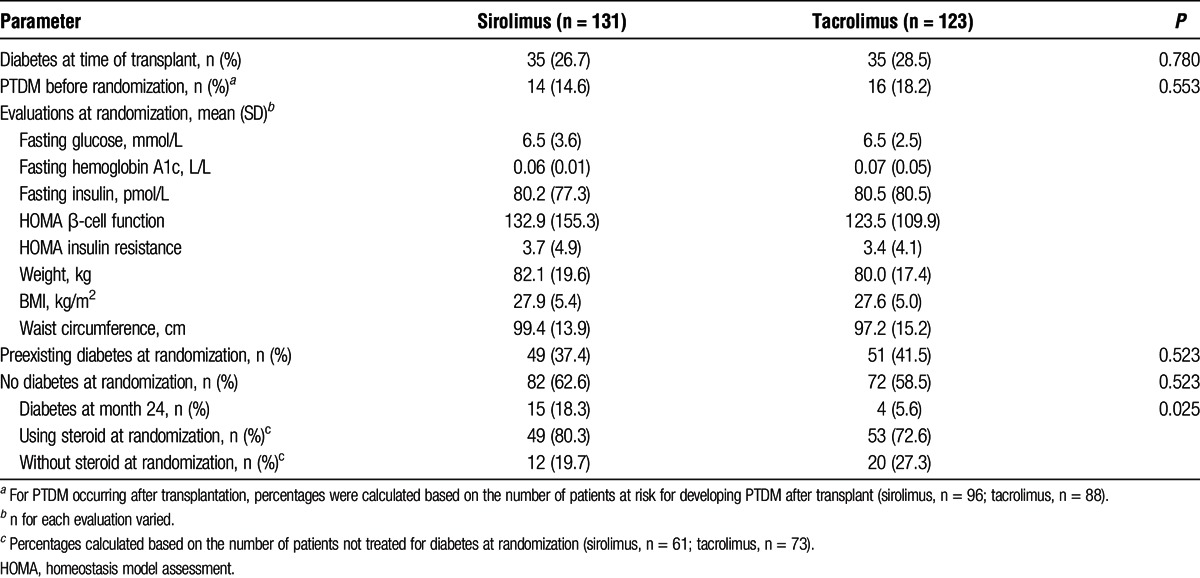
Baseline diabetes, steroid use, and insulin resistance parameters are shown in Table 5. In total, 100 patients (39%) had preexisting diabetes at randomization; 70 (28%) had diabetes at the time of transplant and 30 of the remaining patients (16%) developed PTDM after transplantation but before randomization while receiving TAC. Of the patients who had no medical history of diabetes, 29 of 96 (30%) in the SRL group and 20 of 88 (23%) in the TAC group developed PTDM during the study (before or after randomization). In the on-therapy group, 61 (71%) patients in the SRL group and 73 (67%) in the TAC group were not receiving treatment for diabetes at randomization (regardless of study definition of PTDM or diagnosis at transplantation). Of those not receiving treatment for diabetes at randomization, 3 (4.9%) patients in the SRL group and 3 (4.1%) in the TAC group were receiving treatment at 24 months. Steroid use in these 6 patients was then evaluated and 4 were receiving steroids as part of their ongoing immunosuppressive regimen (2 in each group).
TABLE 5.
Glycemia-related characteristics at baseline: diabetes, steroid use, and insulin resistance parameters (ITT population)
At 24 months postrandomization, PTDM, as defined in the protocol, was reported in 15 (18.3%) SRL patients and 4 (5.6%) TAC patients, respectively (P = 0.03; Figure 4). Of the SRL patients, 13 had elevated laboratory values only (no treatment), 1 had elevated laboratory values and received treatment, and 1 had no elevated laboratory values but received treatment. The latter patient began treatment shortly before randomization but did not meet the length of treatment duration required to be considered to have preexisting diabetes. Of the 4 TAC patients with PTDM, 3 had elevated laboratory values only (no treatment) and 1 had no elevated laboratory values but received treatment, which began postrandomization.
FIGURE 4.
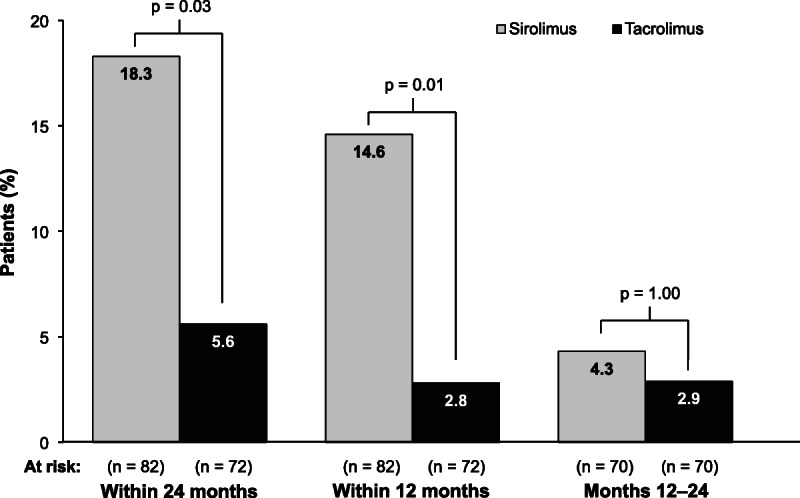
Incidence of posttransplantation diabetes mellitus over 24 months after randomization. The at-risk population for posttransplantation diabetes mellitus included only those patients who were not already categorized as having diabetes at or before randomization, per protocol definition.
No between-group difference was seen in adjusted mean change in glycemic parameters from baseline (randomization) to 24 months. Overall, 11 patients (4%) (SRL, n = 8 [6%]; TAC, n = 3 [2%]) experienced a TEAE of hyperglycemia or PTDM; none led to discontinuation from the study.
DISCUSSION
In this study, transition from TAC- to SRL-based immunosuppression 3 to 5 months after kidney transplantation was no different from TAC-based immunosuppression regarding improved renal function at 24 months. In the SRL group, the greatest mean increase in eGFR from baseline was seen at 6 months postrandomization, and the difference versus the TAC group at this time point was significant (2.7 vs 0 mL/min per 1.73 m2; P = 0.019). Thereafter, the between-group difference diminished.
The study design was based on historical values for CNI-to-SRL conversion in patients with baseline eGFR greater than 40 mL/min and assumed that, at 24 months, 45% of SRL-treated patients and 25% treated with TAC would have eGFR improvement of 5 mL/min per 1.73 m2 or greater from baseline, considered the lowest interval for clinically significant improvement.14 However, the primary end point was achieved by a lower percentage of patients than expected in the SRL group (34%) and by a much higher percentage than expected in the TAC group (42%). The reason that fewer than expected SRL-treated patients experienced a sustained improvement in eGFR at 24 months is unknown; however, it is possible that this was influenced by the disproportionate number of SRL patients who experienced rejection during the screening period. Additionally, it is unclear why so many patients who continued on TAC experienced improvement in renal function through 24 months after transplantation. One possibility is that, by excluding patients with eGFR less than 40 mL/min from randomization at 3 to 5 months posttransplantation, the study population was enriched for patients with a lower risk of developing clinically significant CNI-induced nephrotoxicity during the 24-month follow-up.
From randomization through 24 months posttransplantation, 11 patients (8.4%) in the SRL group and 2 (1.6%) in the TAC group (P = 0.020) experienced BCAR. Most rejections in the SRL group occurred within the first 12 months posttransplantation. This is not unexpected given that the risk of rejection in these patients may be higher due to the conversion from one immunosuppressive medication to another. The rate of graft loss, including death, was not significantly different between the groups. Increased incidence of rejection has been observed in other studies of mTOR inhibitors with similar designs.16,18
Several study limitations deserve mention, including the open-label design. Patients converted to SRL had more study visits during the first month postrandomization, which may have contributed to the increased incidence of AEs reported in this group. Further, a lack of prospective collection of information on risk factors present in this study complicates interpretation of the results. Clinical risk factors for CNI nephrotoxicity include older kidney age, use of nonsteroidal anti-inflammatory drugs, and genetic polymorphisms in CYP3A5 and other genes.3 Another major limitation of the study is the lack of histologic analysis; biopsies were not required by protocol before conversion or at 24 months and were instead performed at the investigator's discretion. Thus, it is possible that the occurrence of BCAR at 24 months was underestimated in our study, or that patients who experienced postrandomization BCAR may have had subclinical rejection prior to conversion. The presence of donor-specific antibodies may also have influenced renal function outcomes.19-21 However, development of donor-specific antibodies was not assessed as this laboratory test was not commonly performed at all centers at the time of this study; thus, their impact on risk of rejection in this study remains unknown. Lastly, caution should be taken in extrapolating these results to other populations, especially those at higher immunologic risk.
Despite these limitations, the findings are in agreement with results from other early conversion studies involving TAC-to-SRL transition. In the Spare-the-Nephron trial, TAC was the CNI used in 80% of patients, and the mean time from transplant to randomization was 113 days.15 After 12 months, the mean change from baseline in measured GFR was greater in patients who switched to SRL, but the change was not different at 24 months. Another recent study examined changes in renal function when patients were switched from TAC to SRL 3 months after renal transplantation.16 These patients were not allowed to undergo conversion to SRL if they had eGFR less than 40 mL, protein-to-creatinine ratio of 0.5 or greater, previous acute rejection Banff IIA or higher or acute rejection within the last 4 weeks, or any wound healing event. At 24 months, no differences were seen in renal function (ie, percent change in eGFR from baseline) or in the severity of chronic sclerosing lesions scores in biopsies. Collectively, these findings differ from the significant improvements in renal function seen in studies of early conversion from CsA to an mTOR inhibitor compared with continued CsA.5,18 Because TAC is associated with better renal function than CsA,11 differences in eGFR after conversion may be less evident.
The pattern of TEAEs reported by patients who transitioned to SRL was consistent with the known safety profile of SRL, including dyslipidemia and proteinuria.6,22 Discontinuation from assigned therapy because of AEs was significantly greater in the SRL group (21 %) compared with the TAC group (3%; P < 0.001), and rejection or suspected rejection was the most common TEAE leading to discontinuation in the SRL treatment arm. As seen in other studies, conversion to SRL was associated with fewer cases of squamous cell carcinoma of the skin compared with TAC continuation.23,24 An unexpected safety finding was the number of patients who developed PTDM after transitioning to SRL. However, most patients with PTDM, as defined in this study, did not require treatment with antidiabetes agents. The definition did not consider hemoglobin A1c, a more accurate test in diagnosing diabetes, nor the patients who were prediabetic before randomization. Because the highest incidence was close to randomization, the results are likely to have been different if the definition was instead based on “need for anti-diabetes treatment.” Although PTDM is a well-known adverse effect of CNIs in kidney transplant recipients,6-9 the mechanism for the development of PTDM that may occur with the transition from TAC to SRL is unknown. It is possible that undergoing a major change in immunosuppressive therapy may affect glucose metabolism or that the greater cumulative dose of corticosteroids in the SRL group versus the TAC group (5257.5 mg vs 4667.5 mg, respectively) may have contributed to the increased incidence of PTDM.
Although a therapeutic strategy of early conversion from TAC to SRL maintenance did not improve renal function, there may be some patients who do receive benefit; the challenge is in identifying these patients. Although not proven in this study, others have shown that early conversion to SRL-based immunosuppression may be an appropriate CNI-free strategy for patients with a low immunologic risk, after careful screening at the time of conversion.25-27 Our findings suggest that measurement of eGFR around 3 months after transplantation is not sufficient to assess risk even in this low-risk population. More stringent strategies, such as biopsies to assess the rate of prior subclinical acute rejections or the presence of anti-HLA donor-specific antibodies, might better assess the risk of nephropathy. The long-term incidence of squamous cell carcinoma of the skin is significantly greater with TAC, which is an important consideration for some patients.
In conclusion, renal function improvement at 24 months was similar when comparing patients after a planned TAC to SRL transition 3 to 5 months after kidney transplantation with those remaining on TAC. Sirolimus was associated with higher rates of TEAEs, discontinuations attributable to TEAEs, PTDM, and BCAR. Tacrolimus was associated with a higher rate of squamous cell carcinoma of the skin.
ACKNOWLEDGMENTS
The following lead investigators also participated in this study:
Roberto Gedaly, Lexington, KY; Didier Mandelbrot, Boston, MA; Maria Del Carmen Rial, Buenos Aires, Argentina; Wai Lim, Nedlands, Australia; Bruce Pussell, Sydney, Australia; Beje Thomas, Charleston, SC; Alexander Wiseman Jr, Denver, CO; Mohamed El-Ghoroury, Detroit, MI; George Francos, Philadelphia, PA; Joshua Wolf, Atlanta, GA; Joshua Augustine, Cleveland, OH; Debra Sudan, Durham, NC; Mabel Bodel, Rochester, NY; Qing Ren, Richmond, VA; John Vella, Portland, ME; David Cohen, New York, NY; Kenneth Brayman, Charlottesville, VA; Lorenzo Gallon, Chicago, IL; Edwin Fuller, Chapel Hill, NC; Christopher Marsh, La Jolla, CA; Douglas Norman, Portland, OR; Vanji Karthikeyan, Detroit, MI; Gautham Mogilishetty, Cincinnati, OH; Richard Knight, Houston, TX; Jose Maria Campistol Plana, Barcelona, Spain; Jose Maria Grinyo Boira, Barcelona, Spain; Jose Maria Morales Cerdan, Madrid, Spain; Valter Duro Garcia, Porto Alegre, Brazil; Irene de Lourdes Noronha, Sao Paulo, Brazil; Giacomo Colussi, Milano, Italy; Antonio Secchi, Milano, Italy; Jaime Sanchez Plumed, Valencia, Spain; Juan Carlos Ruiz San Millan, Santander, Spain; Klemens Budde, Berlin, Germany.
Footnotes
Published online 3 March 2016.
M.A.T. is currently affiliated to CSL Behring Biotherapies for Life, Clinical Pharmacology and Pharmacometrics, King of Prussia, PA.
This study was sponsored by Pfizer. Medical writing and editorial support were provided by Bina J. Patel, PharmD, CMPP, and Christine H. Blood, PhD, of Peloton Advantage, Parsippany, NJ, and were funded by Pfizer.
C.M.H. and A.F. designed the study. H.T.S., G.R.R., V.R.P., A.S.F., B.A.M., and F.D. collected the data. C.M.H., H.L., and M.A.T. performed statistical analyses. S.L.S., C.M.H., A.F., H.L., and M.A.T. held the data. All authors interpreted the data and collaborated in the preparation and critical review of the article, supported by a professional medical writer provided by Pfizer. All authors had access to the data, approved the article for submission, and assume responsibility for the completeness and accuracy of the data and data analyses.
H.T.-S. has served as a remunerated consultant for Novartis and Pfizer and has received travel grants from Novartis; his institution has received research grants from Astellas, Bristol-Myers Squibb, Novartis, Pfizer, Roche, and Veloxis. V. R. Peddi has served as a consultant and speaker for Novartis and Astellas, and his institution has received research grants from Astellas, Bristol-Myers Squibb, Novartis, Pfizer, Roche, Quark, and Veloxis. A.S.-F. has received grant/research support from Novartis and is a speaker for Novartis and Pfizer. B.A.M. has no financial conflicts to disclose. G.R.R. has received honoraria from Astellas, Novartis, and Pfizer. F.D. has received grant/research support from Novartis and is a speaker for Novartis and Pfizer. A.F., C.M.H., H.L., and S.L.S. are employees of Pfizer. M.A.T. was an employee of Pfizer at the time of this study.
ClinicalTrials.gov identifier: NCT00895583.
Data from this study were presented in part at the World Transplantation Congress, July 26–31, 2014, San Francisco, CA.
REFERENCES
- 1. Nankivell BJ, Borrows RJ, Fung CL, et al. The natural history of chronic allograft nephropathy. N Engl J Med. 2003; 349: 2326– 2333. [DOI] [PubMed] [Google Scholar]
- 2. Hariharan S, McBride MA, Cherikh WS, et al. Post-transplant renal function in the first year predicts long-term kidney transplant survival. Kidney Int. 2002; 62: 311– 318. [DOI] [PubMed] [Google Scholar]
- 3. Naesens M, Kuypers DR, Sarwal M. Calcineurin inhibitor nephrotoxicity. Clin J Am Soc Nephrol. 2009; 4: 481– 508. [DOI] [PubMed] [Google Scholar]
- 4. Nankivell BJ, Borrows RJ, Fung CL, et al. Calcineurin inhibitor nephrotoxicity: longitudinal assessment by protocol histology. Transplantation. 2004; 78: 557– 565. [DOI] [PubMed] [Google Scholar]
- 5. Lebranchu Y, Thierry A, Thervet E, et al. Efficacy and safety of early cyclosporine conversion to sirolimus with continued MMF—four-year results of the postconcept study. Am J Transplant. 2011; 11: 1665– 1675. [DOI] [PubMed] [Google Scholar]
- 6. Almeida CC, Silveira MR, de Araujo VE, et al. Safety of immunosuppressive drugs used as maintenance therapy in kidney transplantation: a systematic review and meta-analysis. Pharmaceuticals (Basel). 2013; 6: 1170– 1194. [DOI] [PMC free article] [PubMed] [Google Scholar]
- 7. Jindal RM, Hjelmesaeth J. Impact and management of posttransplant diabetes mellitus. Transplantation. 2000; 70: SS58– SS63. [PubMed] [Google Scholar]
- 8. Veroux M, Tallarita T, Corona D, et al. Conversion to sirolimus therapy in kidney transplant recipients with new onset diabetes mellitus after transplantation. Clin Dev Immunol. 2013; 2013: 496974. [DOI] [PMC free article] [PubMed] [Google Scholar]
- 9. Kesiraju S, Paritala P, Rao Ch UM, Sahariah S. New onset of diabetes after transplantation—an overview of epidemiology, mechanism of development and diagnosis. Transpl Immunol. 2014; 30: 52– 58. [DOI] [PubMed] [Google Scholar]
- 10. Rapamune [package insert]. Philadelphia, PA: Wyeth Pharmaceuticals Inc; 2012. [Google Scholar]
- 11. Ekberg H, Tedesco-Silva H, Demirbas A, et al. Reduced exposure to calcineurin inhibitors in renal transplantation. N Engl J Med. 2007; 357: 2562– 2575. [DOI] [PubMed] [Google Scholar]
- 12. Flechner SM, Glyda M, Cockfield S, et al. The ORION study: comparison of two sirolimus-based regimens versus tacrolimus and mycophenolate mofetil in renal allograft recipients. Am J Transplant. 2011; 11: 1633– 1644. [DOI] [PubMed] [Google Scholar]
- 13. Yan HL, Zong HT, Cui YS, et al. Calcineurin inhibitor avoidance and withdrawal for kidney transplantation: a systematic review and meta-analysis of randomized controlled trials. Transplant Proc. 2014; 46: 1302– 1313. [DOI] [PubMed] [Google Scholar]
- 14. Schena FP, Pascoe MD, Alberu J, et al. Conversion from calcineurin inhibitors to sirolimus maintenance therapy in renal allograft recipients: 24-month efficacy and safety results from the CONVERT trial. Transplantation. 2009; 87: 233– 242. [DOI] [PubMed] [Google Scholar]
- 15. Weir MR, Mulgaonkar S, Chan L, et al. Mycophenolate mofetil-based immunosuppression with sirolimus in renal transplantation: a randomized, controlled Spare-the-Nephron trial. Kidney Int. 2011; 79: 897– 907. [DOI] [PubMed] [Google Scholar]
- 16. Silva HT, Jr, Felipe CR, Garcia VD, et al. Planned randomized conversion from tacrolimus to sirolimus-based immunosuppressive regimen in de novo kidney transplant recipients. Am J Transplant. 2013; 13: 3155– 3163. [DOI] [PubMed] [Google Scholar]
- 17. Levey AS, Coresh J, Greene T, et al. Using standardized serum creatinine values in the modification of diet in renal disease study equation for estimating glomerular filtration rate. Ann Intern Med. 2006; 145: 247– 254. [DOI] [PubMed] [Google Scholar]
- 18. Budde K, Becker T, Arns W, et al. Everolimus-based, calcineurin-inhibitor-free regimen in recipients of de-novo kidney transplants: an open-label, randomised, controlled trial. Lancet. 2011; 377: 837– 847. [DOI] [PubMed] [Google Scholar]
- 19. Croze LE, Tetaz R, Roustit M, et al. Conversion to mammalian target of rapamycin inhibitors increases risk of de novo donor-specific antibodies. Transpl Int. 2014; 27: 775– 783. [DOI] [PubMed] [Google Scholar]
- 20. Gallon L, Traitanon O, Sustento-Reodica N, et al. Cellular and molecular immune profiles in renal transplant recipients after conversion from tacrolimus to sirolimus. Kidney Int. 2015; 87: 828– 838. [DOI] [PMC free article] [PubMed] [Google Scholar]
- 21. Ruiz San Millan JC, Lopez-Hoyos M, Segundo DS, et al. Predictive factors of allosensitization in renal transplant patients switched from calcineurin to mTOR inhibitors. Transpl Int. 2014: 847– 856. [DOI] [PubMed] [Google Scholar]
- 22. Letavernier E, Pe'raldi MN, Pariente A, et al. Proteinuria following a switch from calcineurin inhibitors to sirolimus. Transplantation. 2005; 80: 1198– 1203. [DOI] [PubMed] [Google Scholar]
- 23. Salgo R, Gossmann J, Schofer H, et al. Switch to a sirolimus-based immunosuppression in long-term renal transplant recipients: reduced rate of (pre-)malignancies and nonmelanoma skin cancer in a prospective, randomized, assessor-blinded, controlled clinical trial. Am J Transplant. 2010; 10: 1385– 1393. [DOI] [PubMed] [Google Scholar]
- 24. Euvrard S, Morelon E, Rostaing L, et al. Sirolimus and secondary skin-cancer prevention in kidney transplantation. N Engl J Med. 2012; 367: 329– 339. [DOI] [PubMed] [Google Scholar]
- 25. Hamdy AF, Bakr MA, Ghoneim MA. Long-term efficacy and safety of a calcineurin inhibitor-free regimen in live-donor renal transplant recipients. J Am Soc Nephrol. 2008; 19: 1225– 1232. [DOI] [PMC free article] [PubMed] [Google Scholar]
- 26. Sahin S, Gurkan A, Uyar M, et al. Conversion to proliferation signal inhibitors-based immunosuppressive regimen in kidney transplantation: to whom and when? Transplant Proc. 2011; 43: 837– 840. [DOI] [PubMed] [Google Scholar]
- 27. Gatault P, Lebranchu Y. Conversion to mTOR-inhibitor-based immunosuppression: which patients and when? Transplant Res. 2013; 2: S3. [DOI] [PMC free article] [PubMed] [Google Scholar]


