Abstract
Background
The goal of this study was to characterize urinary metabolomics for the noninvasive detection of cellular inflammation and to determine if adding urinary chemokine ligand 10 (CXCL10) improves the overall diagnostic discrimination.
Methods
Urines (n = 137) were obtained before biopsy in 113 patients with no (n = 66), mild (borderline or subclinical; n = 58), or severe (clinical; n = 13) rejection from a prospective cohort of adult renal transplant patients (n = 113). Targeted, quantitative metabolomics was performed with direct flow injection tandem mass spectrometry using multiple reaction monitoring (ABI 4000 Q-Trap). Urine CXCL10 was measured by enzyme-linked immunosorbent assay. A projection on latent structures discriminant analysis was performed and validated using leave-one-out cross-validation, and an optimal 2-component model developed. Chemokine ligand 10 area under the curve (AUC) was determined and net reclassification index and integrated discrimination index analyses were performed.
Results
PLS2 demonstrated that urinary metabolites moderately discriminated the 3 groups (Cohen κ, 0.601; 95% confidence interval [95% CI], 0.46-0.74; P < 0.001). Using binary classifiers, urinary metabolites and CXCL10 demonstrated an AUC of 0.81 (95% CI, 0.74-0.88) and 0.76 (95% CI, 0.68-0.84), respectively, and a combined AUC of 0.84 (95% CI, 0.78-0.91) for detecting alloimmune inflammation that was improved by net reclassification index and integrated discrimination index analyses. Urinary CXCL10 was the best univariate discriminator, followed by acylcarnitines and hexose.
Conclusions
Urinary metabolomics can noninvasively discriminate noninflamed renal allografts from those with subclinical and clinical inflammation, and the addition of urine CXCL10 had a modest but significant effect on overall diagnostic performance. These data suggest that urinary metabolomics and CXCL10 may be useful for noninvasive monitoring of alloimmune inflammation in renal transplant patients.
A recent study of over 1300 transplant recipients found that even with modern immunosuppression, rejection accounts for up to one third of renal allograft losses.1 Allograft rejection may be mediated by T cells (T cell–mediated rejection [TCMR]) or antibody mediated rejection (AMR), both of which can occur subclinically—that is, in the absence of graft dysfunction. Moreover, subclinical TCMR is found in up to 30% of patients that undergo surveillance biopsies2-4 and is associated with the development of interstitial fibrosis and tubular atrophy (IFTA),5,6 de novo donor-specific antibodies,7,8 and AMR, all of which are associated with graft loss. The inability of serum creatinine to detect subclinical TCMR combined with the limitations of surveillance biopsies (morbidity, sampling error, and cost) argue for the development of noninvasive tests for renal allograft monitoring to guide the titration of immunosuppression.
Renal allograft inflammation has been shown to downregulate tubular epithelial proteins involved in solute and water transport in both rodent and human models,9-11 which may alter the urinary metabolome. To this end, several groups have evaluated urinary metabolomics as a potential noninvasive marker of renal allograft inflammation using different approaches.12-15 Similarly, urinary chemokines have been evaluated as noninvasive markers for rejection. Urine chemokine ligand 10 (CXCL10) has been found to be a promising rejection marker16-30 that rises before serum creatinine,16,17 decreases after treatment of rejection,16-20 and is sufficiently sensitive to detect both borderline and subclinical tubulitis.21-24
Taken together, urine CXCL10 has been shown to outperform standard of care monitoring—however, urine CXCL10 only detects subclinical tubulitis with an area under the curve (AUC) of 0.69.21 Therefore, the goal was to characterize urinary metabolomics for the noninvasive detection of rejection and determine if metabolomics can be added to urine CXCL10 to improve its overall diagnostic performance.
METHODS
Patients and Biopsies
This study was approved by the ethics committee of the University of Manitoba and all participating patients gave written informed consent. This is a retrospective analysis of a prospective, observational selected cohort of adult renal transplant patients consisting of 137 renal transplant biopsies with paired urine samples obtained in 113 patients with surveillance or clinically indicated biopsies. Most biopsies (n = 122) were surveillance biopsies obtained at 3, 6, and 12 months posttransplant in patients with stable graft function. The remaining biopsies (n = 15) were performed for graft dysfunction, defined as a 20% or greater rise in serum creatinine from baseline or proteinuria. Two biopsy cores were obtained using an 18-gauge needle under ultrasound guidance. Biopsies were reported using the Banff schema, applying the most up-to-date criteria at time of reporting, and the pathologist was blinded to the metabolomics results.31
Thirty-five patients received induction therapy at the time of transplant; 31 patients received anti-CD25 antibody, and 4 patients received thymoglobulin. Maintenance immunosuppression consisted of cyclosporine/mycophenolate mofetil/prednisone in 39 patients, and tacrolimus/mycophenolate mofetil/prednisone in 74 patients. Acute rejection was treated with pulse steroids.
There were 3 clinical-pathological groups according to their degree of inflammation:
-
No inflammation (n = 66)
Normal histology (n = 33): i0 t0-1g0 v0 ci0-1 ct0-1 cg0 cv0-1
IFTA (n = 33): i0-1t0-1g0 v0 ci ≥ 1 ct ≥ 1 cg0 cv0-1
-
Mild inflammation (n = 58)
Borderline changes (n = 18): i1-2t1g0 v0 ci0-1 ct0-1 cg0 cv0-1
IFTA with inflammation (n = 10): i1-2t1g0 v0 ci ≥ 1 ct ≥ 1 cg0 cv0-1
Subclinical TCMR (n = 30): i ≥ 2t ≥ 2 ci0-1 ct0-1 cv0-1
-
Severe inflammation (n = 13)
Clinical TCMR (n = 13): i ≥ 2t ≥ 2 ci0-1 ct0-1 cv0-1
Other inflammatory states, such as urinary tract infection, cytomegalovirus, and polyomavirus, were excluded from all groups.
A subsequent analysis to evaluate the potential confounding influence of acute tubular necrosis (ATN) was performed in patients with indication of biopsy-proven ATN and serum creatinine of 20% or greater from baseline (n = 14).
Urine Collection
Midstream urine samples were obtained immediately before surveillance or clinically indicated biopsies were performed and were frozen at −80°C until analysis.
Urine Metabolome Analysis
Metabolomics was performed by direct flow injection mass spectrometry (MS) using the commercially available Absolute-IDQ kit (Biocrates Life Sciences AG, Austria), in combination with an ABI 4000 Q-Trap (Applied Biosystems/MDS Sciex) mass spectrometer as previously described.32 Briefly, urine samples were thawed on ice, vortexed, and then centrifuged at 13 000 rpm. Ten microliters of urine supernatant was loaded onto the kit's filter paper substrate and dried under nitrogen. Metabolite extraction was achieved using methanol containing 5 mM ammonium acetate. A standard flow injection protocol consisting of two 20-μL injections (1 for the positive and 1 for the negative ion detection mode) was applied for all measurements. Urine metabolites were quantified by multiple reaction monitoring MS/MS using isotope-labeled internal standards from the kit plate filter.
Metabolites below the limit of detection were analyzed as limit of detection/2, and metabolite concentrations were normalized by urine creatinine to correct for dilution. The Biocrates MetIQ software was used to control the assay workflow from sample registration to automated calculation of metabolite concentrations to the export of data into other data analysis programs. An average of 95 metabolites was measured in each urine sample (range, 75-98) from the following classes: amino acids, acylcarnitines, hexose, creatinine, glyercophospholipids, and sphingolipids. Preliminary analysis demonstrated that only acylcarnitines and hexose were discriminatory (Table S1, SDC, http://links.lww.com/TXD/A24), so these were used for subsequent analyses (n = 34, plus creatinine).
Urine CXCL10 Analysis
Urinary CXCL10 was quantified by ELISA according to previously described protocols, on a Biotek Synergy 4 microplate reader (Gen 5 software; Fisher Scientific).21-23 The sensitivity was 1.95 pg/mL, and the intra-assay and inter-assay coefficients of variation were 3.90% and 4.54%, respectively. Urine CXCL10 was corrected for dilutional factors using urine creatinine determined from the metabolomics analysis.
Statistical Analysis
JMP Pro software version 11.0 (SAS Institute Inc., Cary, NC) was used for the patient demographics. Descriptive statistics are presented as means ± SD or median (interquartile range) as appropriate. Parametric continuous data were analyzed by Student t tests and nonparametric continuous data were analysed by the Wilcoxon rank-sum or Kruskal-Wallis rank sum tests. Frequencies of categorical variables are presented as counts and percentages and compared with Fisher exact test or Pearson χ2 test.
Statistical analysis of metabolomic data was performed using MetaboAnalyst and the R pls package.13,33-35 Metabolite data was log10-transformed to reduce skew but was not scaled. Classifiers were trained on pairwise comparisons with a projection on latent structures discriminant analysis (PLS-DA): none versus mild inflammation and none versus any inflammation. The optimal number of PLS components was identified by single cross-validation based on Q2 statistic (n = 5 considered), and the discriminant score and the AUC receiver operating characteristic calculated. The diagnostic threshold was determined using the “left upper corner criterion,” which maximizes the sum of sensitivity and specificity. Area under the curve confidence intervals that do not cross 0.5 (the diagonal line of chance agreement) are statistically significant by classical testing, which was confirmed in all cases by permutation testing on 1000 replicates. Leave-one-out cross-validation (LOOCV)34 was used to externally validate all classifiers on samples not included in the development of the classifier. In LOOCV, the model was refitted 137 times, each time omitting 1 observation. We then used the fitted model to predict the omitted case, which provided 137 predictions where the predicted observation was “out of sample.” The weighted sum of absolute regression coefficients was used to determine the relative importance of each metabolite, with weights being proportional to the reduction in the error sum of squares across PLS components.
The AUC diagnostic performance of CXCL10 was determined using logistic regression. Using the methods of Pencina et al,36 we calculated the continuous net reclassification index (NRI) and the integrated discrimination index (IDI). A statistically and clinically meaningful improvement in NRI and IDI were defined as an increase in NRI greater than 10% and relative IDI greater than 10%. We also included urinary CXCL10 as an additional predictor in the PLS-DA analysis described above.
RESULTS
Patient Characteristics
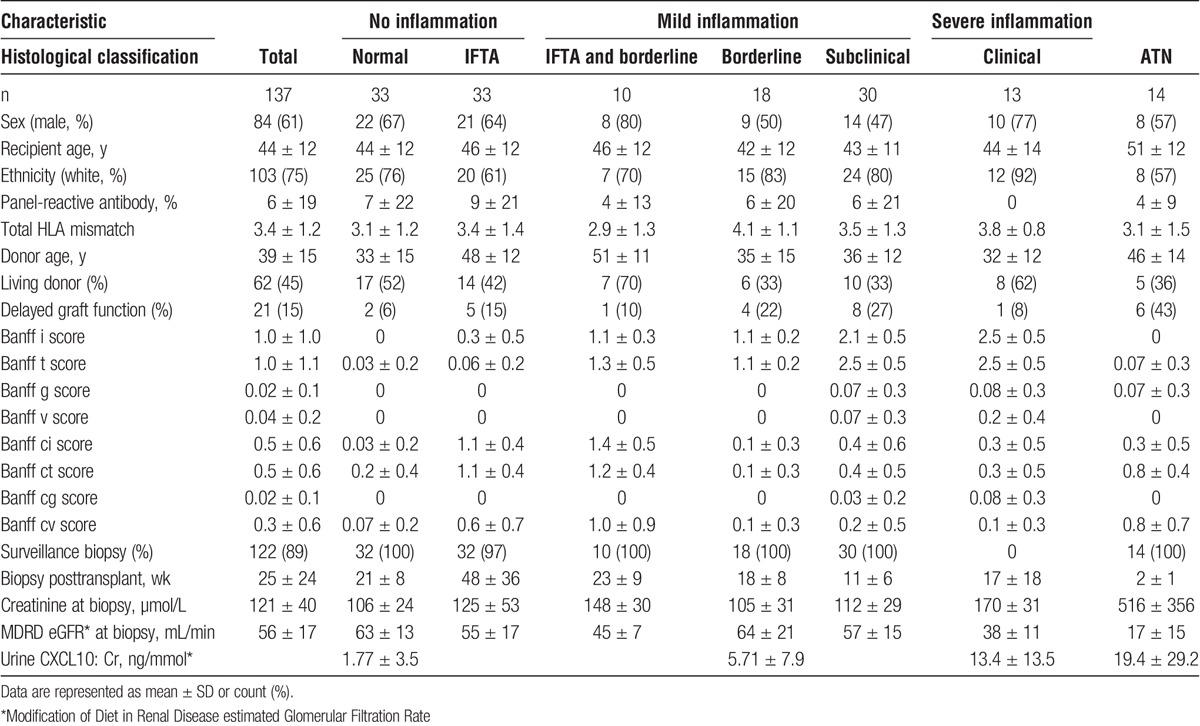
The patient demographics and histological diagnoses are shown in Table 1. Donor age was significantly greater in both IFTA groups (P < 0.0001). The Banff scores were significantly different between groups, by definition. As expected, serum creatinine was significantly higher in patients with clinical rejection compared with the other groups (P < 0.0001). Only 1 patient in the cohort developed a de novo donor-specific antibody. Finally, the biopsies with IFTA were done significantly later posttransplant than biopsies with inflammation.
TABLE 1.
Patient characteristics
Urinary Metabolomics Distinguishes Alloimmune Inflammation
The PLS2 algorithm seeks a common set of PLS components to distinguish the 3 distinct histologic phenotypes. A score plot on the first 3 PLS components (Figure 1) suggests that this PLS decomposition may be usefully applied to classify all 3 phenotypes with a single model, by using these scores as predictors in a multinomial regression model that assigns a probability for each mutually exclusive outcome. The predicted class with the highest assigned probability can then be compared with the observed histology. The performance of this 3-way classifier was measured in terms of agreement between predicted and actual phenotype using a Cohen κ, with κ = 0.601 (95% confidence interval [95% CI], 0.46-0.74; P < 0.001), which is substantial agreement by the Landis-Koch criteria. Encouraged by these results, we then sought to formally train a classifier using specific pairwise comparisons.
FIGURE 1.
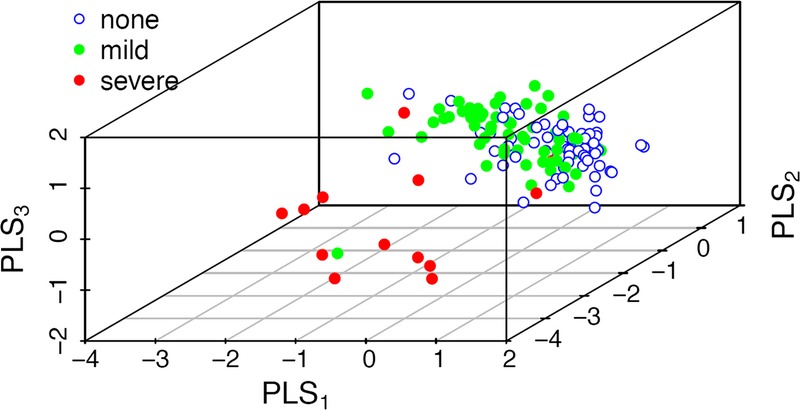
Urinary metabolites can distinguish the severity of underlying alloimmune inflammation using a 3-way PLS2 classifier. Metabolomics significantly distinguishes no inflammation (blue), from mild (green) and severe (red) inflammation.
No Inflammation Versus Mild Inflammation
This classifier was developed by training no inflammation versus mild inflammation. The optimal 2-component model yielded an AUC of 0.78 (95% CI, 0.70-0.86), with a sensitivity of 0.67 and specificity of 0.78. These findings were confirmed by permutation testing (P < 0.003) and LOOCV (P < 0.01). The full PLS-DA model (n = 34 metabolites) demonstrated a stepwise increase in classification scores with increasing alloimmune inflammation (data not shown).
The weighted sum of absolute regression coefficients identified the top 10 metabolites, and diagnostic performance was characterized for the top 10 (AUC, 0.77; 95% CI, 0.69-0.85; P < 0.001) and top 3 metabolites (AUC, 0.74; 95% CI, 0.65-0.83). The top 3 metabolites contributing to this classifier were hexose, C8:1, and C2 which experienced log2-fold changes of 0.65 or higher between the no inflammation and mild inflammation groups.
No Inflammation Versus Any Inflammation
This classifier was developed by training no inflammation versus any inflammation. The optimal 2-component model yielded an AUC of 0.81 (95% CI, 0.74-0.88) with a sensitivity of 0.76 and specificity of 0.63. These findings were confirmed by permutation testing (P < 0.001) and LOOCV. When the full PLS-DA model was applied to the full data set (n = 137 urines), this demonstrated a significant and step-wise increase in classification scores with increasing alloimmune inflammation (Figure 2). These findings were externally validated with additional severe inflammation samples (clinical rejection, n = 6; classification score, 0.72 ± 0.2; P = 0.0003 compared with no inflammation).
FIGURE 2.
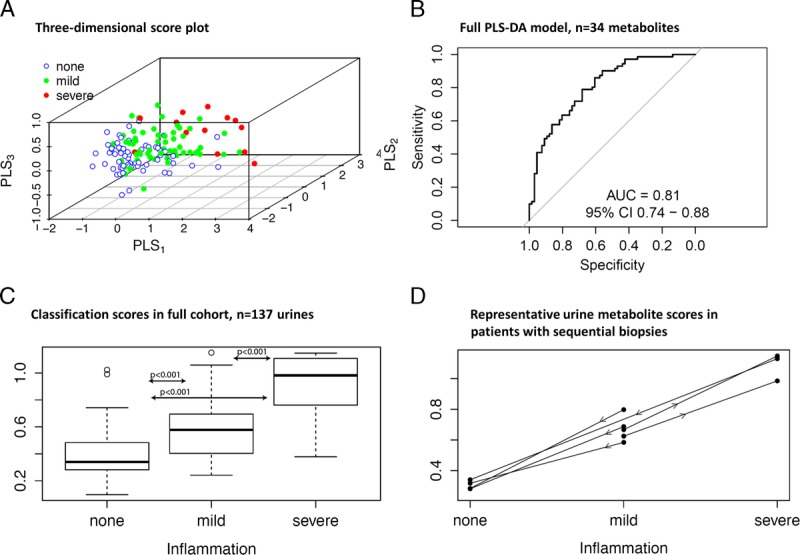
Urinary metabolites distinguish alloimmune inflammation, using a classifier trained on no inflammation versus any inflammation. A, 3D score plot demonstrates separation of no inflammation (blue), from mild (green) and severe (red) inflammation. The diagnostic performance of the (B) Full PLS-DA model (n = 34 metabolites); (C) Performance of the classification scores in the full cohort (n = 137 urines); (D) Representative metabolite scores in patients with sequential biopsies.
The weighted sum of absolute regression coefficients identified the top 10 metabolites, and diagnostic performance was characterized for the top 10 (AUC, 0.78; 95% CI, 0.71-0.86; P < 0.001) and top 3 metabolites (AUC, 0.78; 95% CI, 0.70-0.86). The top 3 metabolites contributing to this classifier were hexose, C8:1, and C3-DC/C4-OH which experienced absolute log2-fold changes of 0.82 or higher between the no inflammation and any inflammation groups (Figure 2).
Urine Metabolites Reflect Differential Alloimmune Inflammation Within Patients
The histology and urine metabolite signature changed in sequential biopsies in some patients with mild subclinical inflammation that was more severe on repeat biopsy performed for graft dysfunction, whereas others had treatment of subclinical/clinical rejection that resulted in histological improvement and a metabolite signature of no inflammation (Figure 2). These observations suggest that in stable patients, the inflammation signature may precede a clinical rejection episode and that successful treatment of a rejection episode may result in normalization of the urine signal.
Urine CXCL10
Urine CXCL10:Cr showed a significant stepwise increase according to increasing severity of alloimmune inflammation as expected (Figure 3). Urine CXCL10:Cr alone showed similar diagnostic performance (AUC, 0.76; 95% CI, 0.68-0.84) as the urine metabolite panel (AUC, 0.81; 95% CI, 0.74-0.88). The addition of urine CXCL10 to the PLS model increased the overall diagnostic performance (combined AUC, 0.84; 95% CI, 0.78-0.91), which was a statistically significant improvement using both the DeLong test for comparing 2 correlated ROC curves (P < 0.05) and the continuous NRI/IDI comparisons (P < 0.001) (Figure 3).
FIGURE 3.
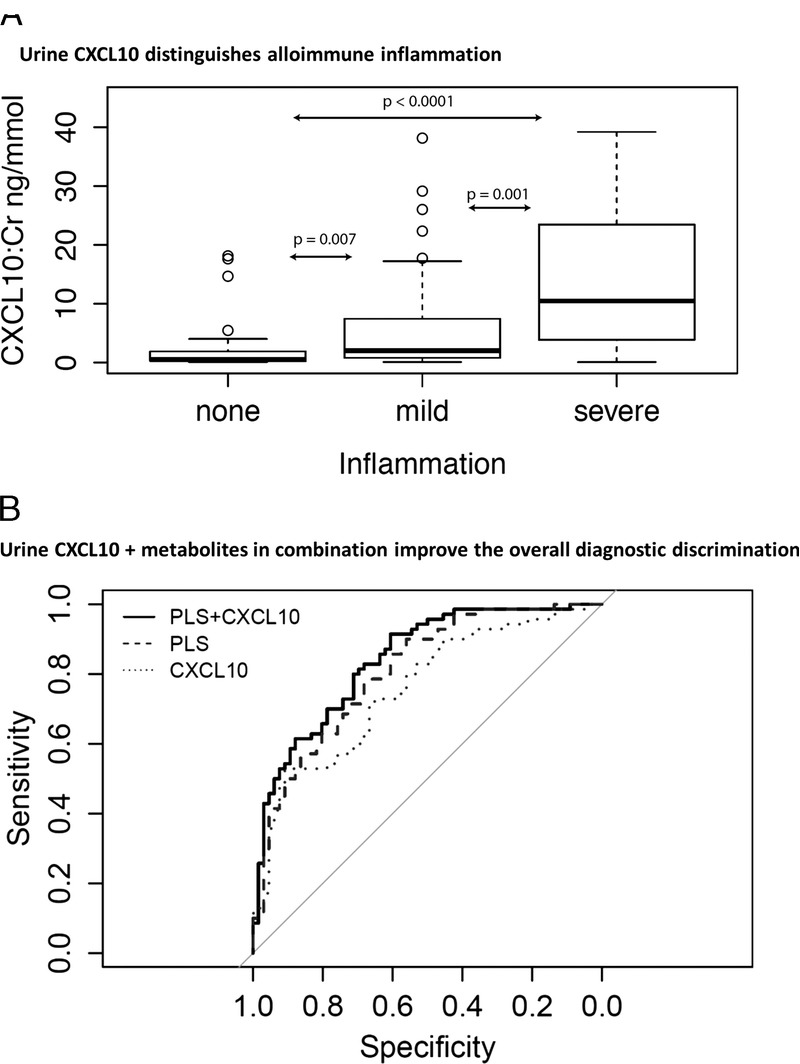
Urinary CXCL10 distinguishes alloimmune inflammation and improves the diagnostic performance of urinary metabolites. A, Urinary CXCL10 demonstrates increasing levels with increasing severity of alloimmune inflammation. B, The combination of urine CXCL10 and metabolites improves the overall diagnostic performance for alloimmune inflammation.
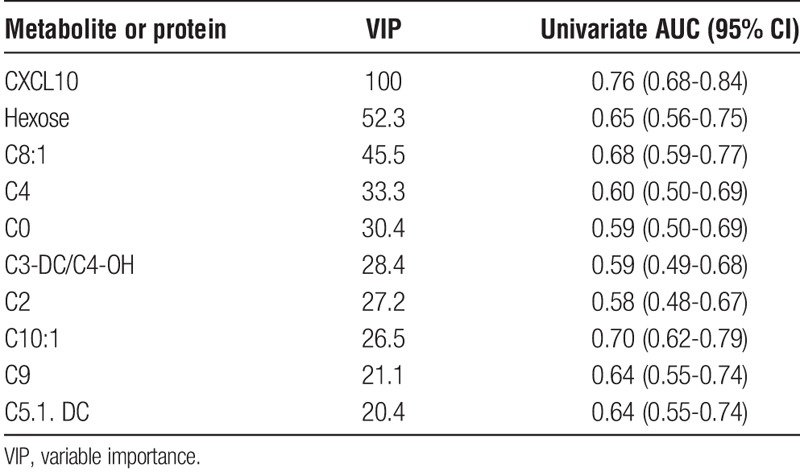
In addition to adding urine CXCL10 to the PLS scores, urine CXCL10 was also included as an additional predictor within the standard PLS-DA analysis of none versus any inflammation. The optimal 2-component model including urine CXCL10 yielded an AUC of 0.845 (95% CI, 0.78-0.91), which was confirmed by permutation testing (P < 0.001) and LOOCV. Interestingly, the variable importance scores demonstrated that urinary CXCL10 was the most important predictor with twice the score of the next most predictive metabolite (Table 2).
TABLE 2.
Scaled VIP scores and individual diagnostic performance of the top 10 contributing analytes
Any Inflammation Versus ATN
Confounding was noted when the rejection classifier was applied to patients with ATN (n = 14), with a classification score of 0.78 ± 0.2 which was significantly different from the no inflammation group (P < 0.0001). As expected urinary CXCL10 did not distinguish ATN from rejection.37 For this reason, we next sought to determine if alloimmune inflammation could be distinguished from ATN. This ATN classifier was developed by training any inflammation (n = 71) versus ATN (n = 14). The 3-component model had excellent performance in discriminating ATN from any inflammation with an AUC of 1.0 (95% CI, 1-1), which was confirmed with permutation testing (P < 0.001) and LOOCV (P < 0.0001). The ATN classifier yielded significantly different scores in patients with any inflammation versus ATN (Figure 4). Interestingly, the metabolites were different in the ATN versus rejection classifiers; and the top 5 ATN metabolites (C16.1. OH, C16, C3OH, C2, and C0) showed no overlap with the top 5 rejection metabolites.
FIGURE 4.
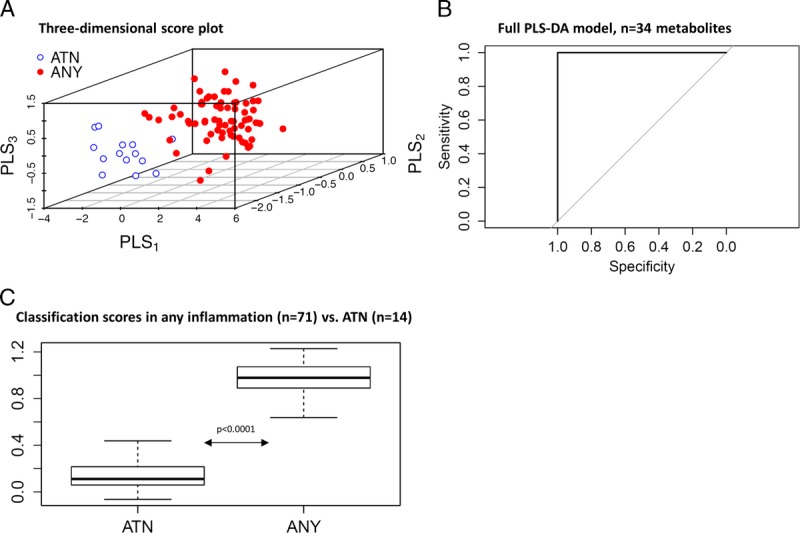
Urinary metabolites distinguish any alloimmune inflammation from ATN, using a classifier trained on any inflammation versus ATN. A, 3D score plot demonstrates separation of any inflammation (red) from ATN (blue). The diagnostic performance of the (B) Full PLS-DA model (n = 34 metabolites); (C) Performance of the classification scores in any inflammation (n = 71) versus ATN (n = 14).
This ATN classifier is useful for sequential application because it did not identify biopsies with no inflammation in the original training set. Specifically, the rejection classifier could be used to identify potential alloimmune inflammation, followed by the ATN classifier to rule out ATN.
DISCUSSION
This study demonstrates that a quantitative urine MS metabolomic signature is capable of discriminating between grafts with no inflammation (normal histology, IFTA without inflammation) from those with subclinical inflammation (borderline inflammation with or without IFTA; subclinical TCMR), and clinical TCMR. From the panel of 34 metabolites used here, the urine metabolites that best discriminated between the various degrees of cellular inflammation in the renal allograft were the acylcarnitines and hexose. The addition of the urine chemokine protein CXCL10 improved the overall diagnostic discrimination of urine metabolites alone, and indeed was the most important predictor of alloimmune inflammation when included in the PLS-DA model. Finally, a novel ATN classifier was developed to accurately discriminate alloimmune inflammation from ATN.
Carnitine (1-3-hydroxy-4-N, N,N-trimethyaminobutyrate) is an essential metabolite required for the translocation of activated long-chain fatty acids from the cytosol to the mitochondrial matrix, where β-oxidation of fatty acids takes place providing energy to the cells. In humans, 75% of carnitine comes from dietary animal sources, but 25% is endogenously synthesized, primarily in the liver and kidney. The kidney reclaims filtered carnitine through the organic cation transporter 2 (OTCN2) (encoded by the SLC 22 A5 gene) present in the brush border of the proximal tubule.38,39
The expression of gene transcripts for several organic cation transporters has been shown to be decreased in clinical TCMR in both mouse and human kidneys, as part of nonspecific tubular epithelial cell injury that occurs also in ATN.9-11 However, there are no data, to our knowledge, on the expression of the carnitine transporter OTCN2 either in animal models of renal transplantation or in human renal transplant recipients. Nevertheless, patients with mild inflammation showed an altered pattern of urine acylcarnitine excretion compared with those patients with biopsies showing no inflammation. Moreover, in severe inflammation cases with clinical rejection, the urine concentration levels of several acylcarnitines, and in particular that of the acylcarnitine C3-DC/C4-OH and C8:1, were markedly increased over that observed in patients with no or mild inflammation, consistent with a decrease in the tubular expression or function of the OTCN2 transporter, as has been reported for other cation transporters in rodents and humans.9-11
The differences in urine carnitine excretion in patients with subclinical or clinical rejection may also be related to the composition of the cellular infiltrate in the graft. There is a preponderance of activated monocytes in clinical rejection as compared with subclinical rejection in which the infiltrating cells are mostly lymphocytes.40 Both lymphocytes and monocytes contain free carnitine and acylcarnitines, with monocytes containing approximately 4-fold more total carnitine per cell than lymphocytes.41 Moreover, monocytes activated in vitro with phorbol esters increase their free carnitine levels by greater than 50%.42 Lymphocytes and monocytes infiltrating the kidney allograft during acute rejection undergo apoptosis,43 and it is plausible therefore that the increased urinary amounts of carnitines, such as C3-DC/C4-OH, observed in clinical rejection may in part be the result of increased amounts of filtered carnitines derived from apoptotic monocytes in the graft that are not reclaimed by the decreased tubular expression of the OTCN2 transporter.
Notably, the urinary metabolite profile accurately reflected changing alloimmune inflammation in individuals with sequential biopsies. These findings are consistent with Foxall et al12 who showed that the urinary excretion of trimethylamine-N-oxide detected by nuclear magnetic resonance spectroscopy increased 2 days before a clinical rejection episode and returned to normal after its treatment. In further support of these observations, in an experimental rat renal allograft model, Edemir et al11 showed that the downregulated expression of aquaporin 2 and epithelial Na channel genes that occurred with clinical rejection was increased toward normal after treatment with cyclosporine.
As anticipated, the urinary CXCL10 findings were highly consistent with the reported literature.21-23,37 Interestingly, however, the urine metabolites that discriminated between inflamed and noninflamed renal parenchyma in our adult renal transplants were different from those observed by others.12-15 These differences may relate to the different metabolites and platforms used for evaluation and reinforce the need for independent validation studies.
The evaluation of subclinical rejection allowed us to elucidate the interactions between alloimmune inflammation and graft function. Notably, patients with subclinical rejection had equivalent Banff scores as the clinical rejection group despite having similar graft function as those patients with no inflammation. The observed stepwise increase in the classifier scores between no inflammation, mild, and severe inflammation suggests that the rejection classifier is independent of graft function. Furthermore, both the clinical rejection and ATN groups had poor allograft function despite highly divergent Banff scores; moreover, the ATN classifier accurately distinguished these 2 groups, demonstrating that urinary metabolites reflect underlying tubular pathophysiology independent of graft function.
There are some limitations to this study. First, the number of patients is relatively small, particularly those with clinical rejection. However, these findings were validated with permutation testing, LOOCV, and additional clinical rejection samples. Second, this analysis was performed in highly selected cases and controls resulting in selection bias; and thus the diagnostic performance may be an overestimate of its performance in a larger, unselected population. Third, patients were studied predominantly in the early posttransplant period; therefore, pathologies that tend to present later (eg, recurrent glomerulonephritis, AMR) are not represented. Finally, there are no patients with inflammatory conditions, such as bacterial or viral infections as controls. These discovery-based metabolomic studies require validation in independent cohorts.
Nevertheless, despite the above limitations, we believe that quantitative MS-based urine metabolomics may be useful for the diagnosis of renal allograft inflammation. Importantly, this approach to biomarker development demonstrates that urine metabolomics in conjunction with urine CXCL10 improves the overall diagnostic discrimination and that sequential application of different metabolite classifiers can be used to rule out confounders, such as ATN. Ultimately, noninvasive strategies for the early detection of alloimmune inflammation may improve long-term graft survival for renal transplant patients.
ACKNOWLEDGMENT
The authors would like to acknowledge Evelyn Roloff for her assistance in preparation of the article.
Footnotes
Published online 19 May 2016.
This study was funded by the Canadian Institutes of Health Research. J.H. has salary support from the Manitoba Medical Services Foundation Dr. F.W. Du Val Clinical Research Professorship and CIHR New Investigator Salary Award. PN holds the Flynn Family Chair in Renal Transplantation, University of Manitoba.
J.H. and A.S. contributed equally to this work.
J.H. participated in the study design and writing of the article. A.S. performed the statistical analysis and assisted with writing the article. R.M. performed the quantitative metabolomics analysis and assisted with writing the article. D.W. supervised the quantitative metabolomics analysis and assisted with writing the article. C.W. assisted with the statistical analysis and contributed to writing the article. L.S. contributed to the clinical cohort collection and writing of the article. M.K. contributed to the clinical cohort collection and writing of the article. I.W.G. evaluated the histopathology and contributed to writing the article. P.W.N. contributed to collection of the clinical database/urine bio-bank. He also contributed to the study design, data analysis and writing the article. D.N.R. contributed to collection of the clinical database/urine bio-bank, also involved in the study design, data analysis and writing the article.
Supplemental digital content (SDC) is available for this article. Direct URL citations appear in the printed text, and links to the digital files are provided in the HTML text of this article on the journal’s Web site (www.transplantationdirect.com).
REFERENCES
- 1.El-Zoghby ZM, Stegall MD, Lager DJ, et al. Identifying specific causes of kidney allograft loss. Am J Transplant. 2009;9:527–535. [DOI] [PubMed] [Google Scholar]
- 2.Rush D, Arlen D, Boucher A, et al. Lack of benefit of early protocol biopsies in renal transplant patients receiving TAC and MMF: a randomized study. Am J Transplant. 2007;7:2538–2545. [DOI] [PubMed] [Google Scholar]
- 3.Rush DN, Cockfield SM, Nickerson PW, et al. Factors associated with progression of interstitial fibrosis in renal transplant patients receiving tacrolimus and mycophenolate mofetil. Transplantation. 2009;88:897–903. [DOI] [PubMed] [Google Scholar]
- 4.Amico P, Hirt-Minkowski P, Hönger G, et al. Risk stratification by the virtual crossmatch: a prospective study in 233 renal transplantations. Transpl Int. 2011;24:560–569. [DOI] [PubMed] [Google Scholar]
- 5.Heilman RL, Devarapalli Y, Chakkera HA, et al. Impact of subclinical inflammation on the development of interstitial fibrosis and tubular atrophy in kidney transplant recipients. Am J Transplant. 2010;10:563–570. [DOI] [PubMed] [Google Scholar]
- 6.Cosio FG, Amer H, Grande JP, et al. Comparison of low versus high tacrolimus levels in kidney transplantation: assessment of efficacy by protocol biopsies. Transplantation. 2007;83:411–416. [DOI] [PubMed] [Google Scholar]
- 7.Wiebe C, Gibson IW, Blydt-Hansen TD, et al. Evolution and clinical pathologic correlations of de novo donor-specific HLA antibody post kidney transplant. Am J Transplant. 2012;12:1157–1167. [DOI] [PubMed] [Google Scholar]
- 8.Moreso F, Carrera M, Goma M, et al. Early subclinical rejection as a risk factor for late chronic humoral rejection. Transplantation. 2012;93:41–46. [DOI] [PubMed] [Google Scholar]
- 9.Mueller TF, Einecke G, Reeve J, et al. Microarray analysis of rejection in human kidney transplants using pathogenesis-based transcript sets. Am J Transplant. 2007;7:2712–2722. [DOI] [PubMed] [Google Scholar]
- 10.Einecke G, Kayser D, Vanslambrouck JM, et al. Loss of solute carriers in T cell-mediated rejection in mouse and human kidneys: an active epithelial injury-repair response. Am J Transplant. 2010;10:2241–2251. [DOI] [PubMed] [Google Scholar]
- 11.Edemir B, Reuter S, Borgulya R, et al. Acute rejection modulates gene expression in the collecting duct. J Am Soc Nephrol. 2008;19:538–546. [DOI] [PMC free article] [PubMed] [Google Scholar]
- 12.Foxall PJ, Mellotte GJ, Bending MR, et al. NMR spectroscopy as a novel approach to the monitoring of renal transplant function. Kidney Int. 1993;43:234–245. [DOI] [PubMed] [Google Scholar]
- 13.Blydt-Hansen TD, Sharma A, Gibson IW, et al. Urinary metabolomics for noninvasive detection of borderline and acute T cell-mediated rejection in children after kidney transplantation. Am J Transplant. 2014;14:2339–2349. [DOI] [PubMed] [Google Scholar]
- 14.Suhre K, Schwartz JE, Sharma VK, et al. Urine metabolite profiles predictive of human kidney allograft status. J Am Soc Nephrol. 2016;24:626–636. [DOI] [PMC free article] [PubMed] [Google Scholar]
- 15.Rush D, Somorjai R, Dolenko B, et al. Validation of urine magnetic resonance spectra (UMRS) for the diagnosis of renal allograft pathology: results from the DeKAF study. Am J Transplant. 2012;12(S3):193. [Google Scholar]
- 16.Hauser IA, Spiegler S, Kiss E, et al. Prediction of acute renal allograft rejection by urinary monokine induced by IFN-gamma (MIG). J Am Soc Nephrol. 2005;16:1849–1858. [DOI] [PubMed] [Google Scholar]
- 17.Matz M, Beyer J, Wunsch D, et al. Early post-transplant urinary IP-10 expression after kidney transplantation is predictive of short- and long-term graft function. Kidney Int. 2006;69:1683–1690. [DOI] [PubMed] [Google Scholar]
- 18.Kanmaz T, Feng P, Torrealba J, et al. Surveillance of acute rejection in baboon renal transplantation by elevation of interferon-gamma inducible protein-10 and monokine induced by interferon-gamma in urine. Transplantation. 2004;78:1002–1007. [DOI] [PubMed] [Google Scholar]
- 19.Hu H, Aizenstein BD, Puchalski A, et al. Elevation of CXCR3-binding chemokines in urine indicates acute renal-allograft dysfunction. Am J Transplant. 2004;4:432–437. [DOI] [PubMed] [Google Scholar]
- 20.Peng W, Chen J, Jiang Y, et al. Urinary fractalkine is a marker of acute rejection. Kidney Int. 2008;74:1454–1460. [DOI] [PubMed] [Google Scholar]
- 21.Hirt-Minkowski P, Amico P, Ho J, et al. Detection of clinical and subclinical tubulo-interstitial inflammation by the urinary CXCL10 chemokine in a real-life setting. Am J Transplant. 2012;12:1811–1823. [DOI] [PubMed] [Google Scholar]
- 22.Schaub S, Nickerson P, Rush D, et al. Urinary CXCL9 and CXCL10 levels correlate with the extent of subclinical tubulitis. Am J Transplant. 2009;9:1347–1353. [DOI] [PubMed] [Google Scholar]
- 23.Ho J, Rush DN, Karpinski M, et al. Validation of urinary CXCL10 as a marker of borderline, subclinical, and clinical tubulitis. Transplantation. 2011;92:878–882. [DOI] [PubMed] [Google Scholar]
- 24.Blydt-Hansen TD, Gibson IW, Gao A, et al. Elevated urinary CXCL10-to-creatinine ratio is associated with subclinical and clinical rejection in pediatric renal transplantation. Transplantation. 2015;99:797–804. [DOI] [PubMed] [Google Scholar]
- 25.Tatapudi RR, Muthukumar T, Dadhania D, et al. Noninvasive detection of renal allograft inflammation by measurements of mRNA for IP-10 and CXCR3 in urine. Kidney Int. 2004;65:2390–2397. [DOI] [PubMed] [Google Scholar]
- 26.Hricik DE, Nickerson P, Formica RN, et al. Multicenter validation of urinary CXCL9 as a risk-stratifying biomarker for kidney transplant injury. Am J Transplant. 2013;13:2634–2644. [DOI] [PMC free article] [PubMed] [Google Scholar]
- 27.Hu H, Kwun J, Aizenstein BD, et al. Noninvasive detection of acute and chronic injuries in human renal transplant by elevation of multiple cytokines/chemokines in urine. Transplantation. 2009;87:1814–1820. [DOI] [PubMed] [Google Scholar]
- 28.Jackson JA, Kim EJ, Begley B, et al. Urinary chemokines CXCL9 and CXCL10 are noninvasive markers of renal allograft rejection and BK viral infection. Am J Transplant. 2011;11:2228–2234. [DOI] [PMC free article] [PubMed] [Google Scholar]
- 29.Rabant M, Amrouche L, Lebreton X, et al. Urinary C-X-C motif chemokine 10 independently improves the noninvasive diagnosis of antibody-mediated kidney allograft rejection. J Am Soc Nephrol. 2015;26:2840–2851. [DOI] [PMC free article] [PubMed] [Google Scholar]
- 30.Suthanthiran M, Schwartz JE, Ding R, et al. Urinary-cell mRNA profile and acute cellular rejection in kidney allografts. N Engl J Med. 2013;369:20–31. [DOI] [PMC free article] [PubMed] [Google Scholar]
- 31.Racusen LC, Solez K, Colvin RB, et al. The Banff 97 working classification of renal allograft pathology. Kidney Int. 1999;55:713–723. [DOI] [PubMed] [Google Scholar]
- 32.Bouatra S, Aziat F, Mandal R, et al. The human urine metabolome. PLoS One. 2013;8:e73076. [DOI] [PMC free article] [PubMed] [Google Scholar]
- 33.Xia J, Mandal R, Sinelnikov IV, et al. MetaboAnalyst 2.0—a comprehensive server for metabolomic data analysis. Nucleic Acids Res. 2012;40(Web Server issue):W127–33. [DOI] [PMC free article] [PubMed] [Google Scholar]
- 34.Xia J, Broadhurst DI, Wilson M, et al. Translational biomarker discovery in clinical metabolomics: an introductory tutorial. Metabolomics. 2013;9:280–299. [DOI] [PMC free article] [PubMed] [Google Scholar]
- 35.Mevik BHWR, Liland KHR. A language and environment for statistical computing. Vienna, Austria: R Foundation for Statistical Computing; 2013. [Google Scholar]
- 36.Pencina MJ, D'Agostino RB, Sr, D'Agostino RB, Jr, et al. Evaluating the added predictive ability of a new marker: from area under the ROC curve to reclassification and beyond. Stat Med. 2008;27:157–172; discussion 207–12. [DOI] [PubMed] [Google Scholar]
- 37.Ho J, Rush DN, Krokhin O, et al. Elevated urinary matrix metalloproteinase-7 detects underlying renal allograft inflammation and injury. Transplantation. 2016;100:648–654. [DOI] [PubMed] [Google Scholar]
- 38.Koepsell H, Lips K, Volk C. Polyspecific organic cation transporters: structure, function, physiological roles, and biopharmaceutical implications. Pharm Res. 2007;24:1227–1251. [DOI] [PubMed] [Google Scholar]
- 39.Motohashi H, Inui K. Organic cation transporter OCTs (SLC22) and MATEs (SLC47) in the human kidney. AAPS J. 2013;15:581–588. [DOI] [PMC free article] [PubMed] [Google Scholar]
- 40.Grimm PC, McKenna R, Nickerson P, et al. Clinical rejection is distinguished from subclinical rejection by increased infiltration by a population of activated macrophages. J Am Soc Nephrol. 1999;10:1582–1589. [DOI] [PubMed] [Google Scholar]
- 41.Cress AP, Fraker PJ, Bieber LL. Carnitine and acylcarnitine levels of human peripheral blood lymphocytes and mononuclear phagocytes. Biochim Biophys Acta. 1989;992:135–139. [DOI] [PubMed] [Google Scholar]
- 42.Kurth L, Fraker P, Bieber L. Utilization of intracellular acylcarnitine pools by mononuclear phagocytes. Biochim Biophys Acta. 1994;1201:321–327. [DOI] [PubMed] [Google Scholar]
- 43.Meehan SM, McCluskey RT, Pascual M, et al. Cytotoxicity and apoptosis in human renal allografts: identification, distribution, and quantitation of cells with a cytotoxic granule protein GMP-17 (TIA-1) and cells with fragmented nuclear DNA. Lab Invest. 1997;76:639–649. [PubMed] [Google Scholar]


