

Abstract
Endurance and resistance exercise training induces specific and profound changes in the skeletal muscle transcriptome. Peroxisome proliferator-activated receptor γ coactivator-1 α (PGC-1α) coactivators are not only among the genes differentially induced by distinct training methods, but they also participate in the ensuing signaling cascades that allow skeletal muscle to adapt to each type of exercise. Although endurance training preferentially induces PGC-1α1 expression, resistance exercise activates the expression of PGC-1α2, -α3, and -α4. These three alternative PGC-1α isoforms lack the arginine/serine-rich (RS) and RNA recognition motifs characteristic of PGC-1α1. Discrete functions for PGC-1α1 and -α4 have been described, but the biological role of PGC-1α2 and -α3 remains elusive. Here we show that different PGC-1α variants can affect target gene splicing through diverse mechanisms, including alternative promoter usage. By analyzing the exon structure of the target transcripts for each PGC-1α isoform, we were able to identify a large number of previously unknown PGC-1α2 and -α3 target genes and pathways in skeletal muscle. In particular, PGC-1α2 seems to mediate a decrease in the levels of cholesterol synthesis genes. Our results suggest that the conservation of the N-terminal activation and repression domains (and not the RS/RNA recognition motif) is what determines the gene programs and splicing options modulated by each PGC-1α isoform. By using skeletal muscle-specific transgenic mice for PGC-1α1 and -α4, we could validate, in vivo, splicing events observed in in vitro studies. These results show that alternative PGC-1α variants can affect target gene expression both quantitatively and qualitatively and identify novel biological pathways under the control of this system of coactivators.
Keywords: alternative splicing, exercise, gene regulation, peroxisome proliferator-activated receptor γ coactivator 1-α (PGC-1α) (PPARGC1A), skeletal muscle, PGC-1α2, PGC-1α3, PGC-1α4, exon array
Introduction
PGC-1α6 coactivators are transcriptional regulators with important roles in skeletal muscle adaptation to physical exercise (1). Upon specific physiological signals, a single PGC-1α gene expresses different variants with discrete biological roles (2–4). For example, in skeletal muscle, resistance exercise and β2-adrenergic stimulation activate a distal PGC-1α promoter that controls the expression of alternative isoforms PGC-1α2, PGC-1α3, and PGC-1α4 (3, 5, 6), which undergo additional alternative splicing of their primary transcript (Fig. 1A) (3). Induction of the canonical PGC-1α1 isoform in skeletal muscle promotes mitochondrial biogenesis and an oxidative phenotype that mediates adaptive responses to endurance training (7). Although widely different in its structure, PGC-1α4 maintains transcriptional activity and regulates distinct target gene networks involved in resistance exercise-driven hypertrophy in skeletal muscle (3, 6). To date, the biological roles of the remaining alternative isoforms of PGC-1α are still unknown, and conventional 3′ expression arrays have failed to identify specific gene networks targeted by PGC-1α2 and -α3 (3).
FIGURE 1.

PGC-1α isoform protein dynamics. A, Modular structure of PGC-1α isoforms (amino acid numbers are relative to PGC-1α1). Main domains depicted: activation, repression, RS, and RRM. Leucine-rich motifs (LLXXL and LXXLL) indicate interaction sites for transcription factors and other coactivators. “P” indicates phosphorylation sites for p38 MAPK. C-terminal RS and RRM domains interact with splicing factors and the mediator complex via Med1. AA, amino acids; PP, proximal promoter; AP, alternative promoter. B, β-adrenergic stimulation regulates PGC-1α isoform expression in skeletal muscle. Gene expression in the gastrocnemius muscle was analyzed by qRT-PCR. PBS control was compared with clenbuterol (i.p. 2 mg/kg for 16 h). Error bars represent S.E. *, p < 0.05 versus PBS. C, expression of PGC-1α isoforms in mouse primary myotubes. Differentiated myotubes were transduced with recombinant adenovirus to express GFP alone (control) or GFP and each PGC-1α isoform from independent promoters. Error bars represent S.D. D, protein immunoblot for myotubes transduced with PGC-1α isoforms. E, PGC-1α protein dynamics. 4 h of 10 μm MG132 treatment stabilizes all the PGC-1α isoforms. F, time course for cycloheximide chase and half-life determination for all transduced PGC-1α isoforms. *, at least 240 min as this was the end point of the chase. G, exon/intron structure of PGC-1α isoforms. H, probe signal intensity for transduced PGC-1α isoforms obtained in exon arrays. Arrows and letters indicate regions of interest: a, exon 1a specific for PGC-1α1; b, exon 2 common to all isoforms; c, exon 7-8 region present in PGC-1α1/α2/α3; d, 3′ regions only present in PGC-1α1. * indicates stop codon for each isoform, crossed exons indicate alternative splicing-incomplete exon. I, qRT-PCR validation of the expression of PGC-1α isoforms ectopically expressed in myotubes. Error bars represent S.D. *, p < 0.05 versus GFP.
PGC-1α1 exhibits a dual role with regard to transcriptional regulation of its target genes as it can coactivate transcription factor-mediated gene expression but also modulate alternative splicing of the nascent transcript (8). Co-transcriptional splicing of pre-mRNA is a common phenomenon (9) where mRNA editing factors such as serine/arginine (SR) proteins can dock to the hyperphosphorylated C-terminal domain (CTD) of the RNA polymerase II to mature the nascent mRNA (10). Although this mechanism is not yet fully understood, it has been shown that transcriptional coactivators can interact directly with the spliceosome and condition the splicing options that follow (11–13). In this sense, PGC-1α1 acts much like an SR protein due to two characteristic domains located in its own CTD: an arginine/serine-rich (RS) domain that mediates protein-protein interactions (with other SR proteins) and an RNA recognition motif (RRM) that allows interaction with the nascent mRNA (14). Deletion of any of those CTD regions is sufficient to alter the co-transcriptional splicing activity of PGC-1α1 on the expression of both an artificial minigene reporter (8) and endogenous genes (15).
One of the most striking structural features of non-canonical PGC-1α isoforms (PGC-1α2, -α3, and -α4) is that all three isoforms lack the CTD, including the RS and RRM domains (3) (Fig. 1A). This suggests that different PGC-1α variants could have selective effects on target gene splicing. Hence, in this study, we have investigated whether the biological functions of the novel PGC-1α variants are mediated by quantitative and/or qualitative changes in target gene transcription produced by distinct isoform expression. To this end, we have determined the occurrence of alternative splicing events under the control of different PGC-1α coactivators in mouse primary myotubes. With this approach, we have identified several gene pathways regulated by PGC-1α2 and -α3. Our results show that the different PGC-1α proteins promote both quantitative and qualitative changes in gene expression. By using several complementary bioinformatics tools, we identified a broad number of genes that display differential splicing regulated by distinct PGC-1α isoforms. By designing targeted qRT-PCR strategies, we verified some of the different alternative splicing events under PGC-1α control. These include the PGC-1α2- and -α3-dependent regulation of alternative 3′-UTR DEAD box polypeptide 27 (Ddx27) isoform expression and PGC-α1- and -α4-mediated alternative promoter usage of oxysterol-binding protein-like 1A (Osbpl1a) and n-myc downstream regulated gene 4 (Ndrg4). This study identifies a mechanism of action for PGC-1α isoforms and provides a framework for the analysis of isoform-specific effects on gene expression.
Results
Alternative PGC-1α Isoforms Display Distinct Transcriptional Regulation and Protein Stability
The importance of alternative promoter usage in the expression of PGC-1α isoforms has been clearly demonstrated (3, 6, 16). In addition, we have found that, in murine skeletal muscle, β2-adrenergic stimulation with clenbuterol results in differential PGC-1α promoter regulation as it increases the levels of alternative isoforms but represses PGC-1α1 expression (Fig. 1B).
The specific transcriptional regulation of PGC-1α isoforms is accompanied by significant changes in their mRNA structure. We hypothesized that differences in the C terminus of the alternative PGC-1α isoforms that include binding sites for splicing factors might affect target gene splicing. To investigate this hypothesis, we have performed global analysis of gene expression under the control of each PGC-1α variant by using an exon-based array designed for whole-transcriptome analysis at the gene and exon level. Each PGC-1α variant (or GFP as control) was expressed in mouse primary myotubes (Fig. 1C) through the use of recombinant adenoviral vectors (3). As reported previously (3), we observed that, even when normalized by mRNA expression, the different PGC-1α proteins accumulate at different levels (Fig. 1D). These differences in PGC-1α isoform protein accumulation are also observed when assessing their basal levels in vivo in adult skeletal muscle (3). Although PGC-1α1 has been previously reported to be a short lived protein due to ubiquitin-proteasome degradation (17, 18), not much is known about the protein stability of the other PGC-1α isoforms. To determine whether all PGC-1α variants are targeted to the same degradation pathway, myotubes expressing each of the PGC-1α isoforms were treated for 4 h with the proteasome inhibitor MG132. All PGC-1α proteins accumulate (to different degrees) upon MG132 treatment (Fig. 1E), indicating that they are all degraded through the ubiquitin-proteasome pathway. To better compare the protein degradation dynamics between the different isoforms, we performed a cycloheximide chase. Upon inhibition of protein synthesis, the degradation patterns were strikingly different (Fig. 1F). Although PGC-1α2 and PGC-1α3 displayed a half-life similar to PGC-1α1 (∼30 min; Fig. 1F and Ref. 19), PGC-1α4 showed greater stability with a remarkably long half-life, similar to what is described for yet another PGC-1α isoform, NT-PGC-1α (17).
We used the fact that the ectopically expressed PGC-1α isoforms (Fig. 1G) are themselves the result of alternative splicing (3) to validate the ability of our system to detect alternative splicing events. The probe set signal for exon 2, the only region common to all the PGC-1α variants, was increased in all experimental conditions when compared with the GFP control (Fig. 1, G and H, arrowhead “b”). Only PGC-1α1 expression increased the probe set signal for all the exons along the PGC-1α gene (Fig. 1H), including unique exon 1a (Fig. 1, G and H, arrowhead “a”), whereas exons specific to the alternative PGC-1α isoforms (namely exon 1b in PGC-1α2 and PGC-1α4 and exon 1b′ in PGC-1α3) were not detected by the array (Fig. 1H). In the Geneview representation, we also observed the expression pattern characteristic to the specific C terminus of each alternative PGC-1α isoform (Fig. 1, G and H, arrowheads “c” and “d”). We validated the expression of each PGC-1α isoform by qRT-PCR using primer pairs specific to the different exon combinations (Fig. 1I). By probing exons 3–5, we detected PGC-1α transcripts with a conserved N terminus, namely PGC-1α1 and PGC-1α4 (Fig. 1I), and complementarily, when probing exons 3–8 we detected exclusively isoforms with disrupted activation and repression domains, PGC-1α2 and PGC-1α3 (Fig. 1I). Exogenous expression of PGC-1α isoforms resulted in mild changes in their endogenous levels. For example, PGC-1α2 expression decreases its own endogenous levels but increases PGC-1α3 (Fig. 1I). Additionally, endogenous PGC-1α2 was induced (50%) by PGC-1α1.
Analysis of Gene Networks under the Control of PGC-1α Isoforms
The workflow and thresholds established for the discrimination of differentially expressed genes and exons are described in detail under “Experimental Procedures” and summarized in Fig. 2A. For clarity, we use the term “gene” when referring to the identity of a particular gene and “transcript” when referring to a specific variant of a given gene. Each array probe set generates a signal specific for the 5′-UTR, exons, and the 3′-UTR of a single gene. Principal component analysis of the variance distribution indicated good clustering for all the data sets generated for the different PGC-1α isoforms (Fig. 2B). We detected significant changes in gene expression modulated by each of the different PGC-1α variants (cutoff of 1.2-fold change versus control GFP, p < 0.05) (Fig. 2C). Using Partek software, we identified 1279 annotated genes (from a total of 1592 regulated genes) modulated by PGC-1α1. Remarkably, we identified a similar number of genes targeted by PGC-1α2 (1638 annotated from a total of 1980) and PGC-1α3 (1279 genes annotated from a total of 1572). PGC-1α4 modulated the largest number of genes (2262 annotated from a total of 2606) (Fig. 2C). The discrepancy between these results and the previously published 3′ expression array data is likely due to the fact that exon-based arrays achieve higher sensitivity by providing a wider coverage of the transcriptome (1.2 million probe sets in Affymetrix Mouse Exon 1.0 ST array versus 45,000 probes in Affymetrix GeneChip Mouse Genome 430 2.0 array), probably reflecting the detection of a higher number of transcript variants of the targeted genes.
FIGURE 2.

Global gene expression analysis by exon arrays in myotubes expressing each PGC-1α isoform. A, workflow for the exon array gene/isoform expression, molecular pathway analysis, and alternative splicing determination. Splicing hits were double filtered in Partek (alt.splice attribute ≤0.0001) and EAA (−1 ≥ splicing index ≥ 1). B, principal component analysis (PCA) of the exon array data sets. C, heat map for PGC-1α isoform target gene expression in myotubes transduced plus number of differentially expressed genes (1.2-fold change, p < 0.05) by each PGC-1α isoform versus GFP. Red, induced; green, repressed. D, Venn diagram for gene regulation comparison between each PGC-1α isoform. The union area is divided into two subareas to indicate co-regulated versus contra-regulated genes.
Critical N-terminal motifs that fine-tune PGC-1α1 transcriptional activity (1) are spliced out in PGC-1α2, -α3, and -α4. To investigate how the inclusion or exclusion of these domains impacts the transcriptional activity of PGC-1α, we compared the gene sets regulated by each PGC-1α isoform. This analysis took into account whether genes regulated by different PGC-1α isoforms were activated or repressed by both variants (co-regulated) or activated by one but repressed by the other (contra-regulated). The highest number of co-regulated genes was found between isoforms PGC-1α1 and -α4 (650) and PGC-1α2 and -α3 (421) (Fig. 2D). Contrarily, PGC-1α2 and -α4 proved to contra-regulate the largest gene set (486) (Fig. 2D). However, even excluding co-/contra-regulated genes, we could still identify a large number of target genes specific to each PGC-1α isoform (i.e. PGC-1α1, 426; PGC-1α2, 729; PGC-1α3, 566; PGC-1α4, 1063 genes, respectively; data not shown).
PGC-1α2 and PGC-1α3, which lack part of the activation and repression domains (amino acids 107–274 of the canonical isoform), produce a distinct cluster from PGC-1α4, which in turn showed higher similarities with the genes targeted by PGC-1α1. This indicates that the transcriptional activity of the PGC-1α isoforms is dictated by the conservation of the N-terminal activation domain rather than the presence or absence of the RS/RRM motifs.
Identification of Gene Pathways Specifically Regulated by Each PGC-1α Isoform
To better understand which biological functions are associated with the transcriptional programs controlled by each PGC-1α isoform, we performed a comprehensive pathway and network analysis of each target gene set using the Ingenuity Pathway Analysis platform (Fig. 3A). We then validated by qRT-PCR selected genes from each of the identified pathways (Fig. 3, B–H).
FIGURE 3.

Target gene regulation by PGC-1α isoforms in myotubes. A, top pathways from the Ingenuity Pathway Analysis platform. Gray bars indicate scores for the same pathways from a previous data set (3). B–H, qRT-PCR validation for genes associated with the molecular pathways identified by IPA. Error bars represent S.D. *, p < 0.05 versus GFP, n.s., non-significant statistical differences versus GFP. TCA, tricarboxylic acid; BMP, bone morphogenetic protein; RA, rheumatoid arthritis; ARF, alternative reading frame; AMPK, AMP kinase; HIF-1α, hypoxia-inducible factor-1α.
Analysis of pathways regulated by PGC-1α1 in myotubes confirmed its well known involvement in transcriptional programs associated with mitochondrial biology (mitochondrial dysfunction, tricarboxylic acid cycle, acetyl-CoA biosynthesis, and branched-chain α-keto acid dehydrogenase complex) as well as the characteristic increase in oxidative metabolism (mitochondrial l-carnitine shuttle) (Fig. 3A). Among the genes that defined the pathways targeted by PGC-1α1, we validated by qRT-PCR previously known targets such as estrogen-related receptor α (Esrra), carnitine palmitoyltransferase 1b (Cpt1b), and cytochrome c (Cyc) (Fig. 3B). Some of these targets are also induced by PGC-1α4, although cytochrome c remains a unique target for PGC-1α1.
Among the PGC-1α isoforms, PGC-1α2 and PGC-1α3 share the highest sequence similarity, only differing in the first amino acids. Accordingly, PGC-1α2 and PGC-1α3 co-regulated ∼30% of their individual target genes. However, because of the difference in the magnitude of effects on each gene set, there was not much overlap between the pathways regulated by both isoforms.
Interestingly, genes regulated by PGC-1α2 in myotubes grouped largely under the cholesterol biosynthesis pathway (Fig. 3A). Based on this prediction, we next validated by qRT-PCR that PGC-1α2 expression leads to a significant reduction in the mRNA levels of several upstream genes of the superpathway of cholesterol biosynthesis such as methylsterol monooxygenase 1 (Msmo1) and NAD(P)-dependent steroid dehydrogenase-like (Nsdhl). Some other members of the cholesterol synthesis pathway showed a non-significant trend for reduced expression as is the case for 3-hydroxy-3-methylglutaryl-CoA synthase 1 (Hmgcs1) and the sterol-C5-desaturase (Sc5d) (Fig. 3C). Several genes involved in the regulation of inflammatory processes were also among the top scoring PGC-1α2-regulated pathways, including transforming growth factor β (TGF-β) signaling. In this case, a consistent up-regulation of the expression of Smad7, the intracellular antagonist of TGFβ2 in muscle growth and maintenance, was validated by qRT-PCR (Fig. 3D).
The pathways identified for PGC-1α3 were suggestive of development and cell cycle control. We validated the expression of targets involved in the epithelial adherens junction signaling pathway (Fig. 3A) and confirmed the reductions in mRNA levels of myosin heavy chain 7 (Myh7), myosin light chain (Myl2), and epidermal growth factor receptor (Egfr) plus a clear trend in the induction of brain-specific angiogenesis inhibitor 1-associated protein 2 (Baiap2) (Fig. 3E). Although the Ingenuity Pathway Analysis (IPA) nomenclature of several pathways tends to be very general, epithelial adherens junction signaling is also one of the top canonical pathways differentially regulated in both an integrative study of Duchenne muscle dystrophy in humans (20) and a comprehensive multilevel omics analysis in dystrophy-deficient mice (21).
By manual curation of each gene list, we found that the minichromosome maintenance family of genes (Mcm3–6) was consistently induced by both PGC-1α2 and PGC-1α3 (Fig. 3F). Proteins of the Mcm family configure the prereplication complex necessary for eukaryotic DNA replication (22). Contrarily, PGC-1α1 or PGC-1α4 expression reduced Mcm3–6 levels (statistically significant only in the case of PGC-1α1 but with a clear trend for PGC-1α4), an effect that has also been observed upon expression of PGC-1β (23). As shown in Fig. 2D, there are a significant number of genes contra-regulated by PGC-1α1 versus PGC-1α2 and -α3. In agreement, many PGC-1α1 target genes were either unchanged or slightly repressed by PGC-1α2 (Esrra, tricarboxylic acid cycle, and ATP synthesis genes). This analysis did not predict any major PGC-1α2 effects on genes related to energy metabolism or mitochondrial biogenesis/function (Fig. 3A).
PGC-1α4 regulates muscle mass and hypoxia-driven angiogenesis in skeletal muscle (3, 24). PGC-1α4 and the structurally related NT-PGC-1α (2) are able to induce Vegfa expression and an angiogenic program independently of hypoxia-inducible factor-1α (24). Interestingly, in addition to observing that PGC-1α4 was able to induce Vegfa expression under the tested conditions (Fig. 3G), our results suggested PGC-1α4 as a negative regulator of hypoxia-inducible factor-1α signaling. Indeed, several hypoxia-inducible factor-1α targets such as matrix metallopeptidase 15 (Mmp15) or prolyl hydroxylase domain-containing protein 2 (Phd2) showed reduced levels upon PGC-1α4 expression (Fig. 3G). Our results further identify new gene pathways under PGC-1α4 control in myotubes, including interleukin 17 (IL17) and p53 signaling. Of the suggested IL-17 signaling-associated genes targeted by PGC-1α4, we validated by qRT-PCR the increases in the expression of Mapk26 and the p85 member phosphoinositide 3-kinase regulatory subunit 1 (Pik3r1) and a reduction in the levels of prostaglandin-endoperoxidase synthase 2 (Ptgs2) (Fig. 3H).
Because PGC-1α isoforms seem to be differentially regulated not only at the transcriptional level (Fig. 1B) but also in terms of protein accumulation (Fig. 1D), we decided to validate target gene specificity upon increasing expression of each PGC-1α variant (Fig. 4A). This strategy resulted in greater accumulation of PGC-1α1, -α2, and -α3 but not of PGC-1α4 protein (Fig. 4B). Subsequently, we could observe that the expression levels of PGC-1α2 and PGC-1α3 target genes (e.g. Mcm3, Mcm4, and Mcm6) remained unaffected even in the presence of higher PGC-1α1 levels (Fig. 4C). This target gene specificity was also observed for genes that show reduced expression in the presence of PGC-1α2 and PGC-1α3 (e.g. Msmo1, Nsdhl, and Myl2) (Fig. 4C). The opposite is also true, and specific targets for PGC-1α1 and PGC-1α4 (e.g. Cyc and Vegfa) remained exclusive upon increased levels of PGC-1α2 and -α3 (Fig. 4C).
FIGURE 4.

Global analysis of alternative splicing in myotubes expressing PGC-1α isoforms. A, qRT-PCR analysis of total PGC-1α (exon 2) on myotubes transduced with increasing virus titer (+, single titer; ++, double titer). Error bars represent S.D. B, protein levels of distinct PGC-1α variants upon increasing virus titer plus quantification (ImageLab) normalized by the lower titer in each experiment. Error bars represent S.E. *, p < 0.05 versus titer ×1. C, qRT-PCR analysis of target gene specificity for the different PGC-1α isoforms upon increasing protein expression (+, single titer; ++, double titer). Error bars represent S.D. *, p < 0.05 versus GFP. D, extracellular flux analysis (Seahorse) of myotubes expressing each PGC-1α isoform in medium supplemented with 1 mm pyruvate. Error bars represent S.D. *, p < 0.05 versus GFP control. E, extracellular flux analysis of myotubes expressing each PGC-1α isoform on medium supplemented with 5 mm glucose. Error bars represent S.D. F, left, number of differentially spliced genes between GFP control and each PGC-1α isoform. Right, number of differentially spliced genes between PGC-1α isoforms. G, left, number of differentially expressed exons between GFP control and each PGC-1α isoform. Right, number of differentially expressed exons between PGC-1α isoforms. H, splicing events categorization by AltAnalyze: Alt3′, alternative 3′ splicing; Alt5′, alternative 5′ splicing; Alt C-ter, alternative C-terminal splicing; Alt N-ter, alternative N-terminal splicing; Alt prom, alternative promoter. FCCP, carbonyl cyanide-4-(trifluoromethoxy)phenylhydrazone; OCR, oxygen consumption rate.
Global Analysis of Target Transcript Structure Reveals Novel Gene Networks Regulated by PGC-1α Isoforms
To understand whether our results are fundamentally different from the previously published PGC-1α variant target gene data (3), we compared both gene sets. To this end, we reanalyzed our data side by side with the previously published 3′ gene array (3) to compare the top 10 IPA gene pathways identified for each PGC-1α isoform (Fig. 3A). Both gene expression analysis strategies were equally efficient in the identification of PGC-1α1-regulated genes, which were also the most similar when compared with the other isoforms. Accordingly, the top 10 canonical pathways and functions for PGC-1α1 obtained with the exon array matched strongly with those obtained for the previously published 3′ array (3) (Fig. 3A). However, this was not true for the other PGC-1α isoforms, in particular for PGC-1α2 and -α3. Of note, canonical pathways with stronger statistical significance (i.e. higher −log(p value)) were more reproducible through different arrays as is the case of isoforms of PGC-1α1. Remarkably, although the previous Affymetrix gene array (3) reported a small number of genes targeted by PGC-1α2 and PGC-1α3 (under 100), our current strategy identified well over 1000 genes regulated by either coactivator (Fig. 2C). The most prominent functions associated with PGC-1α4 in the previous study were energy production, lipid metabolism, and skeletal muscle development. However, the top canonical pathways we found in the present study are represented by several molecules related to cell proliferation and survival (p53, cyclin D1, and several MAPKs) and the inflammatory response (IL-17 receptors, prostaglandin-endoperoxide synthase 2, and interleukin 6) that were annotated under the names IL-17 signaling, colorectal cancer signaling, hypoxia-inducible factor-1α signaling, pancreatic adenocarcinoma signaling, and p53 signaling. In this case and despite the significant number of PGC-1α4 target genes identified with both gene expression profiling strategies, we did not observe a significant overlap between them. Our results indicate that the use of gene expression profiling with exon level resolution was necessary to uncover several new pathways under PGC-1α control. This was particularly important to identify targets for the non-canonical PGC-1α variants.
Expression of PGC-1α Isoforms Modulates Oxygen Consumption Rates in Primary Muscle Cells
Because our analysis of PGC-1α isoform target genes indicated effects on several important biochemical pathways (Fig. 3A), we next evaluated their impact on cellular respiration by performing extracellular flux analysis. This allowed us to measure the oxygen consumption rate in real time on intact myotubes transduced with each PGC-1α variant. We observed that when using 1 mm pyruvate as energy substrate all PGC-1α isoforms significantly increased (40–60%) the basal oxygen consumption rate of cultured myotubes (Fig. 4D). Treatment with the ATP synthase inhibitor oligomycin revealed that all PGC-1α-expressing cultures displayed a higher fraction of respiration coupled to ATP production compared with controls (Fig. 4D). However, upon addition of the uncoupling ionophore carbonyl cyanide-4-(trifluoromethoxy)phenylhydrazone, myotubes expressing PGC-1α1, PGC-1α2, and PGC-1α3 showed higher maximal respiratory capacity compared with PGC-1α4 and GFP, although only PGC-1α2 and PGC-1α3 showed significant statistical differences (Fig. 4D). When the medium was supplemented with 5 mm glucose, we observed no significant changes in the oxygen consumption rate of the cultured myotubes (Fig. 4E). Together with the gene expression data, these results indicate that the different PGC-1α variants can affect cellular metabolism through distinct mechanisms.
Expression of Each PGC-1α Isoform in Myotubes Selectively Changes the Splicing Landscape of the Cell
Our results clearly show that several PGC-1α target genes are only revealed when taking into consideration the exon composition of the target transcript. This indicates that coactivation by different PGC-1α proteins affects target gene splicing. Furthermore, PGC-1α2, -α3, and -α4 lack the C-terminal RS/RRM domains present in PGC-1α1, which could help explain why their target gene sets are the most different when comparing our results with the previously published array (3). Our next aim was therefore to investigate how these domains affect the expression of specific target gene variants. To identify and visualize alternative splicing events under the control of the different PGC-1α variants, we analyzed our exon array data using two complementary software platforms as indicated in Fig. 2A. Only splicing hits recognized by both platforms were further considered. Probably due to the elevated mRNA levels of ectopically expressed PGC-1α variants, Ppargc1a was identified as the gene with the highest splicing score (Partek; alt.splice p value = 0). In addition, when we compared the PGC-1α mRNA profiles in PGC-1α1- and -α4-expressing myotubes, Exon Array Analyzer (EAA) indicated high probability for 5′ splicing (splicing index = 2). When comparing the transcript structure of PGC-1α2 or PGC-1α3 with PGC-1α4, we could identify several splicing events classified as uncategorized. This is most likely due to the incomplete annotation of these transcripts in the available databases.
Each of the 10 possible comparisons between PGC-1α isoforms or controls yielded a substantial number of differentially spliced genes and expressed exons (Fig. 4, F and G). In fact, expressing either PGC-1α variant in myotubes changes the splicing pattern of over 100 genes when compared with controls. This number does not change much when comparing splicing events under PGC-1α1 control versus those regulated by PGC-1α4 (177) and PGC-1α2 versus PGC-1α3 (180). In addition, it is interesting that the number of “alternatively spliced genes” (Fig. 4F) and “differentially expressed exons” (Fig. 4G) between PGC-1α1 versus PGC-1α4 and PGC-1α2 versus PGC-1α3 was almost the same. This suggests that for almost all the alternatively spliced genes within those specific comparisons the resulting isoforms will mainly diverge in one differentially expressed exon. However, for all the other comparisons, especially for PGC-1α2 versus PGC-1α4, the ratio was close to 1.5, indicating larger differences in target transcript structure, which in some cases will diverge in more than one exon. Similar to what we observed on the gene level analysis, we found larger differences in target gene splicing events when comparing the exon expression profile controlled by PGC-1α2 or PGC-1α3 versus PGC-1α4 (967 and 550, respectively). Because several of these events can map to the same gene, the number of alternatively spliced genes was lower than that of differentially expressed exons, although both have the same overall distribution profile (Fig. 4, F and G).
We next systematically categorized the splicing events under the control of each PGC-1α variant (please see “Isoform Level Analysis” under “Experimental Procedures”). Fig. 4C summarizes the eight most representative events found for each comparison. Despite the large differences in differentially expressed exons observed between groups, the relative frequency of the categorized events did not change in any of the situations compared. The most common splicing events observed in all groups were those of “cassette exon” (27–36%), “alternative C-terminal,” and “bleeding exon” (both 14–18%) (Fig. 4H).
PGC-1α2 and -α3 Promote Expression of a Truncated Ddx27 Form with an Alternative 3′-UTR
Ddx27, a member of the DEAD box family of putative RNA helicases related to ribosome and spliceosome assembly, showed a highly significant splicing probability in both Partek and EAA platforms. We located the existence of a discrete splicing event on Ddx27 for a unique probe set when PGC-1α2 or PGC-1α3 was expressed (Fig. 5A). Analysis of the Ddx27 transcripts annotated on Ensembl indicated that the differentially expressed exon maps to an alternative 3′-UTR found in isoform Ddx27-002 (ENSMUST00000150571, 292 amino acids) (Fig. 5B). To confirm these splicing events, we performed qRT-PCR validation using oligonucleotides specific for constitutive and alternative exons (see Table 1).
FIGURE 5.

Alternative splicing of Ddx27 and Ndrg4 induced by distinct PGC-1α isoforms. A, Ddx27 exon array probe set signal intensity. *, differentially expressed exon. B, graphic representation of the mRNA structure of Ddx27 isoforms indicating exons of interest. e8, constitutive exon 8; e8b, alternative exon 8b, Alt 3′-UTR, alternative 3′-UTR); e9, exon9. C, qRT-PCR analysis of specific Ddx27 isoform expression in myotubes expressing each PGC-1α isoform. Error bars represent S.D. *, p < 0.05 versus GFP. D, Ndrg4 exon array probe set signal intensity. *, alternative promoter. E, graphic representation of Ndrg4 isoform mRNA structure indicating exons of interest: e1, constitutive exon 1; e1b, alternative exon 1b; Alt 5′, alternative 5′-UTR; e2–e4, exons 2–4. F, specific Ndrg4 isoform expression in myotubes expressing each PGC-1α isoform was analyzed by qRT-PCR. Error bars represent S.D. *, p < 0.05 versus GFP.
TABLE 1.
Primers used for detection of gene expression by qRT-PCR
| Forward | Reverse | |
|---|---|---|
| PGC-1α isoforms | ||
| Total PGC-1α (exon 2) | TGATGTGAATGACTTGGATACAGACA | GCTCATTGTTGTACTGGTTGGATATG |
| PGC-1α1 | GGACATGTGCAGCCAAGACTCT | CACTTCAATCCACCCAGAAAGCT |
| PGC-1α2 | CCACCAGAATGAGTGACATGGA | GTTCAGCAAGATCTGGGCAAA |
| PGC-1α3 | AAGTGAGTAACCGGAGGCATTC | TTCAGGAAGATCTGGGCAAAGA |
| PGC-1α4 | TCACACCAAACCCACAGAAA | CTGGAAGATATGGCACAT |
| Exons 3–5 | AGCCGTGACCACTGACAACGAG | GCTGCATGGTTCTGAGTGCTAAG |
| Exons 3–8 | AAGACGGATTGCCCTCATTTG | GCTTTGGCGAAGCCTTGAA |
| Gene validation | ||
| Baiap2 | AGAACTCTGCTGCTTACCATTC | TTGCTTTGAGACCCCACAAAT |
| Cpt1b | GCACACCAGGCAGTAGCTTT | CAGGAGTTGATTCCAGACAGGTA |
| Cyc | ACAAGAAGACTCAAATGTGTTTCAGTTT | TGCACTGTCAAGAATAGACAGTTGC |
| Egfr | GCCATCTGGGCCAAAGATACC | GTCTTCGCATGAATAGGCCAAT |
| Esrra | GGGGAGCATCGAGTACAGC | AGACGCACACCCTCCTTGA |
| Hmgcs1 | AACTGGTGCAGAAATCTCTAGC | GGTTGAATAGCTCAGAACTAGCC |
| Map2k6 | ATGTCTCAGTCGAAAGGCAAG | TTGGAGTCTAAATCCCGAGGC |
| Mapkapk2 | TTCCCCCAGTTCCACGTCA | GCAGCACCTTCCCGTTGAT |
| Mcm3 | AGCGCAGAGAGACTACTTGGA | CAGCCGATACTGGTTGTCACT |
| Mcm4 | GAGGAAAGCAGGTCGTCACC | AGGGCTGGAAAACAAGGCATT |
| Mcm5 | CAGAGGCGATTCAAGGAGTTC | CGATCCAGTATTCACCCAGGT |
| Mcm6 | ACCAACCCAAGGTTTGGAGG | TAATGCTCTCAGCGGTCTGTT |
| Mmp15 | GGCAACTTCGACACAGTGG | AGCCAGTAGCGGTTACCTTTG |
| Msmo1 | AAACAAAAGTGTTGGCGTGTTC | AAGCATTCTTAAAGGGCTCCTG |
| Myh7 | ACTGTCAACACTAAGAGGGTCA | TTGGATGATTTGATCTTCCAGGG |
| Myl2 | ATCGACAAGAATGACCTAAGGGA | ATTTTTCACGTTCACTCGTCCT |
| Nsdhl | TCATGGTGAATCAAAGCGAGG | CCGGGGGTTATCAAAGCCTTG |
| Phd2 | TTGTTACCCAGGCAACGGAAC | CCTTGGCGTCCCAGTCTTT |
| Pik3r1 | AAACTCCGAGACACTGCTGA | AGACTCATTCCGGTAGTGGT |
| Ptgs2 | TGAGCAACTATTCCAAACCAGC | GCACGTAGTCTTCGATCACTATC |
| Sc5d | TCTCAGTGCCGCCGATTACTA | CTTGACAGTGAACACGATCTCA |
| Smad7 | GGCCGGATCTCAGGCATTC | TTGGGTATCTGGAGTAAGGAGG |
| Src-1 | GGACCCAGGTACTGAGAACCA | GGAGGCCGAGGTAATCGTC |
| Vegfa | GCACATAGGAGAGATGAGCTTCC | CTCCGCTCTGAACAAGGCT |
| Vegfd | TTGAGCGATCATCCCGGTC | GCGTGAGTCCATACTGGCAAG |
| Splicing validation | ||
| Ddx27, probe 1 | CGTCTTGGAGCGTCTGATCT | GAAGAGCGGCTTCCTGAGCATT |
| Ddx27, probe 2 | TGCAGGCCCTTAATTCCATCACT | TACATAATACAGCTCCTCTGCCGTG |
| Ndrg4, probe 1 | ATGAAGGTGCTGGGACACA | AGCAGGGGCTTCTCCTCAG |
| Ndrg4, probe 2 | TACCTCCAGACCGAGTGACTCAG | GGCGTCTCGATGTCATGTTC |
| Osbpl1a, probe 1 | CACAAACAAGTGGTCGAGGA | GCTCCTTTCGTCCTGTGAAG |
| Osbpl1a, probe 2 | TGCTTTGATGACACTGTTCACT | AGTTCTGGGAAAGACAGAAGTCG |
| Osbpl1a, probe 3 | GAGTGTGATGTGGCCAAAGA | GACAGTCATTCAACGCCACA |
| Osbpl1a, probe 4 | ACTTAGGGAGACCTTGCGGTA | GCACGCTTCAGCACAGATG |
| Osbpl1a, probe 5 | CAGAGAAGTCAAGGTGTTTGC | GTACCAGATGCCTTGCCCTA |
To analyze Ddx27 isoform expression, we targeted constitutive exons 8 and 9 for the detection of canonical full-length isoform Ddx27-001 (ENSMUST00000018143, 760 amino acids) and alternative exon 8b for the detection of isoform Ddx27-002. As expected, the relative levels of Ddx27-001 proved to be independent of PGC-1α variant expression (Fig. 5C). However, myotubes expressing PGC-1α2 or PGC-1α3 had higher levels of the Ddx27-002 isoform, which contains the alternative 3′-UTR (Fig. 5C) and a premature stop codon. For this reason, Ddx27-002 lacks the C-terminal helicase domain, which likely impacts protein functionality.
PGC-1α1 and -α4 Induce a Shift toward Alternative Promoter Usage and 5′-UTR Isoforms
Ndrg4, a cytoplasmic protein from the α/β-hydrolase superfamily that has been shown to regulate cancer progression (25) and cardiac development in zebrafish (26), showed one of the highest probabilities for alternative splicing on Partek (Fig. 5D). Interestingly, the expression of PGC-1α1 or PGC-1α4 resulted in the clear induction of Ndrg4 variants expressed from an internal gene promoter (27). The specific promoter usage was confirmed by qRT-PCR amplification of the 5′-UTR and coding sequence of exon 1, unique to isoforms Ndrg4-001 and Ndrg4-002 (Fig. 5F). In the brain, activation of an upstream promoter produces the longer isoform Ndrg4-003 (27) (404 amino acids) that contains a distinct N terminus (Fig. 5E). In contrast to the internal gene promoter, the Ndrg4 upstream promoter was not responsive to the expression of any PGC-1α variants in myotubes. In line with this, we observed no differences between conditions when targeting regions specific for Ndrg4-003 (constitutive exons 1 and 2) (Fig. 5F). Ndrg4-002 (339 amino acids) differs from the canonical Ndrg4-001 (352 amino acids) in that the terminal exon 14 is spliced out, producing an isoform with a shorter C terminus. Because exon 14 is present in both Ndrg4-001 and Ndrg4-003, we cannot determine by transcript analysis which specific isoform (Ndrg4-001 or Ndrg4-002) is induced upon PGC-1α1 and -α4 expression.
Osbpl1a is a member of the oxysterol-binding protein family that acts as intracellular lipid receptor (28). This gene showed one of the highest scores for alternative splicing on Partek analysis (Fig. 6A). We mapped two specific alternative splicing sites on Obspl1a transcript that matched with alternative 3′-UTR (Fig. 6B, probe 2) and alternative promoter usage (Fig. 6B, probe 4), respectively. Accordingly, by qRT-PCR analysis, we confirmed that PGC-1α1 and -α4 induced the expression of an Osbpl1a isoform derived from a previously described internal alternative promoter between exons 15 and 16 of the canonical variant (28). Besides the distinct exon 1b, isoforms spawning from this internal promoter share the rest of the sequence with the canonical Osbpl1a-001 and produce smaller C-terminal protein variants (Ensembl Osbpl1a-003, -004, -005, -007, and -017). Thus, two separate probes, one for the internal 5′-UTR (Fig. 6C, probe 4) and another for the constitutive exon 28 from the 3′-end of the Osbpl1a transcripts (Fig. 6C, probe 5), showed a 3–4-fold induction compared with the GFP control.
FIGURE 6.
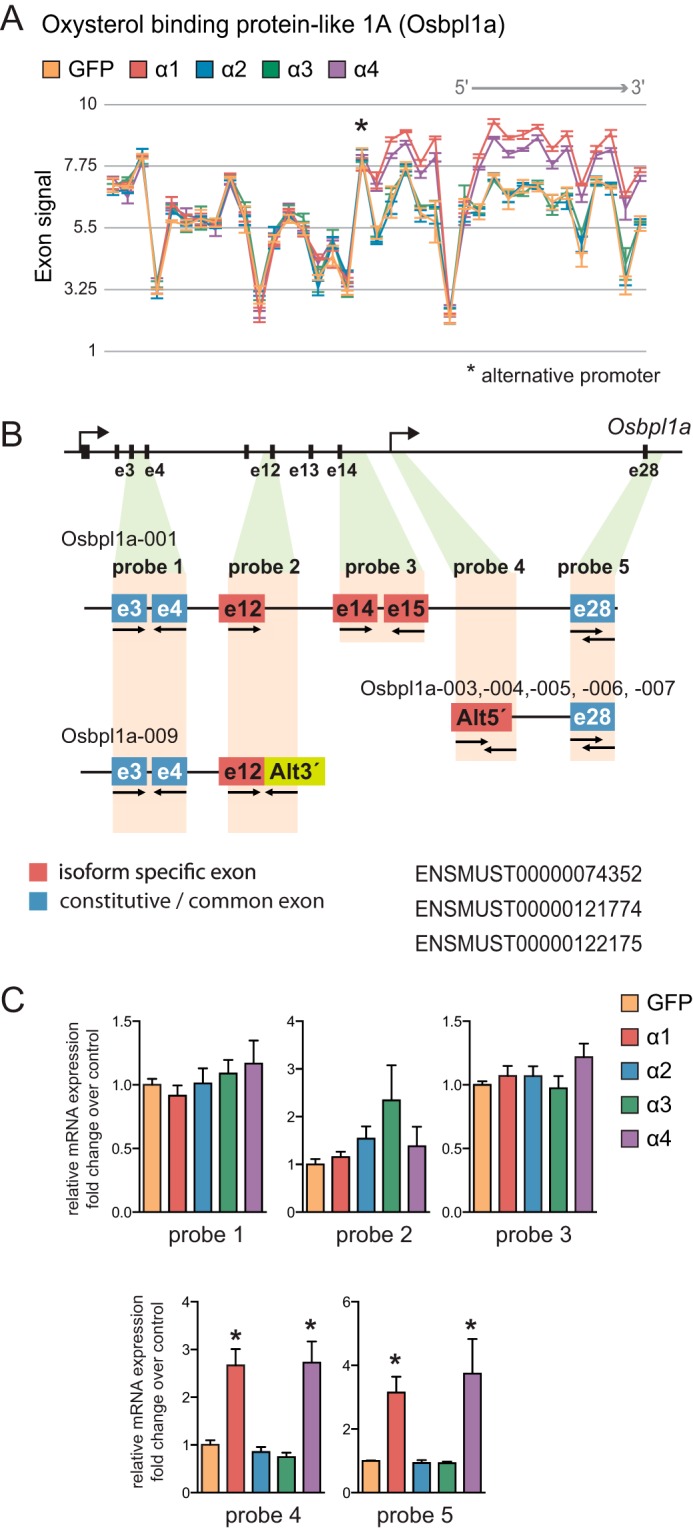
Regulation of Osbpl1a alternative promoter usage by distinct PGC-1α isoforms. A, Osbpl1a exon array probe set signal intensity. *, alternative promoter. B, graphic representation of the mRNA structure of Osbpl1a isoforms: e, exon; Alt3′, alternative 3′-UTR; Alt5′, alternative 5′-UTR. C, qRT-PCR analysis of specific Osbpl1a isoform expression in myotubes expressing each PGC-1α isoform. Error bars represent S.D. *, p < 0.05 versus GFP.
Analysis of the exon array indicated with high probability that PGC-1α2 and -α3 could induce the expression of an alternative Osbpl1a isoform with a distinct 3′-UTR due to a premature stop codon in exon 12 that matched with features from isoform Osbpl1a-009. However, qRT-PCR analysis did not show statistical significance for that specific splicing event (Fig. 6C, probe 2). We observed no additional differences between conditions when detecting a constitutive exon common to all isoforms containing the canonical N terminus (Fig. 6C, probe 1) or when probing for exons specific to the canonical full-length Osbpl1a-001 isoform (Fig. 6C, probe 3).
PGC-1α1 and PGC-1α4 Induce Specific Promoter Usage of Target Genes in Vivo
Next, we wanted to validate in vivo some of the splicing events we saw in vitro. For that we have used two available muscle-specific transgenic mouse lines, one for canonical PGC-1α1 (7) and another for alternative PGC-1α4 (3), which was backcrossed to a C57BL/6 background. Upon analysis by qRT-PCR of Osbpl1a isoform expression in the different skeletal muscle samples (gastrocnemius), we observed that both PGC-1α variants induce the expression of the short Osbpl1a isoforms transcribed from the internal promoter (Fig. 7B) when compared with wild type littermates. This is shown by a 3–4-fold increase in the mRNA levels of Osbpl1a transcripts containing the alternative 5′-UTR or exons that code for the C-terminal end of the protein. No changes were observed when probing for sequences exclusive to the full-length Osbpl1a-001 isoform (Fig. 7, A and B). Changes in gene expression were confirmed at the protein level in both transgenic models with a clear induction of the 50-kDa short C-terminal isoform of Osbpl1a (Fig. 7, A and B).
FIGURE 7.

Analysis of Ndrg4 and Osbpl1a alternative promoter usage in skeletal muscle of PGC-1α1 or PGC-1α4 transgenic mice. A and B, qRT-PCR and protein immunoblotting analysis of distinct Osbpl1a isoform expression in gastrocnemius from PGC-1α1 (A) or PGC-1α4 (B) skeletal muscle-specific transgenic mice. C and D, qRT-PCR and protein immunoblotting analysis of distinct Ndrg4 isoform expression in gastrocnemius from PGC-1α1 (C) or PGC-1α4 (D) skeletal muscle-specific transgenic mice (Mck-PGC-1α1 (6) and Myo-PGC-1α4 (4)). E, proposed model for alternative promoter usage upon induction of specific PGC-1α isoforms. In all panels, error bars represent S.E. *, p < 0.05 versus WT; n.s., nonsignificant. Pol, polymerase; Alt5′, alternative 5′-UTR.
A similar approach was used to validate Ndrg4 isoform expression in skeletal muscle from muscle creatine kinase promoter-PGC-1α1 (Mck-PGC-1α1) and myogenin promoter-PGC-1α4 (Myo-PGC-1α4) mice. The specific expression of PGC-1α1 in skeletal muscle prompted a 60% increase on the mRNA levels of Ndrg4 isoforms derived from the internal gene promoter, whereas no changes were observed for distal promoter-derived Ndrg4-003 (Fig. 7C). However, in PGC-1α4 skeletal muscle-specific transgenic mice, we observed an induction of similar amplitude (3–4-fold) for all the Ndrg4 isoforms regardless of the promoter of origin.
When we assessed Ndrg4 protein levels, we observed that, contrarily to what occurs for transcript levels, the protein content of Ndrg4 short isoforms in Mck-PGC-1α1 and Myo-PGC-1α4 muscles is reduced. Because the transcript levels of Ndrg4-003 are very low compared with those of Ndrg4-001 and -002 and only a unique band appeared in the immunoblot that matches the expected size, we assumed it corresponded to one of the short Ndrg4 isoforms. Although all three Ndrg4 isoforms can be detected by immunoblotting in vitro (data not shown), only one variant could be detected in vivo in agreement with previous observations (29).
Discussion
To date, more than eight alternative PGC-1α isoforms have been described in skeletal muscle (4). Of these, several are transcribed from an alternative gene promoter, including PGC-1α2, PGC-1α3, and PGC-1α4. PGC-1α transcription is tightly regulated and dependent on specific stimuli. Here, we show that administration of clenbuterol to mice induces not only PGC-1α4 expression in skeletal muscle (3) but also PGC-1α2 and PGC-1α3 while reducing the levels of canonical promoter-derived PGC-1α1 (Fig. 1B). In addition to their distinct transcriptional regulation, PGC-1α proteins accumulate at different levels (3, 30) (Fig. 1D). We have observed that changes in the sequence of PGC-1α isoforms alter protein degradation dynamics and confer increased stability to some of the alternative PGC-1α variants. Finally, we demonstrate that alternative PGC-1α isoforms regulate the expression of large gene networks and can, in addition, shift the splicing pattern of target genes. These findings add additional nodes to the already complex regulatory network controlled by the PGC-1α system.
Several biological functions have been already attributed to non-canonical PGC-1α isoforms in skeletal muscle (24, 31). However, until now, not enough data were available to identify and characterize the gene networks under the control of PGC-1α2 and -α3. By using a high resolution splicing array, we could identify several target genes for these isoforms.
Interestingly, among the PGC-1α variants analyzed, PGC-1α1 proved to regulate gene networks in the most coordinated fashion, i.e. with the highest number of target genes within each pathway. The conservation of nuclear receptor interaction and/or regulatory sites located in the N-terminal part of the protein might explain the differences in transcriptional activity of the non-canonical PGC-1α variants as seen also in NT-PGC-1α (2), a PGC-1α isoform structurally related to PGC-1α4 (4). Like PGC-1α1, NT-PGC-1α can physically interact with PPARα and PPARγ. However, its coactivator function is greatly dependent on PPAR ligands because NT-PGC-1α lacks the ligand-independent nuclear receptor activation domain (338–403 amino acids) functional in PGC-1α1 (2).
Of note, a significant number of PGC-1α1 target genes are contra-regulated by PGC-1α2 and PGC-1α3 (i.e. repressed instead of induced or vice versa). We could only predict clear effects on energy metabolism pathways when performing network analysis on classical PGC-1α1 (Fig. 3A). However, when measuring oxygen consumption rates in cell culture, we observed that myotubes expressing PGC-1α2 and PGC-1α3 behave similarly to those expressing PGC-1α1 by displaying enhanced pyruvate mitochondrial respiration. From our gene and network analysis, it is unlikely that PGC-1α2 or -α3 regulates mitochondrial biogenesis. We therefore speculate that the mechanism by which those isoforms elicit these effects might include coordinated splicing of genes involved in pyruvate metabolism. Effects on oxidative metabolism have been described for other PGC-1α alternative isoforms such as NT-PGC-1α (32) and PGC-1α-b (31, 33).
Although originating from the same promoter and upon identical stimuli, the alternative PGC-1α isoforms regulate different transcriptional programs. This is not surprising considering the differences in protein sequence and structure among these variants. For example, PGC-1α2 and -α3 lack amino acids 120–284 of PGC-1α1 that seem to be necessary for PGC-1α to interact with PPARα (34). This might explain in part the relative clustering in target gene regulation we observed for PGC-1α1 and PGC-1α4 versus PGC-1α2 and PGC-1α3. Indeed, the ability to bind specific transcriptional partners can probably define the biological activity of the different PGC-1α coactivators. This particular functional clustering of the PGC-1α isoforms was also found when assessing their potential role as transcriptional repressors. Although PGC-1α1 has always been considered as a direct positive regulator of gene expression, it has been shown recently that its partnership with heat shock factor 1 can result in repression of target gene expression (35). When analyzing our exon array data set to determine whether other PGC-1α variants can reproduce the effects of PGC-1α1 on heat shock factor 1 target gene regulation in skeletal muscle (35), we found that the expression of either PGC-1α1 or PGC-1α4 in primary myotubes produced equivalent reductions in heat shock factor 1 target genes expression levels, whereas PGC-1α2 and -α3 had only minimal effects.
Indeed, some similarities can also be seen when comparing the gene programs triggered by PGC-1α2 and -α3. These variants are the closest related PGC-1α isoforms, their sequence being completely homologous save for the first amino acid, and interestingly the inclusion of exon 1b′ (PGC-1α3) instead of exon 1b (PGC-1α2) seems to affect the basal protein accumulation (Fig. 1D). Other groups have shown that alternative PGC-1α isoforms that only differ in exon 1 (namely PGC-1α-a and PGC-1α-b) can elicit similar biological responses (33). However, the induction of endogenous PGC-1α3 seen when ectopic PGC-1α2 is expressed (Fig. 1I) might influence their overall transcriptional activity and bring their respective gene programs closer. Both PGC-1α2 and PGC-1α3 induce the expression of Mcm3–6, known markers of proliferation (36). Although our results were obtained in fully differentiated myotubes, this could indicate a potential positive role on muscle regeneration and growth. Interestingly, PGC-1α homolog PGC-1β represses Mcm expression and prevents proliferation of vascular smooth cells (23). Of note and contrary to PGC-1α2 and -α3, PGC-1α1 and -α4 repress the expression of several members of the Mcm family (Fig. 3F).
Despite their similarities, PGC-1α2 still has unique target genes that are not shared with PGC-1α3. The overall regulation of genes targeted by PGC-1α2 suggests a consistent decrease in cholesterol synthesis that might indicate a negative effect on skeletal muscle differentiation (37, 38). Other signals that advocate for a role in myogenesis and muscle recovery include the specific PGC-1α2 induction of the intracellular antagonist of TGF-β, Smad7 (39) (Fig. 3D), an event that might cooperate with the effects of PGC-1α4 on skeletal muscle growth and maintenance after resistance training. PGC-1α3 seems to also exert functions in cell cycle control, proliferation, and tissue remodeling as seen in the regulation of the epithelial adherens junction pathway.
In any case, because the distinct PGC-1α isoforms accumulate to distinct levels under different conditions, concern about target gene specificity could be raised. However, the patterns of target gene expression observed upon incremental dosage of each PGC-1α variant argue against it (Fig. 4C). In addition, if we consider, for example, isoforms PGC-1α2 and PGC-1α3 (the most similar proteins that only differ in the first few amino acids), if the target gene differences were due to the different protein levels the prediction would be that the PGC-1α2 gene set would be included in the PGC-1α3 gene set. However, we see that of the 1622 genes regulated by PGC-1α2 only 437 are shared with the more abundant PGC-1α3. The same can be observed for any other comparison.
It has been previously shown that PGC-1α4 expression in skeletal muscle promotes muscle hypertrophy (3) and angiogenesis (24). In addition, here we show that PGC-1α4 can activate several gene programs related to cancer signaling.
Our initial working hypothesis was that differences in PGC-1α isoform sequences might have an impact on splicing regulation and that conservation of the RS/RRM C-terminal domains would determine the splicing patterns of target genes (8). However, our results indicate that most distinct splicing patterns are produced by PGC-1α isoforms that differ in their N termini. PGC-1α4 expression in myotubes produces splicing patterns that are remarkably similar to those generated by PGC-1α1. In addition, these contrast strongly with the splicing patterns seen upon PGC-1α2 and PGC-1α3 expression (Fig. 4F). Thus, the conservation of the activation domain might have a greater impact on defining both the gene programs and the splicing options made during transcript maturation.
The fact that different PGC-1α variants have specific effects on target gene expression and splicing greatly enhances our understanding of how these coactivators promote different biological functions. For example, although changes in brain Ndrg4 isoform expression have been reported previously (27), no mechanism for this shift has been proposed. Our results show that PGC-1α1 and -α4 have the specific ability to induce a shift in Ndrg4 expression that favors isoform 001 and/or 002 instead of 003. This expression pattern seems to mimic what is observed during brain development where Ndrg4 isoforms from the upstream promoter (e.g. Ndrg4-003) peak during embryonic development but disappear at 6 weeks of age (29). Although the regulation of Ndrg4 isoform expression was similar in vitro and in vivo, additional regulation might affect Ndrg4 protein stability and explain the differences between transcript and protein regulation observed in the transgenic models.
PGC-1α1 and PGC-1α4 induce the expression of a short C-terminal isoform of Osbpl1a from an internal gene promoter both in vitro and in vivo (Fig. 7E). This isoform, coined ORP1S, retains the oxysterol binding domain and promotes trafficking of oxysterols from the cytoplasm to the nucleus where the cholesterol metabolites can act as ligands for the liver X receptor (40) and activate gene expression. Conversely, ORP1L, the full-length canonical isoform of Osbpl1a that is not induced by PGC-1α1 or -α4, works as a cholesterol sensor that determines late endosome positioning (41) and might have a lesser effect on gene regulation. This suggests that PGC-1α isoforms might play a role in liver X receptor transcriptional activity fine-tuning by altering ligand delivery.
The precise mechanisms by which coactivators regulate co-transcriptional splicing are still not completely understood. From the two co-existing models, studies on PGC-1α1 and Med23 (12) support the recruitment model in which splicing factors are recruited to the preinitiation complex to assist in the maturation of the transcript. The recruitment model relies on a central role of RNA polymerase II CTD in recruiting splicing factors while still loaded on a distinct promoter (43). The identity of the factors docked on the RNA polymerase II CTD will determine the nature of the resulting splicing. It has been shown that the RS/RRM domains are not needed for PGC-1α to interact with the preinitiation complex (44). Accordingly, our results also support the recruitment model (40) in which nuclear receptors and/or cofactors will dictate its association with certain promoters and help in the recruitment of splicing factors to the preinitiation complex. This association would as well be independent of the CTD and rely on conservation of the activation domain. The specific association of PGC-1α1 with other members of the family might ultimately define the gene programs initiated.
In light of our results, we conclude that regulation of transcriptional networks by the PGC-1α system is more complex than initially thought. We show that the identification of PGC-1α isoform target genes is greatly facilitated by taking into account the exon structure of the corresponding transcripts. This work provides a new framework for our understanding of how PGC-1α coactivators mediate skeletal muscle adaptations to exercise.
Experimental Procedures
Cell Culture and PGC-1α Isoform Expression
Mouse primary myoblasts were isolated as described previously (45). During the growth phase, myoblasts were plated in collagen-coated plates and maintained in Ham's F-10 nutrient mixture (Gibco), 20% FBS (Sigma), 1% penicillin/streptomycin (Gibco), and 2.5 ng/ml basic fibroblast growth factor (Gibco). After achieving 90% confluence, cells were changed to differentiation medium consisting of DMEM high glucose with pyruvate (Gibco), 5% horse serum (Gibco), and 1% penicillin/streptomycin. Upon myotube formation (48 h after induction of differentiation), we expressed GFP alone or GFP and one of the four PGC-1α isoforms via adenoviral vectors at a multiplicity of infection of 100. GFP and PGC-1α isoforms are expressed from independent promoters, and the adenoviruses expressing the different mouse PGC1α isoforms or GFP have been described previously (3). Twelve hours after transduction, medium was replaced with fresh differentiation medium. Approximately 60 h post-transduction, cells were harvested in Isol-RNA lysis reagent (5PRIME) and purified with Nucleospin® RNA II columns (Macherey-Nagel) according to the manufacturers' instructions to achieve optimal purity levels. Experiments were performed at least in triplicate using three replicates per condition.
Microarray Procedures
For global analysis of gene expression, we used the Affymetrix GeneChip Mouse Exon 1.0 ST array (46). Gene expression profiling experiments were performed at the Bioinformatics and Gene Expression Analysis core facility of the Karolinska Institutet. All data sets were filtered through quality control steps and normalized using the robust multianalysis method for background correction.
Gene Level Analysis
Differential gene expression was determined by separately comparing the summarized probe set intensity for genes regulated by each PGC-1α isoform versus the control condition (GFP). Differences in gene expression were calculated with a two-sided unpaired t test assuming equal variance and applying a cutoff of 1.2-fold change and a p value <0.05. Qlucore Omics Explorer was used to perform hierarchical clustering analysis and to generate gene regulation heat maps. We used the Venn diagram generator (VENNY) (42) for the graphical representation of different sets of data comparison.
Pathway Analysis
We performed comprehensive pathway and network analysis for gene expression by using the IPA platform. IPA output was filtered to include only functions and pathways experimentally validated in skeletal muscle. The top 10 significant pathways (p < 0.05) were considered for subsequent qRT-PCR validation of target genes.
Isoform Level Analysis
To identify and characterize splicing events promoted by the different PGC-1α variants, data sets were paired for all the possible comparisons. Splicing hits were then double filtered according to the workflow depicted in Fig. 2A. Partek Genomic Suite (Partek) assigned a unique alternative splicing statistic value to each gene (we set the cutoff at alt.splice attribute ≤0.0001). Additionally, EAA (47) generated a unique splicing index for each probe set and paired comparison by relating single probe set intensities to average gene probe set intensity (equivalent to gene expression). Only probe sets with a −1 ≥ splicing index ≥ 1 were considered. By performing this double filter, we aimed to increase the robustness of the alternative splicing candidates and profited from the intrinsic differences of the analysis performed by both programs. For global splicing categorization, we used AltAnalyze (48). As in the microarray procedures, for all the bioinformatics approaches described above we used robust multianalysis background correction.
Gene/Exon Expression Validation by Quantitative RT-PCR
To design primers targeting characteristic exons/regions of annotated isoforms from candidate genes, we used the “probe-to-transcript” mapping feature from EAA combined with the Ensembl database. Hits for gene expression and for alternative splicing/alternative promoter usage were validated using SYBR Green-based qRT-PCR. Gene/exon expression was normalized using hypoxanthine-guanine phosphoribosyltransferase as housekeeping gene. The relative expression of different target gene isoforms was confirmed by specific probe set-primer design. All oligonucleotide sequences used in the study are summarized in Table 1.
Western Blotting Analysis
Protein extracts were prepared in a modified FLAG lysis buffer (50 mm Tris-HCl, pH 7.4, 180 mm NaCl, 1% Triton X-100, 15% glycerol, and 1 mm EDTA) supplemented with 1 mm DTT and 0.5 mm PMSF. Protein extracts were resolved by SDS-polyacrylamide gel electrophoresis and transferred onto polyvinylidene difluoride membranes. Immunoblotting was performed with antibodies that recognize all PGC-1α isoforms analyzed in this study (4C1.3, Merck Millipore), C-terminal residues of Osbpl1a (anti-ORP1, ab131165, Abcam), and the C-terminal end of Ndrg4 (anti-NDRG4, 9039, Cell Signaling Technology).
Protein Stability and Half-life Determination
Myoblasts were differentiated and transduced as described above in “Cell Culture and PGC-1α Isoform Expression” under “Experimental Procedures.” On the 4th day of differentiation, cells were treated with 10 μm proteasome inhibitor MG132 or DMSO as control for 4 h. Alternatively and to determine PGC-1α protein half-lives, myotubes were treated for different times (20 min, 40 min, 1 h, 2 h, and 4 h) with 100 μg/ml cycloheximide. After the different incubation times, cells were harvested for cell lysates as described above in “Western Blotting Analysis” under “Experimental Procedures.”
Extracellular Flux Analysis (Seahorse)
Myoblasts were differentiated and transduced as described before. On the 4th day of differentiation, mitochondrial oxidative phosphorylation from myotubes transduced with adenovirus expressing PGC-1α1, -α2, -α3, -α4, or GFP control were analyzed using extracellular flux analysis (XF24, Seahorse Biosciences) in DMEM, pH 7.4 (Sigma-Aldrich) by using either 1 mm pyruvate or 5 mm glucose as substrate (Sigma-Aldrich). Baseline oxygen consumption rate was measured. Following baseline measurements, oligomycin (1 μm), carbonyl cyanide-4-(trifluoromethoxy)phenylhydrazone (0.3 μm), and antimycin A (2 μm) were sequentially injected to measure oxygen consumption rates upon different challenges.
Animal Experimentation
Mck-PGC-1α1 skeletal muscle transgenic mice have been described previously (3, 7). Myo-PGC-1α4 skeletal muscle transgenic mice are a C57BL/6 10th generation backcrossing of the previously described Myo-Myo-PGC-1α4 transgenic line (3). All experiments and protocols were approved by the regional animal ethics committee of Northern Stockholm, Sweden.
Array Data
All the array data in this study are deposited at Gene Expression Omnibus (GEO) (www.ncbi.nlm.nih.gov/geo/) under accession number GSE75448. Complementary analysis has been done with the previously published microarray data with accession number GSE42473 (3).
Author Contributions
V. M.-R. and J. L. R. conceived, coordinated, and designed the study and wrote the paper. V. M.-R., J. M. L., I. S., and K. D.-W. performed the bioinformatics analysis. I. C. provided technical assistance and contributed to the preparation of figures. V. M.-R., P. R. J., J. C. C., I. C., D. M. S. F., M. I., A. T. P-K., L. Z. A., and A. G.-C. performed and analyzed experiments. P. C. B. analyzed experiments. All authors reviewed the results and approved the final version of the manuscript.
This work was supported in part by grants from the Swedish Research Council, the Strategic Research Programme in Diabetes at Karolinska Institutet, the Novo Nordisk Foundation (Denmark), the Swedish Diabetes Foundation, and the Malin and Lennart Phiipson Foundation (to J. L. R). The authors declare that they have no conflicts of interest with the contents of this article.
- PGC-1α
- peroxisome proliferator-activated receptor γ coactivator 1-α
- RRM
- RNA recognition motif
- CTD
- C-terminal domain
- qRT-PCR
- quantitative RT-PCR
- Ddx27
- DEAD box polypeptide 27
- Osbpl1a
- oxysterol-binding protein-like 1A
- Ndrg4
- n-myc downstream regulated gene 4
- IPA
- Ingenuity Pathway Analysis
- Mcm
- minichromosome maintenance
- EAA
- Exon Array Analyzer
- Myo-PGC-1α4
- myogenin promoter-PGC-1α4
- Mck-PGC-1α1
- muscle creatine kinase promoter-PGC-1α1
- PPAR
- peroxisome proliferator-activated receptor.
References
- 1. Correia J. C., Ferreira D. M., and Ruas J. L. (2015) Intercellular: local and systemic actions of skeletal muscle PGC-1s. Trends Endocrinol. Metab. 26, 305–314 [DOI] [PubMed] [Google Scholar]
- 2. Zhang Y., Huypens P., Adamson A. W., Chang J. S., Henagan T. M., Boudreau A., Lenard N. R., Burk D., Klein J., Perwitz N., Shin J., Fasshauer M., Kralli A., and Gettys T. W. (2009) Alternative mRNA splicing produces a novel biologically active short isoform of PGC-1α. J. Biol. Chem. 284, 32813–32826 [DOI] [PMC free article] [PubMed] [Google Scholar]
- 3. Ruas J. L., White J. P., Rao R. R., Kleiner S., Brannan K. T., Harrison B. C., Greene N. P., Wu J., Estall J. L., Irving B. A., Lanza I. R., Rasbach K. A., Okutsu M., Nair K. S., Yan Z., Leinwand L. A., and Spiegelman B. M. (2012) A PGC-1α isoform induced by resistance training regulates skeletal muscle hypertrophy. Cell 151, 1319–1331 [DOI] [PMC free article] [PubMed] [Google Scholar]
- 4. Martínez-Redondo V., Pettersson A. T., and Ruas J. L. (2015) The hitchhiker's guide to PGC-1α isoform structure and biological functions. Diabetologia 58, 1969–1977 [DOI] [PubMed] [Google Scholar]
- 5. Chinsomboon J., Ruas J., Gupta R. K., Thom R., Shoag J., Rowe G. C., Sawada N., Raghuram S., and Arany Z. (2009) The transcriptional coactivator PGC-1α mediates exercise-induced angiogenesis in skeletal muscle. Proc. Natl. Acad. Sci. U.S.A. 106, 21401–21406 [DOI] [PMC free article] [PubMed] [Google Scholar]
- 6. Nader G. A., von Walden F., Liu C., Lindvall J., Gutmann L., Pistilli E. E., and Gordon P. M. (2014) Resistance exercise training modulates acute gene expression during human skeletal muscle hypertrophy. J. Appl. Physiol. 116, 693–702 [DOI] [PubMed] [Google Scholar]
- 7. Lin J., Wu H., Tarr P. T., Zhang C. Y., Wu Z., Boss O., Michael L. F., Puigserver P., Isotani E., Olson E. N., Lowell B. B., Bassel-Duby R., and Spiegelman B. M. (2002) Transcriptional co-activator PGC-1α drives the formation of slow-twitch muscle fibres. Nature 418, 797–801 [DOI] [PubMed] [Google Scholar]
- 8. Monsalve M., Wu Z., Adelmant G., Puigserver P., Fan M., and Spiegelman B. M. (2000) Direct coupling of transcription and mRNA processing through the thermogenic coactivator PGC-1. Mol. Cell 6, 307–316 [DOI] [PubMed] [Google Scholar]
- 9. Kornblihtt A. R., Schor I. E., Alló M., Dujardin G., Petrillo E., and Muñoz M. J. (2013) Alternative splicing: a pivotal step between eukaryotic transcription and translation. Nat. Rev. Mol. Cell Biol. 14, 153–165 [DOI] [PubMed] [Google Scholar]
- 10. Du L., and Warren S. L. (1997) A functional interaction between the carboxy-terminal domain of RNA polymerase II and pre-mRNA splicing. J. Cell Biol. 136, 5–18 [DOI] [PMC free article] [PubMed] [Google Scholar]
- 11. Auboeuf D., Dowhan D. H., Kang Y. K., Larkin K., Lee J. W., Berget S. M., and O'Malley B. W. (2004) Differential recruitment of nuclear receptor coactivators may determine alternative RNA splice site choice in target genes. Proc. Natl. Acad. Sci. U.S.A. 101, 2270–2274 [DOI] [PMC free article] [PubMed] [Google Scholar]
- 12. Huang Y., Li W., Yao X., Lin Q. J., Yin J. W., Liang Y., Heiner M., Tian B., Hui J., and Wang G. (2012) Mediator complex regulates alternative mRNA processing via the MED23 subunit. Mol. Cell 45, 459–469 [DOI] [PMC free article] [PubMed] [Google Scholar]
- 13. Du C., Ma X., Meruvu S., Hugendubler L., and Mueller E. (2014) The adipogenic transcriptional cofactor ZNF638 interacts with splicing regulators and influences alternative splicing. J. Lipid Res. 55, 1886–1896 [DOI] [PMC free article] [PubMed] [Google Scholar]
- 14. Puigserver P., Wu Z., Park C. W., Graves R., Wright M., and Spiegelman B. M. (1998) A cold-inducible coactivator of nuclear receptors linked to adaptive thermogenesis. Cell 92, 829–839 [DOI] [PubMed] [Google Scholar]
- 15. Thijssen-Timmer D. C., Schiphorst M. P., Kwakkel J., Emter R., Kralli A., Wiersinga W. M., and Bakker O. (2006) PGC-1α regulates the isoform mRNA ratio of the alternatively spliced thyroid hormone receptor α transcript. J. Mol. Endocrinol. 37, 251–257 [DOI] [PubMed] [Google Scholar]
- 16. Silvennoinen M., Ahtiainen J. P., Hulmi J. J., Pekkala S., Taipale R. S., Nindl B. C., Laine T., Häkkinen K., Selänne H., Kyröläinen H., and Kainulainen H. (2015) PGC-1 isoforms and their target genes are expressed differently in human skeletal muscle following resistance and endurance exercise. Physiol. Rep. 3, e12563. [DOI] [PMC free article] [PubMed] [Google Scholar]
- 17. Trausch-Azar J. S., Abed M., Orian A., and Schwartz A. L. (2015) Isoform-specific SCF(Fbw7) ubiquitination mediates differential regulation of PGC-1α. J. Cell. Physiol. 230, 842–852 [DOI] [PMC free article] [PubMed] [Google Scholar]
- 18. Sano M., Tokudome S., Shimizu N., Yoshikawa N., Ogawa C., Shirakawa K., Endo J., Katayama T., Yuasa S., Ieda M., Makino S., Hattori F., Tanaka H., and Fukuda K. (2007) Intramolecular control of protein stability, subnuclear compartmentalization, and coactivator function of peroxisome proliferator-activated receptor γ coactivator 1α. J. Biol. Chem. 282, 25970–25980 [DOI] [PubMed] [Google Scholar]
- 19. Olson B. L., Hock M. B., Ekholm-Reed S., Wohlschlegel J. A., Dev K. K., Kralli A., and Reed S. I. (2008) SCFCdc4 acts antagonistically to the PGC-1α transcriptional coactivator by targeting it for ubiquitin-mediated proteolysis. Genes Dev. 22, 252–264 [DOI] [PMC free article] [PubMed] [Google Scholar]
- 20. Tian L., Cao J., Deng X., Zhang C., Qian T., Song X., and Huang B. (2014) Unveiling transcription factor regulation and differential co-expression genes in Duchenne muscular dystrophy. Diagn. Pathol. 9, 210. [DOI] [PMC free article] [PubMed] [Google Scholar]
- 21. Roberts T. C., Johansson H. J., McClorey G., Godfrey C., Blomberg K. E., Coursindel T., Gait M. J., Smith C. I., Lehtiö J., El Andaloussi S., and Wood M. J. (2015) Multi-level omics analysis in a murine model of dystrophin loss and therapeutic restoration. Hum. Mol. Genet. 24, 6756–6768 [DOI] [PMC free article] [PubMed] [Google Scholar]
- 22. Camarda G., Siepi F., Pajalunga D., Bernardini C., Rossi R., Montecucco A., Meccia E., and Crescenzi M. (2004) A pRb-independent mechanism preserves the postmitotic state in terminally differentiated skeletal muscle cells. J. Cell Biol. 167, 417–423 [DOI] [PMC free article] [PubMed] [Google Scholar]
- 23. Guo Y., Fan Y., Zhang J., Chang L., Lin J. D., and Chen Y. E. (2013) Peroxisome proliferator-activated receptor γ coactivator 1β (PGC-1β) protein attenuates vascular lesion formation by inhibition of chromatin loading of minichromosome maintenance complex in smooth muscle cells. J. Biol. Chem. 288, 4625–4636 [DOI] [PMC free article] [PubMed] [Google Scholar]
- 24. Thom R., Rowe G. C., Jang C., Safdar A., and Arany Z. (2014) Hypoxic induction of vascular endothelial growth factor (VEGF) and angiogenesis in muscle by truncated peroxisome proliferator-activated receptor γ coactivator (PGC)-1α. J. Biol. Chem. 289, 8810–8817 [DOI] [PMC free article] [PubMed] [Google Scholar]
- 25. Kotipatruni R. P., Ferraro D. J., Ren X., Vanderwaal R. P., Thotala D. K., Hallahan D. E., and Jaboin J. J. (2012) NDRG4, the N-Myc downstream regulated gene, is important for cell survival, tumor invasion and angiogenesis in meningiomas. Integr. Biol. 4, 1185–1197 [DOI] [PubMed] [Google Scholar]
- 26. Qu X., Jia H., Garrity D. M., Tompkins K., Batts L., Appel B., Zhong T. P., and Baldwin H. S. (2008) Ndrg4 is required for normal myocyte proliferation during early cardiac development in zebrafish. Dev. Biol. 317, 486–496 [DOI] [PMC free article] [PubMed] [Google Scholar]
- 27. Qu X., Zhai Y., Wei H., Zhang C., Xing G., Yu Y., and He F. (2002) Characterization and expression of three novel differentiation-related genes belong to the human NDRG gene family. Mol. Cell. Biochem. 229, 35–44 [DOI] [PubMed] [Google Scholar]
- 28. Johansson M., Bocher V., Lehto M., Chinetti G., Kuismanen E., Ehnholm C., Staels B., and Olkkonen V. M. (2003) The two variants of oxysterol binding protein-related protein-1 display different tissue expression patterns, have different intracellular localization, and are functionally distinct. Mol. Biol. Cell 14, 903–915 [DOI] [PMC free article] [PubMed] [Google Scholar]
- 29. Nakada N., Hongo S., Ohki T., Maeda A., and Takeda M. (2002) Molecular characterization of NDRG4/Bdm1 protein isoforms that are differentially regulated during rat brain development. Brain Res. Dev. Brain Res. 135, 45–53 [DOI] [PubMed] [Google Scholar]
- 30. Trausch-Azar J., Leone T. C., Kelly D. P., and Schwartz A. L. (2010) Ubiquitin proteasome-dependent degradation of the transcriptional coactivator PGC-1α via the N-terminal pathway. J. Biol. Chem. 285, 40192–40200 [DOI] [PMC free article] [PubMed] [Google Scholar]
- 31. Wen X., Wu J., Chang J. S., Zhang P., Wang J., Zhang Y., Gettys T. W., and Zhang Y. (2014) Effect of exercise intensity on isoform-specific expressions of NT-PGC-1α mRNA in mouse skeletal muscle. Biomed. Res. Int. 2014, 402175. [DOI] [PMC free article] [PubMed] [Google Scholar]
- 32. Chang J. S., Fernand V., Zhang Y., Shin J., Jun H. J., Joshi Y., and Gettys T. W. (2012) NT-PGC-1α protein is sufficient to link β3-adrenergic receptor activation to transcriptional and physiological components of adaptive thermogenesis. J. Biol. Chem. 287, 9100–9111 [DOI] [PMC free article] [PubMed] [Google Scholar]
- 33. Tadaishi M., Miura S., Kai Y., Kano Y., Oishi Y., and Ezaki O. (2011) Skeletal muscle-specific expression of PGC-1α-b, an exercise-responsive isoform, increases exercise capacity and peak oxygen uptake. PLoS One 6, e28290. [DOI] [PMC free article] [PubMed] [Google Scholar]
- 34. Vega R. B., Huss J. M., and Kelly D. P. (2000) The coactivator PGC-1 cooperates with peroxisome proliferator-activated receptor α in transcriptional control of nuclear genes encoding mitochondrial fatty acid oxidation enzymes. Mol. Cell. Biol. 20, 1868–1876 [DOI] [PMC free article] [PubMed] [Google Scholar]
- 35. Minsky N., and Roeder R. G. (2015) Direct link between metabolic regulation and the heat-shock response through the transcriptional regulator PGC-1α. Proc. Natl. Acad. Sci. U.S.A. 112, E5669–E5678 [DOI] [PMC free article] [PubMed] [Google Scholar]
- 36. Ryu S., and Driever W. (2006) Minichromosome maintenance proteins as markers for proliferation zones during embryogenesis. Cell Cycle 5, 1140–1142 [DOI] [PubMed] [Google Scholar]
- 37. Muscat G. E., Wagner B. L., Hou J., Tangirala R. K., Bischoff E. D., Rohde P., Petrowski M., Li J., Shao G., Macondray G., and Schulman I. G. (2002) Regulation of cholesterol homeostasis and lipid metabolism in skeletal muscle by liver X receptors. J. Biol. Chem. 277, 40722–40728 [DOI] [PubMed] [Google Scholar]
- 38. Trapani L., Segatto M., La Rosa P., Fanelli F., Moreno S., Marino M., and Pallottini V. (2012) 3-Hydroxy 3-methylglutaryl coenzyme A reductase inhibition impairs muscle regeneration. J. Cell. Biochem. 113, 2057–2063 [DOI] [PubMed] [Google Scholar]
- 39. Cohen T. V., Kollias H. D., Liu N., Ward C. W., and Wagner K. R. (2015) Genetic disruption of Smad7 impairs skeletal muscle growth and regeneration. J. Physiol. 593, 2479–2497 [DOI] [PMC free article] [PubMed] [Google Scholar]
- 40. Lee S., Wang P. Y., Jeong Y., Mangelsdorf D. J., Anderson R. G., and Michaely P. (2012) Sterol-dependent nuclear import of ORP1S promotes LXR regulated trans-activation of apoE. Exp. Cell Res. 318, 2128–2142 [DOI] [PMC free article] [PubMed] [Google Scholar]
- 41. Vihervaara T., Uronen R. L., Wohlfahrt G., Björkhem I., Ikonen E., and Olkkonen V. M. (2011) Sterol binding by OSBP-related protein 1L regulates late endosome motility and function. Cell. Mol. Life Sci. 68, 537–551 [DOI] [PMC free article] [PubMed] [Google Scholar]
- 42. Oliveros J. C. (2015) VENNY, BioinfoGP, Centro Nacional de Biotecnología, Madrid, Spain [Google Scholar]
- 43. Das R., Yu J., Zhang Z., Gygi M. P., Krainer A. R., Gygi S. P., and Reed R. (2007) SR proteins function in coupling RNAP II transcription to pre-mRNA splicing. Mol. Cell 26, 867–881 [DOI] [PubMed] [Google Scholar]
- 44. Wallberg A. E., Yamamura S., Malik S., Spiegelman B. M., and Roeder R. G. (2003) Coordination of p300-mediated chromatin remodeling and TRAP/mediator function through coactivator PGC-1α. Mol. Cell 12, 1137–1149 [DOI] [PubMed] [Google Scholar]
- 45. Megeney L. A., Perry R. L., LeCouter J. E., and Rudnicki M. A. (1996) bFGF and LIF signaling activates STAT3 in proliferating myoblasts. Dev. Genet. 19, 139–145 [DOI] [PubMed] [Google Scholar]
- 46. Lockstone H. E. (2011) Exon array data analysis using Affymetrix power tools and R statistical software. Brief. Bioinform. 12, 634–644 [DOI] [PMC free article] [PubMed] [Google Scholar]
- 47. Gellert P., Uchida S., and Braun T. (2009) Exon Array Analyzer: a web interface for Affymetrix exon array analysis. Bioinformatics 25, 3323–3324 [DOI] [PubMed] [Google Scholar]
- 48. Emig D., Salomonis N., Baumbach J., Lengauer T., Conklin B. R., and Albrecht M. (2010) AltAnalyze and DomainGraph: analyzing and visualizing exon expression data. Nucleic Acids Res. 38, W755–W762 [DOI] [PMC free article] [PubMed] [Google Scholar]