

Abstract
Diabetes is associated with impaired cognitive function. Streptozotocin (STZ)-induced diabetic rats exhibit a loss of neurogenesis and deficits in behavioral tasks involving spatial learning and memory; thus, impaired adult hippocampal neurogenesis may contribute to diabetes-associated cognitive deficits. Recent studies have demonstrated that adult neurogenesis generally occurs in the dentate gyrus of the hippocampus, the subventricular zone, and the olfactory bulbs (OB) and is defective in patients with diabetes. We hypothesized that OB neurogenesis and associated behaviors would be affected in diabetes. In this study, we show that inhibition of Wnt3-induced neurogenesis in the OB causes several behavioral deficits in STZ-induced diabetic rats, including impaired odor discrimination, cognitive dysfunction, and increased anxiety. Notably, the sodium- and chloride-dependent GABA transporters and excitatory amino acid transporters that localize to GABAergic and glutamatergic terminals decreased in the OB of diabetic rats. Moreover, GAT1 inhibitor administration also hindered Wnt3-induced neurogenesis in vitro. Collectively, these data suggest that STZ-induced diabetes adversely affects OB neurogenesis via GABA and glutamate transporter systems, leading to functional impairments in olfactory performance.
Keywords: diabetes, insulin, neurodifferentiation, neurogenesis, neurotransmitter release, GAT1, Wnt3, olfactory bulb
Introduction
Mammalian neurogenesis occurs in the subventricular zone (SVZ)4 of the lateral ventricles and the sub-granular zone of the dentate gyrus in the hippocampus (1–3). In the SVZ, self-renewing multipotent neural stem cells (NSCs) give rise to neuroblasts, which migrate through the rostral migratory stream into the olfactory bulb (OB) where they differentiate into multiple types of local interneurons. In addition to the sub-granular zone and SVZ, the OB core is another proposed source of NSCs (4–8). NSC cultures have been derived from the adult rodent and human OB (4, 5); thus, local NSCs in the OB may provide a valuable source for autologous transplantation in neurodegenerative disorders and other diseases. NSCs possess self-renewal and multipotency capacities and can differentiate into neurons, astrocytes, or oligodendrocytes (9, 10). Insulin supports the function of basic fibroblast growth factor (FGF2), which promotes maintenance of undifferentiated NSCs (11), as well as triggers the differentiation of multipotent NSCs into oligodendrocytes (12). Newly formed neurons are incorporated into the functional networks of the OB and dentate gyrus, demonstrating the substantial impact of adult neurogenesis on brain functions such as learning, memory processing, and odor discrimination (13–17).
Diabetes, one of the most common serious metabolic disorders in humans, is characterized by hyperglycemia that is caused by defects in insulin secretion, activity, or both (18). Diabetes is associated with cognitive decline and increased risks of Alzheimer disease and dementia (19–23). Cognitive deficits have also been reported in studies of rodent models of diabetes. The cytotoxic agent streptozotocin (STZ) selectively destroys insulin-producing β-cells of the pancreas by entering through the Glut2 glucose transporter. STZ-induced type 1 diabetic rodents exhibit deficits in behavioral tasks involving spatial learning and memory, such as performance in the Morris water maze and novel object recognition tests (24–26). The blood-brain barrier is devoid of Glut2 transporters (27), suggesting that STZ has limited direct effects on the brain. Impaired adult hippocampal neurogenesis is also observed in diabetic rodents, while abrogated long term potentiation, hippocampal neurogenesis, and cognitive deficits were restored in STZ-induced diabetic rats and db/db mice after adrenalectomy and corticosterone replacement at physiological concentrations (26). As such, glucocorticoids were believed to be responsible for the hindered neurogenesis and cognitive dysfunction in diabetes.
We recently demonstrated that adult hippocampal neurons and NSCs derived from the hippocampus and OB express insulin at detectable levels (28). In that study, NeuroD1 directly induced insulin (INS) gene expression in NSCs isolated from the adult hippocampus and OB. Wnt3 is an instructive factor secreted by astrocytes and promotes adult neurogenesis by stimulating NeuroD1 expression, a basic helix-loop-helix transcription factor (29). Thus, under Wnt3 activation, NeuroD1 promotes neurogenesis and insulin production in the adult OB and hippocampal NSCs. Indeed, NSCs derived from the OB and hippocampus of adult diabetic rats retained their intrinsic capacity to produce insulin, making these cells a useful source for autologous cell transplantation in diabetes.
Dysfunctions in olfactory and OB neurogenesis have been observed patients with diabetes (30–32) and present clinically as altered olfactory-related behaviors. The characteristics of NSCs and their neurogenic niche in diabetes are critical elements of insulin function and neurogenesis; thus, it is important to understand the mechanism of diabetes-induced deficits in neuronal function. We previously demonstrated great similarities in the expression pattern of genes involved in diabetes and Wnt signaling between NSCs of the OB and hippocampus in diabetes. As such, we hypothesized that adult OB NSC neurogenesis and OB function are also affected by diabetes (33). In this study, we evaluated the morphology of the OB neurogenic niche. Most importantly, Wnt3-induced neurogenesis was inhibited in the OB of STZ-treated diabetic rats, which also exhibited several behavioral deficits, including loss of odor discrimination ability, cognitive dysfunction, and increased anxiety. Sodium- and chloride-dependent GABA transporter 1 (GAT1), which localizes to GABAergic terminals, was inhibited in the diabetic OB, and a GAT1 inhibitor suppressed Wnt3-induced neurogenesis in vitro. From these studies, we conclude that diabetes has an adverse effect on OB neurogenesis and function. Our findings provide evidence that insulin deficiency leads to attenuation of neurogenesis and GABA activity and glutamate neurotransmission systems in the OB, thereby causing functional impairment in olfactory performance. In addition, insulin may promote the neuronal differentiation of OB NSCs by controlling GABA uptake by GAT1.
Results
Strict Regulation of NSC Differentiation in the OB
To analyze the cell fate specification of NSCs in the OB, immunohistochemistry was performed to identify stem cells, neuronal progenitors, neurons, astrocytes, and oligodendrocytes in 7-week-old rats. The distribution of neural stem cells and mature neurons was first confirmed by immunostaining for Sox2 and NeuN, as markers for stem cells and mature neurons, respectively (Fig. 1A). NeuN was specifically expressed in the interneuron-rich granule cell layer (GCL) and partially in the glomerular layer (GL) but less in external plexiform layer. In contrast, Sox2, a multipotential NSC marker, was abundantly expressed in the GL. No co-localization between NeuN and Sox was observed in the OB. Thus, the localization of multipotent undifferentiated NSCs and mature neurons was distinct in the OB.
FIGURE 1.

Morphological characteristics of stem cells, neurons, astrocytes, and oligodendrocytes in the adult OB. A, distribution of neuronal stem cells and mature neurons. Left, representative merged image of Sox2 (red), NeuN (green), and DAPI-labeled nuclei (blue). Right, representative magnified image of GL. B, distribution of neurons in different stages. Left, representative merged image of NeuroD1 (red), Sox2 (green), and DAPI (blue). Right, representative image of TUJ1 (red), NeuN (green), and DAPI (blue). C, distribution of oligodendrocytes. Left, representative image of Olig2 (red), NeuN (green), and DAPI (blue). Right, representative image of MBP (red), GFAP (green), and DAPI (blue). D, distribution of astrocytes. Left, the representative image of NeuN (red), GFAP (green), with DAPI (blue). Right, representative image of S100β (red), GFAP (green), and DAPI (blue). EPL, external plexiform layer.
To investigate neuronal differentiation in OB, the distribution of Sox2-positive stem cells and the early stage neuronal differentiation marker NeuroD1 was assessed by immunohistochemistry. Notably, NeuroD1-positive cells did not co-localize with Sox2-positive cells in the GL (Fig. 1B, left). To detect the neuronal cells with further differentiation in the OB, the presence of immature neurons and mature neurons was further investigated with antibodies directed toward the immature neuronal markers TUJ1 and NeuN. TUJ1 (immature neuronal marker)-positive cells did not co-localize with NeuN-positive cells (Fig. 1B, right), indicating that the OB contained cells from each stage of neuronal differentiation, but NSCs and early stage neuronal cells, immature, and mature neurons did not co-localize with each other. The GL is suggested to be another source of NSCs in OB. In addition, neuronal differentiation from stem cells to neurons is strictly controlled, similar to that observed with hippocampal neuronal differentiation.
Because NSCs can also generate oligodendrocytes and astrocytes, we examined neuronal morphology and glial lineages in OB. Notably, positive cells for the immature oligodendrocyte marker Olig2 were observed in GL where NSCs and neural progenitor cells were found, but it did not co-localize with NeuN-positive cells (Fig. 1C, left). Alternatively, cells positive for the mature oligodendrocyte marker MBP were observed, but they did not co-localize with those expressing GFAP, a Wnt3-producting astrocyte marker, in GCL (Fig. 1C, right). GFAP-positive cells were also found in the GL, but these cells did not co-localize with NeuN-positive cells (Fig. 1D, left). Mature astrocytes were also detected with S100β. Most S100β-positive cells were co-localized with GFAP-positive cells in the GCL (Fig. 1D, right). Therefore, both mature and immature oligodendrocytes and astrocytes exist in OB. These results suggest that NSC differentiation into neurons, astrocytes, or oligodendrocyte is strictly regulated and that once a differentiation path has been determined, the cells no longer express markers of other lineages.
Diabetes Impairs Neuronal and Oligodendrocyte Differentiation
NSCs and other lineages were observed in the normal OB. Then, the expression of genes associated with each cell lineage was investigated in STZ-induced diabetic rats. Sox2 transcript levels in STZ-induced diabetic rats were comparable with those in the control rats (WT) 10 days after STZ treatment, but expression increased by day 30 in the diabetic versus WT rats (Fig. 2A, left). mRNA expression of another stem cell marker, Nestin, markedly decreased on day 10 but was comparable with that of the control at day 30 (Fig. 2A, right).
FIGURE 2.
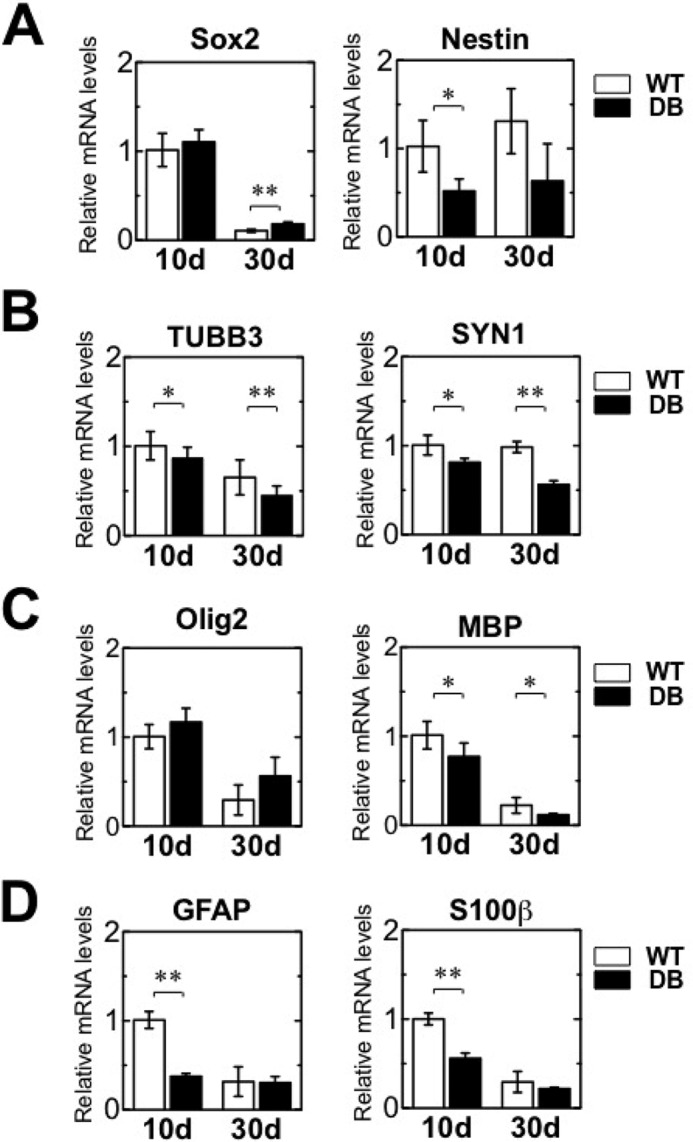
Expression levels of specific marker genes for stem cells, neurons, astrocytes, and oligodendrocytes in the adult OB of STZ-induced diabetes. qRT-PCR analysis showing relative mRNA levels of specific marker genes for stem cells, neurons, astrocytes, and oligodendrocytes in the OB of wild-type (WT) and diabetic (DB) rats at 10 and 30 days (d) after STZ treatment. A, gene expression of the stem cell markers Sox2 and Nestin. B, gene expression of the neuronal markers β-tubulin3 (TUBB3) and synapsin1 (SYN1). C, gene expression of the oligodendrocyte markers Olig2 and MBP. D, gene expression of the astrocyte markers GFAP and S100β. All data have been normalized to the levels of Gapdh mRNA as an internal control and indicated as the ratio relative to that in the WT at 10 days. White bars, WT; black bars, DB. Data are represented as mean ± S.D. (n = 4). *, p < 0.05, versus corresponding WT; **, p < 0.01 versus corresponding WT. Statistical significance was determined by Student's t test.
Expression of the immature neuronal marker β-tubulin III (Tubb3) and mature neuronal marker synapsin 1 (Syn1) was substantially lower in diabetic rats than WT rats on days 10 and 30 (Fig. 2B). Similar to Tubb3 and Syn1, we observed a substantial decrease in the expression of Mbp, a mature oligodendrocyte marker, in diabetic rats on days 10 and 30. The marker of immature oligodendrocytes Olig2 was comparable in WT and diabetic rats (Fig. 2C). Expression of the astrocyte markers GFAP and S100β markedly decreased in diabetic versus WT rats on day 10 and remained low on day 30 in both WT and diabetic rats (Fig. 2D). These data suggest STZ-induced diabetes is associated with a substantial reduction in the expression of neuronal and mature oligodendrocyte lineage-related transcripts in the OB over a relatively long period of time.
Western blot analysis was performed to examine the expression of lineage-specific markers in the OB on day 30 after diabetes induction. Sox2 protein expression was comparable in WT and diabetic rats (Fig. 3A, left). Nestin expression was also comparable in WT and diabetic rats (Fig. 3A, right). In contrast to the expression of stem cell markers, that of neuron-specific markers TUJ1 and SYN1 was substantially lower in diabetic than in WT rats (Fig. 3B). The expression of the oligodendrocyte markers Olig2 and MBP was also reduced in diabetic rats (Fig. 3C). Expression of the astrocyte marker protein GFAP markedly decreased in diabetic versus WT rats; however, expression levels of the astrocyte marker S100β were comparable in both groups (Fig. 3D), consistent with the previous study (34). These results suggest that the differentiation of neuron and oligodendrocyte lineages is impaired in diabetic progression. However, diabetes may not have a severe effect on the differentiation and maturation of astrocytes, because S100β characterizes a mature developmental stage in the astrocytic lineage (35), and its protein expression was similar in WT and diabetic rats on day 30. There was no correlation between gene and protein expression of several markers of NSCs, astrocytes, and oligodendrocytes such as Sox2, Olig2, and GFAP at 30 days after STZ treatment. Transcript levels do not necessarily correlate to the amount of expressed protein, because the translation of mRNAs into proteins is a highly regulated process. Although levels of some transcripts did not correlate with protein expression, it was clear that the expression of neuronal and mature oligodendrocyte markers was consistently reduced in diabetic rats at the transcriptional and post-transcriptional levels. These results suggest diabetes impairs neuronal and oligodendrocyte differentiation.
FIGURE 3.

Expression of specific markers for stem cells, neurons, astrocytes, and oligodendrocytes at the protein level in the adult OB in STZ-induced diabetes. Western blot analysis of specific stem cell, neuron, astrocyte, and oligodendrocyte markers in the OBs of wild-type (WT) and diabetic (DB) rats at 10 and 30 days (d) after STZ treatment. Quantification of relative protein levels of Sox2 and Nestin (A), β-tubulin3 (Tubb3), and synapsin 1 (Syn1) (B), Olig2 and Mbp (C), and Gfap and S100β (D). The protein expression levels were normalized to Gapdh expression and indicated as the ratio relative to that in WT at 10 days. Representative bands are shown at the right in each graph. White bars, WT; black bars, DB. Data are represented as mean ± S.D. (n = 4). *, p < 0.05; **, p < 0.01 versus corresponding WT. Statistical significance was determined by Student's t test.
Diabetes Impairs NSC Differentiation into Neurons
To detect the proliferation and lineage specification rates of NSCs during diabetes progression, proliferating cells were labeled with BrdU on day 20 after STZ treatment. The percentage of Sox2+ BrdU-labeled new cells expressing the stem cell marker Sox2 was similar in WT and diabetic rats (Fig. 4, A and C); however, the percentage of newly dividing BrdU-labeled cells expressing the early neuronal differentiation marker NeuroD1 was remarkably lower in diabetic versus WT rats (Fig. 4, B and C). Less than 10% of BrdU-labeled cells expressed NeuroD1 in diabetic rats, whereas more than 40% of BrdU-labeled cells expressed this protein in WT rats (Fig. 4C). The number of BrdU-labeled cells expressing NeuN, a mature neuronal marker in diabetes, was reduced slightly but not significantly. No significant difference was observed between the percentage of BrdU-labeled cells expressing Olig2 and S100β in WT and diabetic rats (Fig. 4C). Thus, the newly dividing BrdU+ cells that expressed specific markers of early neuronal differentiation and mature neurons were partially suppressed in diabetic rats. Therefore, diabetes impaired NSC differentiation into neurons but had a minor influence on NSC proliferation and the differentiation of oligodendrocytes and astrocytes.
FIGURE 4.
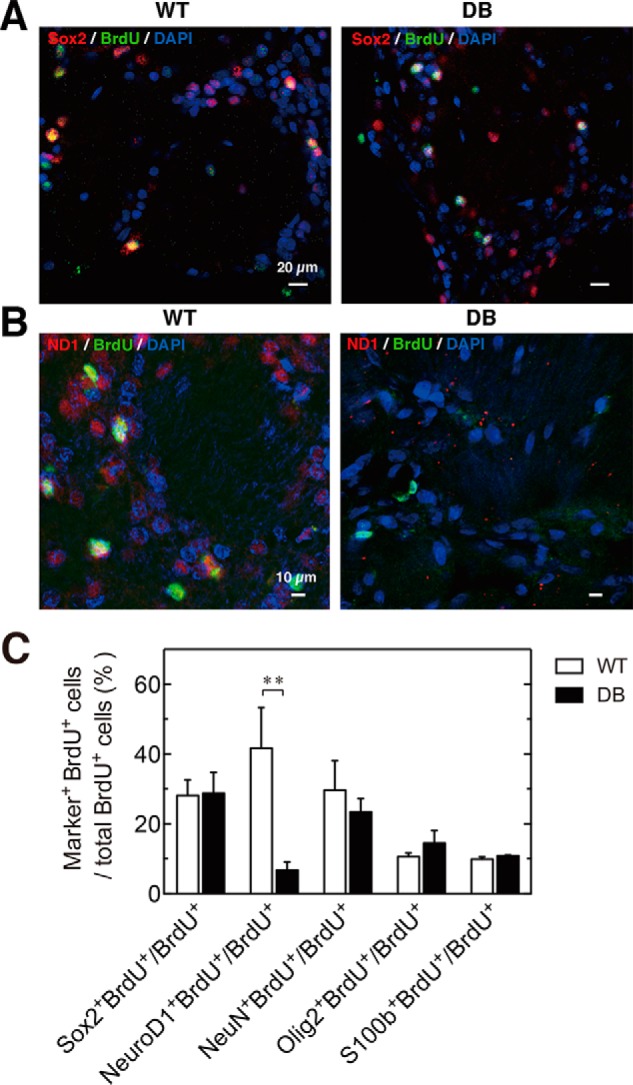
Neuronal differentiation is impaired in the OB in STZ-induced diabetes. STZ and BrdU (200 mg/kg) were administered to 4-week-old F344 rats. The differentiation potential of the Sox2+ NSC cells into neural progenitors, mature neurons, astrocytes, and oligodendrocytes was detected by the expression of specific markers and BrdU incorporation after 20 days in wild-type (WT) and STZ-induced diabetic (DB) rats. A, representative images of Sox2 (red), BrdU (green), and DAPI (blue) in WT (left) and DB rats (right). B, representative images of NeuroD1 (red), BrdU (green), and DAPI (blue) in WT (left) and diabetic (right) rats. C, percentage of the BrdU+ cells in each cell lineage population was quantified in the OB. White bars, WT; black bars, DB. Data are represented as mean ± S.D. (n = 4). *, p < 0.05, versus **, p < 0.01 versus corresponding WT.
Diabetes Reduces Wnt3 Expression in OB
Wnt3 is required to promote NeuroD1 expression and neurogenesis in the adult hippocampus (29, 36, 37). The impairment of neuronal differentiation in diabetes (Figs. 2–4) prompted us to explore Wnt3 expression in the OB at 10 and 30 days after STZ treatment. We observed similar transcript and protein profiles of specific markers for stem cell and neuronal progenitors, neurons, astrocytes, and oligodendrocytes on days 20 and 30 in diabetic rats (data not shown); immunohistochemistry was performed on day 20 after STZ treatment. Although GFAP-expressing cells were present in both WT and diabetic rats, Wnt3-expressing cells seemed to be decreased in the GL and GCL regions of diabetic versus WT rats on day 20 (Fig. 5A). Indeed, the percentage of Wnt3+GFAP+ astrocytes is dramatically decreased in STZ-induced diabetes (Fig. 5B). It showed that Wnt3-expressing astrocytes in the OB neurogenic niche decrease severely in diabetes. In addition, a substantial reduction in Wnt3 transcript expression was observed in diabetic versus WT rats on day 30 after STZ treatment (Fig. 5C). The reduction of Wnt3 transcript expression in diabetes occurred over time after diabetes induction. Similarly, Wnt3 protein expression was remarkably inhibited on days 10 and 30 in diabetic rats (Fig. 5D). These results indicated that Wnt3 production was seriously inhibited in diabetic rats, although expression of the astrocyte-specific marker GFAP was observed in both WT and diabetic rats, suggesting inhibition of Wnt3 production in astrocytes of the OB neurogenic niche.
FIGURE 5.
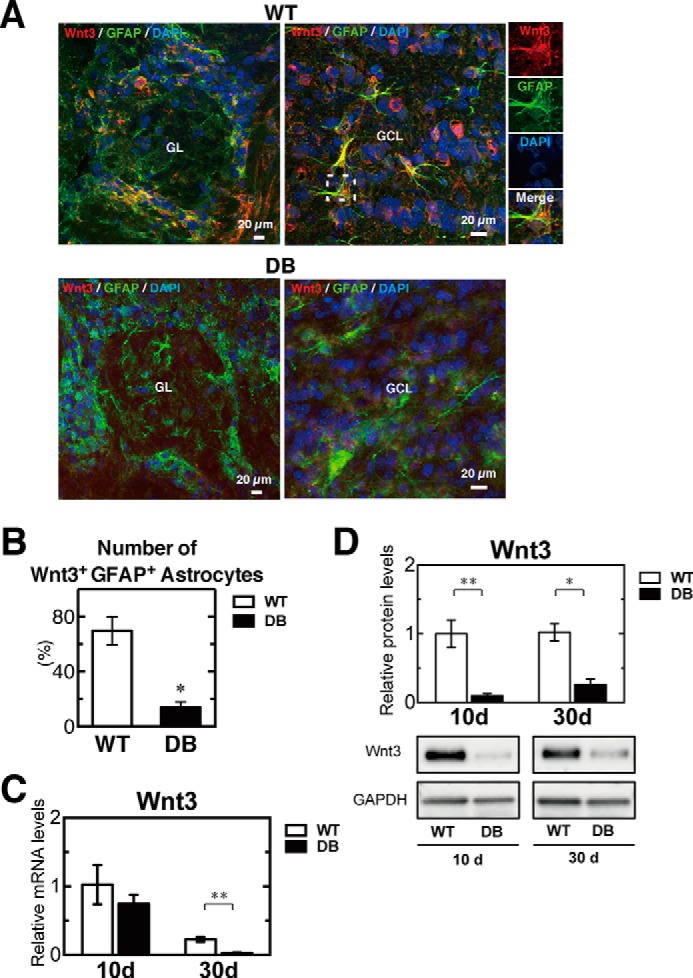
Diabetes causes severe reduction of Wnt3 expression in the OB. Immunohistochemical analysis of Wnt3 in the OB of wild-type (WT) and diabetic (DB) rats at 20 days after STZ treatment. Wnt3 (red) expression was abundant and co-localized with GFAP (green) in the GL (left) and in GCL (right) of the WT (A, top) and DB rats (A, bottom). Nuclei were also labeled by DAPI (blue). B, percentage of the number of Wnt3+GFAP+ astrocytes in OB. Wnt3 expression was abundantly reduced in the OB of DB rats. C, relative mRNA levels of Wnt3 in the OB of WT (n = 4) and DB (n = 4) rats at 10 and 30 days (d) after STZ treatment, determined by qRT-PCR analysis. All data were normalized to the levels of GAPDH mRNA as an internal control and indicated as the ratio relative to that in the WT at 10 days. D, quantification of relative protein levels of Wnt3 in the OB of WT (n = 3) and DB (n = 4) rats at 10 and 30 days after STZ treatment. The protein expression levels were normalized to GAPDH expression and indicated as the ratio relative to that in the WT at 10 days. Representative bands are shown at the bottom of the graph. White bars, WT; black bars, DB. Data are represented as mean ± S.D. (n = 4). *, p < 0.05; **, p < 0.01 versus corresponding WT.
Diabetes Inhibits Wnt Canonical Signaling and Its Downstream Targets in OB
We explored the activation of Wnt signaling and Wnt target factors by real time qPCR and Western blotting. In the canonical Wnt signaling pathway, Wnt binds to its receptor Frizzled and a transmembrane protein called low-density lipoprotein receptor-related protein. Binding of Wnt to Frizzled and lipoprotein receptor-related protein triggers a series of events that disrupts the β-catenin destruction complex, resulting in stabilization and accumulation of β-catenin in the cytoplasm. In the absence of a Wnt ligand, cytoplasmic β-catenin is phosphorylated by phosphorylated GSK3β (p-GSK3β) and is targeted for degradation by the proteasomal machinery. The increased stability of β-catenin following Wnt activation enables translocation to the nucleus and binding to T cell-specific transcription factor/lymphoid enhancer-binding factor 1 transcription factors and mediates transcriptional induction of target genes (38–40). GSK3β and p-GSK3β protein levels were reduced on days 10 and 30 in diabetic rats (Fig. 6A). In addition, the expression of β-catenin was reduced on day 30 after STZ treatment. These data suggest the reduction of Wnt3 leads to down-regulation of Wnt/β-catenin signaling in the OB.
FIGURE 6.

Down-regulation of Wnt signaling and its targets in STZ-induced diabetes. A, representative Western blot bands of GSK3β, phosphorylated GSK3β (p-GSK3β), β-catenin, and GAPDH in the OB of wild-type (WT) and diabetic (DB) rats at 10 and 30 days (d) after STZ treatment (left). Quantification of relative protein levels of GSK3β, p-GSK3β, and β-catenin in the OB of WT (n = 4) and DB (n = 4) rats at 10 and 30 days after STZ treatment (right). The protein expression levels were normalized to Gapdh expression and indicated as the ratio relative to that in the WT at 10 days. B, quantification of relative Neurod1 mRNA levels by qRT-PCR (left). Quantification of relative NeuroD1 protein levels by Western blotting analysis and its representative Western blotting bands (right). C, quantification of relative DCX mRNA levels by qRT-PCR (left). Quantification of relative DCX protein levels by Western blotting analysis and its representative Western blotting bands (right). Neurod1 and Dcx mRNA and protein expression were normalized to the corresponding Gapdh mRNA and protein levels as an internal control and indicated as a ratio relative to that in the WT at 10 days. White bars, WT; black bars, DB. Data are represented as mean ± S.D. (n = 4). *, p < 0.05; **, p < 0.01 versus corresponding WT.
NeuroD1 is a target of Wnt3 regulation and induces terminal neuronal differentiation in the OB (41). Transcript expression of NeuroD1 was suppressed on days 10 and 30 after diabetes induction and was accompanied by a reduction in protein levels on day 30, consistent with Wnt3 expression in diabetic rats (Fig. 6B). A neuronal precursor marker, doublecortin (DCX), is also a Wnt3 target (29, 42). Expression of DCX transcripts was reduced on day 10 and was maintained at low levels in WT and diabetic rats on day 30 (Fig. 6C). DCX protein expression was remarkably reduced in diabetic rats on day 30 after STZ treatment. These results suggest reduction of Wnt3 expression leads to a reduction in the transcript and protein expression of target genes.
Behavioral Alteration in STZ-induced Diabetes
Several lines of evidence suggest inhibition of Wnt signaling causes impairment of adult neurogenesis in the hippocampus and results in cognitive decline (42–44). Because the expression of Wnt3 and its target genes was reduced in the OB of diabetic rats (Fig. 6), behavioral alterations were evaluated using a hole-board test for odor discrimination, a novel object recognition test for recognition memory, and an elevated plus maze test for anxiety. The percentage of head-dips and time spent in the food-scented hole was considerably reduced in diabetic rats on days 10 and 30 after STZ treatment (Fig. 7A). The results indicated poor odor discrimination and a severe loss of olfactory function in diabetes. During habituation in the novel object recognition test, all groups of rats spent equivalent time exploring the identical objects (left and right) (data not shown). In the trial, the discrimination index was significantly lower in diabetic than WT rats on days 10 and 30 (Fig. 7B). WT rats spent more time with the novel object, although diabetic rats could not discriminate between the novel and familiar objects on days 10 and 30, consistent with prior studies (26, 45, 46). In the elevated plus maze test, the percentage of entries and time spent in the open arms was significantly reduced in diabetic rats on days 10 and 30 (Fig. 7C). These data suggest diabetes contributes to the impaired olfactory-related exploratory behaviors, reduces learning and memory function, and increases anxious behaviors. Thus, the decrease in neurogenesis in the OB because of insulin deficiency may be involved in the functional impairment of olfactory performance.
FIGURE 7.
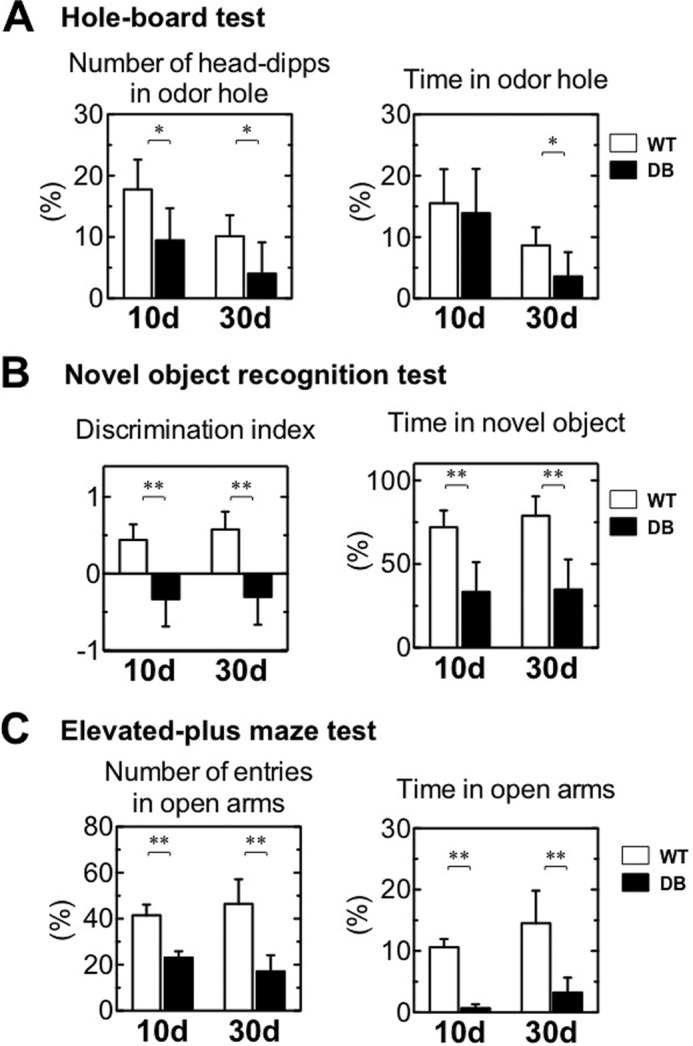
Behavioral analysis of rats with induced diabetes. A, hole-board test. Percentage of the number of head dips and time in the odor hole performed by the wild-type (WT, n = 6) and diabetic (DB, n = 6–8) rats at 10 and 30 days (d) after STZ treatment. B, novel object recognition test. Discrimination index and percentage of time spent with the novel object for the WT (n = 6) and DB (n = 6) at 10 and 30 days after STZ treatment. C, elevated-plus maze test. Percentage of the number of entries in open arms and time in open arms for WT (n = 4–5) and DB (n = 4) rats at 10 and 30 days after STZ treatment. White bars, WT; black bars, DB. Data are represented as mean ± S.D. (n = 4–8). *, p < 0.05 versus corresponding WT; **, p < 0.01 versus corresponding WT. Statistical significance was determined by Student's t test.
GAT1 Inhibition Impairs Wnt3-stimulated Neuronal Differentiation in STZ-induced Diabetes
Recent studies suggest GABA may play a role in the regulation of adult neurogenesis through GABAA receptors (47–50). Alterations in GABAergic systems in the OB of diabetic rats were examined by analyzing the gene expression of GABAA receptor α2 (GABAARα2) and of GABA transporter (GAT) 1 and 3, which remove extracellular GABA after its release from the synaptic vesicle into the synaptic cleft. GAT1 transcript levels were substantially reduced on days 10 and 30 after diabetic induction. GAT3 transcript expression was reduced on day 10 in diabetic rats, but the difference was not significant until day 30. Transcript levels of GABAARα2 did not differ between WT and diabetic rats (Fig. 8A). Reductions in GAT1 and insulin protein expression were demonstrated by immunohistochemistry in diabetic rats (Fig. 8B). The reduction of GAT1 protein expression was validated by Western blotting (Fig. 8C), suggesting that insulin deficiency induces reduction in GAT1 expression and may impair GABA uptake.
FIGURE 8.
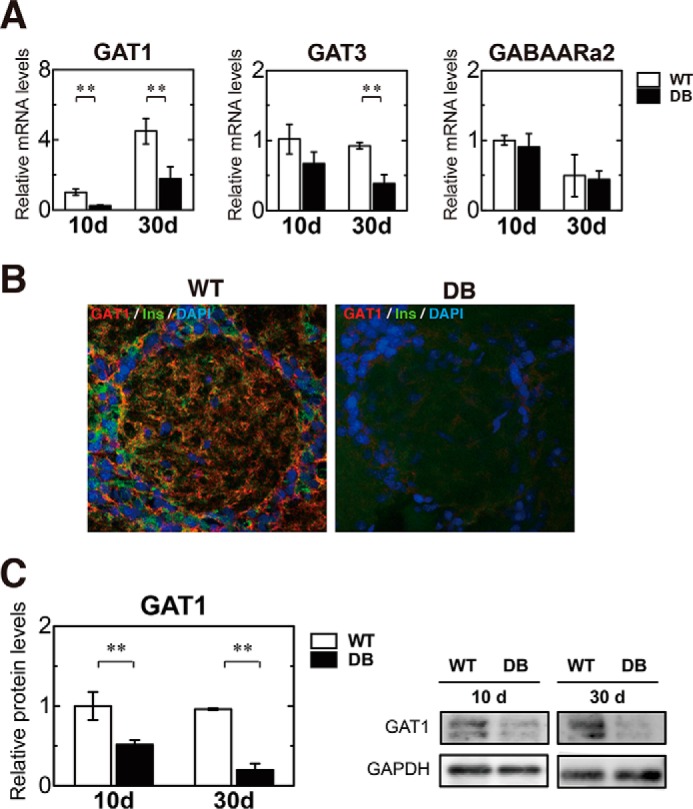
Severe reduction in GATs in STZ-induced DB rats. A, quantification of relative mRNA levels of GAT1, GAT3, and GABAARα2 in the OB of wild-type (WT, n = 4) and diabetic (DB, n = 4) rats at 10 and 30 days after STZ treatment, determined by qRT-PCR analysis. All data were normalized to the levels of GAPDH mRNA as an internal control and indicated as the ratio relative to that in the WT at 10 days. B, immunohistochemical analysis of GAT1 (red) and insulin (green) in the OB of WT (left) and DB (right) rats at 20 days after STZ treatment. Expression of GAT1 and insulin were abundant in the OB of the WT but severely inhibited in the DB. Nuclei were also labeled by DAPI (blue). C, quantification of relative GAT1 protein levels in the OB of WT and DB at 10 and 30 days after STZ treatment by Western blotting analysis (left) and its representative Western blotting bands (right). White bars, WT; black bars, DB. Data are represented as mean ± S.D. (n = 3). **, p < 0.01 versus corresponding WT.
GABA and glutamate are the principal inhibitory and excitatory neurotransmitters, respectively, in the mammalian central nervous system (51) and are thereby involved in cognition, memory, and learning. Excitatory amino acid transporters (EAATs) mediate uptake of glutamate from the neural cleft, although VGLUT transports glutamate into synaptic vesicles. The glutamatergic system was explored by assessing expression of EAAT1–3, vesicular glutamate transporter (VGLUT) 1, VGLUT2, and N-methyl-d-aspartate receptor R1. EAATs mediated uptake of glutamate from the neural cleft, although VGLUT transported glutamate into synaptic vesicles. In the diabetic rat group, transcript levels of EAAT1–3 were suppressed on day 10 and of EAAT2 and -3 were suppressed on day 30 after STZ treatment (Fig. 9A). In diabetic rats, VGLUT1 and -2 mRNA expression levels were markedly decreased on day 10, although these expression levels were significantly increased on day 30 in comparison with those for the WT (Fig. 9B, left and middle). Transcript expression of the glutamate receptor N-methyl-d-aspartate receptor R1 did not differ between WT and diabetic rats (Fig. 9B, right). Thus, diabetes also modulates the expression of glutamate transporters for the first 10 days after induction, suggesting diabetes-induced adverse effects may be seen in not only GABAergic but also glutaminergic transmission in the OB.
FIGURE 9.
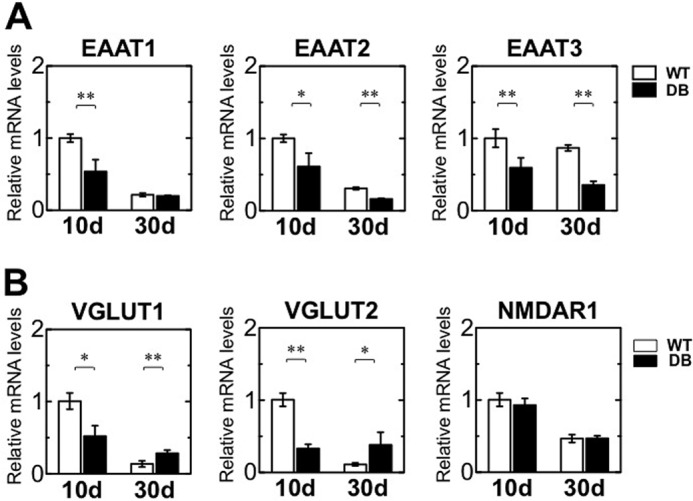
Modification of glutamatergic neurotransmitter systems in the OB. Relative mRNA levels of Eaat1, Eaat2, and Eaat3 (A) and of Vglut1, Vglut2, and Nmdar1 (B) in the OB of wild-type (WT, n = 4) and diabetic (DB, n = 4) rats at 10 and 30 days after STZ treatment, as determined by qRT-PCR analysis. All data were normalized to the levels of Gapdh mRNA as an internal control and indicated as the ratio relative to that in the WT at 10 days. White bars, WT, black bars, DB. Data are represented as mean ± S.D. (n = 3–6). *, p < 0.05; **, p < 0.01 versus corresponding WT.
Because GAT1 expression was reduced on days 10 and 30, we evaluated neuronal differentiation after inhibiting GAT1 activity in vitro. The GAT1-selective inhibitor SKF89976A was added to NSCs at 0 to 100 μm in vitro. Expression of Wnt3 mRNA was consistently down-regulated in the presence of the GAT1 inhibitor (Fig. 10), although the astrocyte marker GFAP mRNA expressions were increased dose-dependently in the presence of the GAT1 inhibitor. Consistent with Wnt3 expression, the inhibition of GAT1 activity also resulted in a decrease in NeuroD1 and TUBB3 transcripts in a dose-dependent manner. These results demonstrate that GAT1 inhibition suppresses expression of Wnt3 and NeuroD1, factors essential for early neuronal differentiation, and of TUBB3, an immature neuronal marker, but they increase the expression of GFAP. The inhibition of Wnt3-induced neuronal differentiation in diabetes is most likely due to inactivation of GAT1.
FIGURE 10.
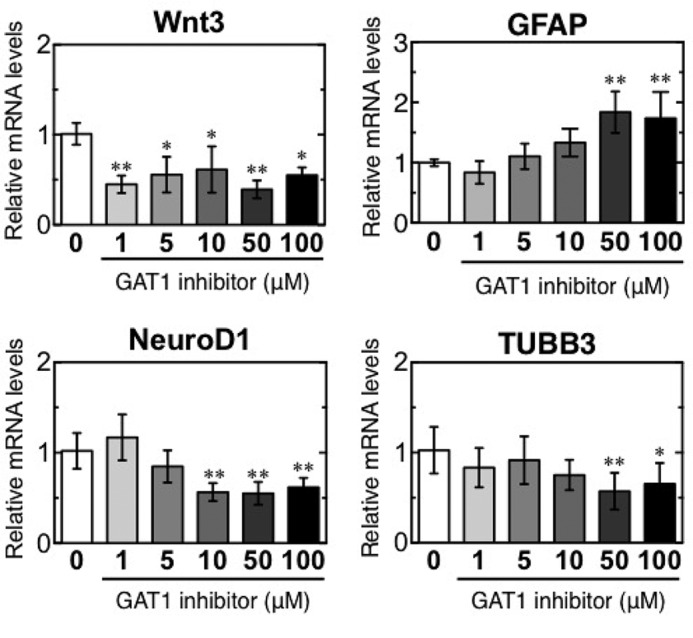
GAT1 inhibition impairs Wnt3-induced neuronal differentiation in vitro. Quantification of relative mRNA levels of Wnt3, NeuroD1, and TUBB3 in NSCs after a 24-h treatment with the GAT1-selective inhibitor SKF89976A (1, 5, 10, 50, and 100 μm). *, p < 0.05 versus corresponding WT; **, p < 0.01 versus corresponding values for medium alone (GAT1 inhibitor = 0).
To examine the importance of insulin activity in neurogenesis, we evaluated neuronal differentiation after insulin treatment at 0, 10, and 100 ng/ml in vitro. On treatment with 100 ng/ml insulin, the mRNA expression of Wnt3, GFAP, Tubb3, and Syn1 considerably increased; moreover, the level of NeuroD1 expression was significantly increased, albeit slightly, by insulin treatment (Fig. 11A). This finding suggested that insulin acts as a supportive factor to promote neurogenesis by the activation of Wnt3-induced neurogenesis. Then, to evaluate whether insulin restored the inhibition of neurogenesis induced by the GAT1 inhibitor, insulin (0 or 100 ng/ml) was added to NSCs after GAT1 inhibitor administration (0 or 50 μm) in vitro. The GAT1 inhibitor considerably inhibited Wnt3 mRNA expressions, although insulin recovered its reduction by the GAT1 inhibitor (Fig. 11B). GFAP mRNA expressions were increased by both GAT1 inhibitor and insulin. A profound decrease in Neurod1 and Tubb3 expression was also observed on the addition of the GAT1 inhibitor, and the inhibition of Neurod1 and Tubb3 mRNA expression by the GAT1 inhibitor was significantly moderated by insulin treatment. This result suggests the potential function of insulin in helping to recover the decrease in neurogenesis. GFAP mRNA expressions were increased by the presence of both the GAT1 inhibitor and insulin at considerable levels. However, Wnt3 mRNA expressions were increased by insulin but decreased by GAT1 inhibitor. This suggests that GAT1 inhibition effects the Wnt3 production in astrocytes but that insulin could help to promote the production.
FIGURE 11.

Insulin promotes neurogenesis in vitro. A, quantification of relative mRNA levels of Wnt3, Neurod1, and Tubb3 in NSCs after 24-h treatment with insulin (0, 10, 100 ng/ml). *, p < 0.05; **, p < 0.01 versus corresponding values for medium alone (insulin = 0) Statistical significance was determined by Student's t test. B, quantification of relative mRNA levels of Wnt3, GFAP, Neurod1 and Tubb3 after 24-h treatment with GAT1 inhibitor (0 and 50 μm) and Insulin (0 and100 ng/ml). Statistical significance was determined by two-way analysis of variance with Bonferroni's post hoc test. *, p < 0.05; **, p < 0.01 versus corresponding values in the medium without insulin treatment in the same GAT1 inhibitor treatment. #, p < 0.05; ##, p < 0.01 versus corresponding values in the medium without GAT1 inhibitor treatment in the same insulin treatment.
Discussion
The SVZ produces NSCs, which are also produced in the OB core (5–8). In addition to the OB core, this study demonstrated the expression of multipotent stem cell marker Sox2 in the GL of OB, suggesting that GL is the another source of NSCs in OB. In addition, NSCs, neurons, astrocytes, and oligodendrocytes in OB did not co-localize, suggesting the lineage commitment is strictly controlled.
Wnt3 is as an astrocyte-derived factor that promotes neuronal differentiation of adult hippocampal NSCs (29, 36). In this study, Wnt3 expression was observed in the rat OB, suggesting that Wnt3 regulates the adult neurogenesis there as it does in the hippocampus. We also provide evidence of the adverse effect of diabetes on neurogenesis in the OB and on OB function, and we identify the molecular mechanism by which neurogenesis is impaired in diabetes. STZ-induced diabetes had a particular effect on OB neurogenesis due to inhibition of Wnt3-mediated signaling and expression of its target genes, NeuroD1 and DCX. Down-regulation of NeuroD1 inhibits neural differentiation and reduces the number of mature neurons. In addition, STZ-induced diabetic rats showed several behavioral changes, including impaired olfactory function, deficits in learning and memory, and an increase in anxiety that can be attributed to the inhibition of GABA and glutamate transporters. Interestingly, inhibition of GAT1, which modulates local levels of GABA, suppressed Wnt3-regulated neuronal differentiation in vitro. These data suggest the alterations in GABAergic and glutamatergic neuronal systems could contribute to the down-regulation of Wnt3-induced neuronal differentiation in the OB of diabetic rats, thus leading to the impairment of olfactory function. Furthermore, our results indicated that insulin promotes the Wnt3-induced neurogenesis, even in the presence of the GAT1 inhibitor in vitro, supporting that insulin plays a supportive role in neurogenesis.
Growing evidence suggests GABA has a major role in survival, proliferation, migration, synapse formation, and integration of newly formed neurons into synaptic networks (50, 52–54). GABA is synthesized and released by neuroblasts (47, 49, 50). GABAA receptors are expressed in both neuroblasts and stem cells, and they are activated by local GABA (47–50). In the SVZ, GABA serves as a negative regulator for proliferation of NSCs and neuroblasts (50, 55) and migration (49). Thus, GABA activation is an important neurogenic niche signal to stop neuronal production. In the SVZ, the GABA transporter GAT3 is expressed in astrocyte-like NSCs and GAT1 in neuroblasts (49, 56). Electrophysiological studies have indicated that GAT1 and GAT3 in the SVZ reduce local GABA levels and limit GABAA receptor activation in astrocyte-like NSCs (50). These recent studies suggest that GATs regulate neurogenesis by maintaining ambient GABA levels. We also demonstrated that impairment of GAT1 in diabetic rats and a GAT1 inhibitor disturbs Wnt3-induced neuronal differentiation of NSCs in vitro. GAT1 and GAT3 are localized in the OB (57). The expression of these GATs and adult neurogenesis in the OB were impaired in STZ-induced diabetes in this study. Therefore, we suggest GABA uptake by GATs is critical for the maintenance of adult neurogenesis in the OB, and insulin regulates GAT1 activities. In addition, the correlation of GAT1 reduction with lower insulin expression was observed in OB, suggesting that insulin plays a crucial role in the maintenance of GAT1 function and GABA uptake. This study also showed that insulin stimulates Wnt3-induced neurogenesis and moderately inhibits the neurogenesis induced by the GAT1 inhibitor in vitro. Thus, it is suggested insulin may act as a supportive factor to promote the adult neurogenesis. The expression of GATs and the glutamate transporters EAATs and vGLUTs changed in diabetes in this study. Glutamate transporters may also be involved in the adult neurogenesis. Further studies are needed to elucidate the possible roles of GABA and glutamate transporters on the neurogenesis and insulin regulation of GATs and EAATs.
Diabetes impairs neurogenesis and synaptic neuronal plasticity, hampers hippocampal learning and memory, and increases anxiety-like behaviors in diabetic rats and mice (24–26). STZ-induced animals showed deficits in learning and memory in the Morris water maze and novel object recognition tests (26). Therefore, diabetes-associated cognitive deficits may be attributed to the reduction in hippocampal neurogenesis. In the hippocampus of STZ-induced diabetic rats, Wnt3 and insulin were reduced (28). Reduction in Wnt3-regulated neurogenesis was also observed in the OBs of STZ-induced diabetic rats; thus, Wnt3-induced neurogenesis in the OB and hippocampus of diabetic rats may occur in a similar fashion.
Wnt3-producing astrocytes are present only in the neurogenic niches. According to our results, it is evident that the number of Wnt3+GFAP+ astrocytes was dramatically reduced in STZ-induced diabetes, and GAT1 inhibition is involved in the decrease of Wnt3 production in astrocytes during neuronal differentiation. This suggests the involvement of the GAT1 inhibition in the decrease of Wnt3-producing GFAP+ astrocytes in STZ-induced diabetes. In the study by Coleman et al. (59), insulin treatment prevented a decrease in GFAP expression in the hippocampus of untreated diabetic rats. This study also showed that insulin helped to increase Wnt3 and GFAP expression and recovery from the impaired neurogenesis by the GAT1 inhibition in vitro. Insulin may increase the number of Wnt3-secreting astrocytes in the neurogenic niches and activate Wnt3-inducing neurogenesis.
GFAP expression was shown to be severely decreased in the OB (34) and hippocampus in STZ-induced diabetes (59, 60). In this study, GFAP mRNA expressions were, however, increased by GAT1 inhibition in vitro, suggesting that diabetic conditions induce the decrease of GFAP expressions in the STZ-induced diabetic rats. It was reported that astrocytes are highly sensitive to acidic conditions (58), and the junctional communication among astrocytes is impaired in STZ-induced diabetes and cultured astrocytes (61). Accordingly, it is supposed that acidic conditions in diabetes alter GFAP expressions and astrocyte functions directly in STZ-induced diabetes.
It is also evident that glucocorticoid mediated the reduction of neurogenesis in dentate gyrus and SVZ in recent studies (62–64). Glucocorticoids were shown to decrease astrocyte proliferation (65, 66). Interestingly, glucocorticoid treatment in astrocyte culture showed a decrease in Wnt7 expression (66). Wnt7 is a Wnt family member, and it promotes neurogenesis similarly to Wnt3. Wnt3 expression in STZ-induced diabetes may also decrease in response to glucocorticoids. In addition to Wnt3, BDNF has also been implicated in adult neurogenesis, survival, and synaptic plasticity in the hippocampus (67, 68). Impairments of neurogenesis, spatial learning, and memory are observed in a BDNF-deficient animal model (69, 70). BDNF expression also decreased in the hippocampus of STZ-induced diabetic rats (71). It is reported that elevated levels of glucocorticoid reduce BDNF expression (72, 73). Thus, glucocorticoid-mediated inhibition of Wnt7a and BDNF might be involved in the suppression of neurogenesis in the OB of STZ-treated rats.
This study showed that the neurogenic niche of OB NSCs was mostly localized in the GL, although most mature neurons were present in the GCL. NSCs, neurons, astrocytes, and oligodendrocytes in the OB were morphologically distinct from each other, which suggests the lineage commitment from NSCs is strictly controlled. We also provide evidence that diabetes inhibits Wnt3-induced neuronal differentiation in the OB and alters neurotransmitter systems such as GABA and glutamate transporters. Diabetes led to several behavioral deficits, including impaired odor-mediated behavior, learning and memory, and increased anxiety. Thus, diabetes caused decreases in neurogenesis and malfunctions of the olfactory and other brain areas, perhaps contributing to these behavioral deficits. In addition, the impairment GATs and EAATs was found in the diabetic rats, and GAT1 inhibition disturbed Wnt3-induced neuronal differentiation of NSCs in vitro. Therefore, this suggests that alterations in GABA transporters lead to a decrease in Wnt3-induced neurogenesis and several behavioral deficits in diabetes. Not only GABA but also glutamate transporter systems were found to be altered in diabetes. It is presumed that the regulation of local GABA and glutamate neurotransmitter levels is important for the maintenance of adult neurogenesis in the OB and that insulin helps to maintain GABA and glutamate transporter activities. Thus, insulin is believed to be essential for the control of GABA and glutamate transporter activities, which in turn affect Wnt3-induced neurogenesis and olfactory functions. In addition, insulin was found to help promote neurogenesis and moderate the decrease in neurogenesis induced by GAT1 inhibition in vitro. As such, insulin may be an important factor for the maintenance of neurogenesis.
Experimental Procedures
Animals
Fisher 344 male rats (∼4 months old) weighing 70–100 g were used in this study. All animals were maintained in a 12-h light/12-h dark cycle in a controlled temperature and relative humidity environment with standard rat chow and drinking water available ad libitum. To induce diabetes, animals were treated with a single intraperitoneal (i.p.) injection of 70 mg/kg STZ (Wako, Osaka, Japan) dissolved in saline (74, 75). Blood glucose levels were measured for 3 days after STZ administration. Rats with blood glucose levels greater than 300 mg/dl were considered diabetic. OBs were harvested from the rats at 10, 20, and 30 days after STZ injection. To label proliferating progenitor cells, BrdU (200 mg/kg, i.p.) was administered the STZ and analyzed in OBs isolated 20 days after diabetes induction.
All animals were anesthetized with pentobarbital sodium (100 mg/kg) and quickly perfused with saline. Collected brain and OB samples were fixed in 4% paraformaldehyde solution. All animal protocols were approved by the Institutional Animal Care and Use Committee (IACUC) of the National Institute of Advanced Industrial Science and Technology.
Immunohistochemistry
Samples fixed with 4% paraformaldehyde overnight were placed in 30% sucrose solution until the tissues sank. Coronal sections (40 μm) were collected and stored in tissue collection medium (25% glycerin, 30% ethylene glycol, 0.05 m phosphate) at −20 °C. For the immunohistochemical detection of BrdU, sections were incubated in 50% formaldehyde at 65 °C for 90 min. After washing with Tris-buffered saline containing 0.25% Tween 20 (TBS-T) for 15 min, the sections were placed in 1 n HCl at 37 °C for 15 min and then incubated in 0.1 m borate buffer, pH 8.5, for 10 min.
Sections were washed with 3% normal donkey serum in 0.25% TBS-T for 15 min and then incubated with primary antibodies at 4 °C for 3 days. After washing with 0.25% TBS-T for 15 min, sections were treated with secondary antibodies overnight at 4 °C. Finally, sections were washed twice with 0.25% TBS-T and mounted (Vectashield; Vector Laboratories). Primary antibodies included the following: rabbit anti-Sox2 (1:300, Millipore); mouse anti-NeuN (1:100; clone A10); mouse anti-NeuroD1 (1:100; Abcam); rabbit anti-TUJ1 (1:100; Promega, Madison, WI); mouse anti-MBP (1:100; Abcam); guinea pig anti-GFAP (1:100; Advanced Immunochemical, Long Beach, CA); rabbit anti-Olig2 (1:100; Millipore); mouse anti-S100β (1:100; Abcam); goat anti-Wnt3 (1:300; Everest Biotech Ltd., Oxfordshire, UK); rabbit anti-GAT1 (1:100; Abcam); rabbit anti-insulin (1:100; Santa Cruz Biotechnology); DAPI (Wako, Osaka, Japan), and rat anti-BrdU (1:400; Abcam). For visualization, the following were used with DAPI counterstaining: Cy3-conjugated donkey anti-mouse, anti-rabbit, anti-rat, or anti-goat IgG (1:500, Jackson ImmunoResearch Laboratories); Cy5-conjugated donkey anti-rat IgG (1:500, Jackson ImmunoResearch Laboratories); and AlexaFluor 488-conjugated donkey anti-mouse or anti-rabbit IgG (1:500; Molecular Probes, Eugene, OR). Sections were imaged with a Carl Zeiss LSM confocal imaging system (LSM 510; Carl Zeiss, Tokyo, Japan) or an Olympus FV1000-D confocal microscope (Olympus Corp., Tokyo, Japan). For the quantification of Wnt3-secreting astrocytes, the number of GFAP-positive cells and Wnt3 and GFAP double-positive cells was counted, and then the ratio of Wnt3-GFAP double-positive cells/GFAP-positive cells in control and STZ-induced diabetes was calculated.
RNA Extraction and qPCR
Isolated OBs were immediately stored in ISOGEN solution at −20 °C. Total RNA was isolated using ISOGEN (Wako) on ice according to the manufacturer's instructions, dissolved in diethyl pyrocarbonate-treated water, and stored at −20 °C. Extracted RNA was treated with DNase I (Life Technologies, Inc.) for 30 min at 37 °C to remove genomic DNA. cDNA synthesis was performed with SuperScript III (Life Technologies, Inc.) or PrimeScript RT Master Mix (TAKARA Bio., Otu, Japan) according to the manufacturer's protocols. qPCR was performed with a Chromo4 system (Bio-Rad) and Thunderbird SYBR qPCR Mix (Toyobo, Osaka, Japan). All cDNAs were diluted 50-fold with diethyl pyrocarbonate-treated water. Primers were synthesized by Life Technologies, Inc., Japan (Table 1), and qPCR was performed as follows: 40 cycles each of denaturation at 95 °C for 15 s and annealing and extension at 60 °C for 40 s. Gapdh expression was used as the internal control. The ΔΔCt method was used to calculate the relative quantity of each target gene and normalized to Gapdh in each sample.
TABLE 1.
Primers used in qRT-PCR analysis
| Gene | GenBankTM | Forward primer | Reverse primer |
|---|---|---|---|
| Sox2 | NM_001109181.1 | CATGGACAGCTACGCGCACATGAA | TCTGCGAGCTGGTCATGGAGTTGT |
| Nestin | NM_012987 | TGGAGCAGGAGAAGCAAGGT | CCAGGTGTCTGCAACCGAGA |
| TUBB3 | NM_139254 | CGAGTGAAGTCAGCATGAGGGA | AGTTGCCGCTGGGGTCTATG |
| SYN1 | X04655 | GCCTACATGAGGACATCAGTGTC | TCCACTGCGCAGATGTCAAGT |
| Olig2 | NM_001100557 | AACAGAGACCCGAGCCAACA | CCCGGAGACGATCTAGGCTTT |
| MBP | AF439750 | CTCTGGCCACTTCTCACTTTA | GCATCCAGGGCAGCGACTTG |
| GFAP | NM_017009.2 | TGGAGGGCGAAGAAAACCGCATCA | TTAATGACCTCGCCATCCCGCATCT |
| S100b | NM_013191 | TTGGACACCGAAGCCAGAGA | AGCTTGTGCTTGTCACCCTC |
| Wnt3 | NM_001105715.1 | TTGCGTCTTCCACTGGTGCTGCTA | AGCTGGCAATCGTCCTTGCTCCTT |
| NeuroD1 | NM_019218.2 | AAGAAGGAGGATGAGCTTGA | CTCCTCTTCCTCCTCTTCCA |
| DCX | NM_053379 | TCACAGCATCTCCACCCAACC | TGCCTGCAAGGTTCTGGTTCT |
| EAAT1 | NM_019225 | GCCGCCATTTTCATCGCTCA | AGGCCCACAGATGTCAGCAC |
| EAAT2 | NM_017215.2 | TGCAGTGTTGAGGAAGAACCTTG | TTGTAAAGGAAGCCTGTTTAGAGCA |
| EAAT3 | NM_013032 | CTCCACCACCGTCATTGCT | TGGCAGGCTTCACTTCTTCAC |
| VGLUT1 | NM_053859 | GTGGGCTTCAGTGGCTTTGCTA | AGGGAGGCTATGAGGAACACGTA |
| VGLUT2 | NM_053427 | TCCGCTGTAACCTGGGTGTG | GCCCGGAATCTGCGTGATGA |
| NMDAR1 | X63255 | GGGTCTTCATGCTGGTGGCT | TCGGGCTCTGCTCTACCACT |
| GAT1 | NM_017335 | AATGGGGTTCTAATCACAGCTCTAC | TGAGCCAACAGGGAGCAGAT |
| GAT2 | NM_133623 | ACACAAGCGCATCCGGTAGA | GTCGTTCCCGAGACCCTGTT |
| GAT3 | NM_024372 | TGTGCTACAAGAACGGCGGA | CGCCTCGATCACCTGTGTTG |
| GABAARα2 | NM_001135779 | CGCGTTTGTGTTCTCTGCCTT | AGATTCGGGGCGTAGTTGGC |
| GAPDH | AF106860.2 | GTATGTCGTGGAGTCTACTG | CTTGAGGGAGTTGTCATATTTC |
Western Blotting
Protein expression was analyzed as described previously (76). OBs were homogenized in lysis buffer (50 mm HEPES-KOH, pH 7.4, 150 mm NaCl, 10 mm EDTA, 10 mm NaF, 10 mm Na4P2O7, 2 mm Na3VO4, 1% Nonidet P-40, 1% sodium deoxycholate, 0.2% SDS) containing protease inhibitor mix (Nacalai Tesque, Kyoto, Japan) on ice (77). Samples were then centrifuged at 17,500 × g for 30 min at 4 °C and the supernatants collected. Lysate protein concentrations were quantified with a BCA protein assay kit (Thermo Fisher Scientific, Rockford, IL) and diluted with loading sample buffer (62.5 mm Tris-HCl, pH 6.8, 5% β-mercaptoethanol, 2% SDS, 5% sucrose, and 0.005% bromphenol blue). Equal amounts of protein were separated in SuperSep gels (Wako) and transferred to PVDF membranes (Millipore). After blocking in 10% Blocking One (Nacalai Tesque) in 0.05% TBS-T for 1 h, blots were incubated with primary antibodies at 4 °C overnight. For immunodetection, the following primary antibodies were used: rabbit anti-GAPDH (1:5000; Santa Cruz Biotechnology); rabbit anti-Sox2 (1:1000; Millipore); mouse anti-Nestin (1:500; Pharmingen); mouse anti-TUJ1 (1:10,000; Promega); mouse anti-synapsin 1 (1:10,000; Transduction Laboratories); rabbit anti-Olig2 (1:1000; Millipore); mouse anti-MBP (1:1000; Abcam); rabbit anti-GFAP (1:10,000; DAKO); mouse anti-S100β (1:1000; Abcam), rabbit anti-Wnt3 (1:5000; Santa Cruz Biotechnology), rabbit anti-β-catenin (1:2000; Cell Signaling Technology); rabbit anti-GSK3β (1:2000; Cell Signaling Technology); rabbit anti-phospho-GSK3β (1:2000; Cell Signaling Technology); mouse anti-NeuroD1 (1:500; Abcam); rabbit anti-Doublecortin (1:1000; Santa Cruz Biotechnology); and rabbit anti-GAT1 (1:1000; Abcam). After several washes with 0.05% TBS-T, immunoreactive bands were detected with HRP-conjugated secondary antibodies and developed with SuperSignal West Femto Maximum Sensitivity Substrate (Thermo Fisher Scientific). The following HRP-conjugated secondary antibodies were used: donkey anti-rabbit and anti-mouse IgG (1:10,000, GE Healthcare). Protein bands were visualized with an LAS-3000 Imaging System (Fuji Film Corp, Tokyo, Japan) and quantified with ImageJ 1.32 software (National Institutes of Health, Bethesda, MD).
Behavior Analysis
Behavioral tests were performed in a gray acrylic box (60 × 60 × 60 cm) or the elevated plus maze and analyzed by EthoVision XT (Noldus, Wageningen, Netherlands). Cognitive function was assessed in animals 10 or 30 days after diabetic induction.
Hole-board Test
Olfactory-related exploratory behavior was measured with a hole-board apparatus consisting of a gray acrylic box with six round holes in the floor (4 cm diameter). One hole was food-scented and the others were empty; thus, the rat is expected to spend more time at and revisit the food-scented hole. In the trials, animals were placed on the center of the apparatus and allowed to freely explore for 10 min. Rodent behavior was recorded with a digital camera placed above the apparatus. The number of head-dipping events and time spent at the scented hole was calculated. The hole-board was carefully cleaned with 70% ethanol after each observation, and only one trial was conducted for each rat.
Novel Object Analysis
The object recognition task evaluates a rodent's ability to recognize a novel object in the environment as a way to assess recognition memory. This experiment is based on the observation that rats spend more time exploring a novel object than a familiar one (78). Prior to the test, rats were habituated to the test box for 10 min per day for 2 consecutive days. For habituation, two identical objects were positioned 15 cm away from the center. After a retention interval of 24 h, rats were placed back in the apparatus, wherein one of the objects was replaced with a novel one. Rats freely explored the objects and the open field for 10 min. Behavior and the time spent exploring each object were recorded with a digital camera placed above the apparatus. Each rat was tested only once, and objects were rinsed with 70% ethanol between trials and before the first trial. A discrimination index (time spent with object A − time spent with object B)/(total time exploring both objects) was calculated between the novel and familiar objects. The index varied between +1 and −1, where positive and negative scores indicate more or less time spent with the novel object, respectively. A discrimination index of 0 indicated equal exploration of both objects (79).
Elevated Plus Maze Test
The elevated plus maze apparatus consists of two open arms (50 × 10 cm) and two closed arms (50 × 10 × 40 cm) extending from a central platform elevated 50 cm above the floor. The arms were connected with a central quadrangular area (10 × 10 cm) to form a cross. The rats were placed on the central quadrangular area and allowed to move freely on the arms for 10 min. The frequency of entry into the open or closed arms and the time spent on each arm were recorded (80). The percentage of time spent in the open arms was interpreted as an index of fear and anxiety. Rodent behavior was recorded by a digital camera placed above the apparatus. The percentage of time spent in the open arms (100 × open/total) and the number of entries into the open and closed arms were calculated. Each rat was tested only once and the apparatus was carefully cleaned with 70% ethanol between each trial and before the first trial.
Cell Cultures
The adult rat hippocampal neural (HCN) cell line from the adult rat hippocampus was cultured as described (81, 82). Briefly, NSCs were cultured in Dulbecco's modified Eagle's medium/F-12 medium (DMEM/F-12, Life Technologies, Inc.) containing 1% antibiotic/antimycotic (Life Technologies, Inc.), 2 mm l-glutamine (Life Technologies, Inc.), 1% N2 supplement (Wako) and 20 ng/ml FGF-2 (Wako) in a 5% CO2 incubator at 37 °C. For neuronal differentiation, HCNs were cultured in DEME/F-12 containing 1 μm retinoic acid (Sigma) and 1 μm forskolin (Sigma). Cells were treated with the GAT1-selective inhibitor SKF89976A (Abcam; 0, 1, 5, 10, 50, and 100 μm) (83–86) or insulin (0, 10, and 100 ng/ml) during the neuronal differentiation for the indicated time periods and then collected for RNA isolation and qPCR analysis. To evaluate whether insulin rescued the neurogenesis hindered by the GAT1 inhibitor, HCNs were treated with insulin (0 or 100 ng/ml) after GAT1 inhibitor administration (0 or 50 μm) during neuronal differentiation. The next day, cells were collected for RNA isolation and qPCR analysis.
Statistical Analysis
For all animal experiments, the GAT1 inhibitor administration and insulin treatment experiments in culture were analyzed for statistical significance using Student's t tests. All data are presented as mean ± S.D. p < 0.05 was considered to be significant. GAT1 inhibitor and insulin in vitro co-treatment results were analyzed for statistical significance by two-way analysis of variance and Bonferroni's post hoc tests.
Author Contributions
T. K. conceived and coordinated the study and contributed to writing the manuscript. R. H. and T. W. designed, performed, and analyzed the experiments and wrote the manuscript. S. F. performed and analyzed the experiments. M. A. supervised and supported the research. All authors reviewed the results and approved the final version of the manuscript.
The authors declare no conflicts of interest with the contents of this article.
- SVZ
- subventricular zone
- STZ
- streptozotocin
- OB
- olfactory bulb
- EAAT
- excitatory amino acid transporter
- GAT
- GABA transporter
- GFAP
- glial fibrillary acidic protein
- MBP
- maltose-binding protein
- GCL
- granule cell layer
- qPCR
- quantitative PCR
- GL
- glomerular layer
- NSC
- neural stem cell
- BDNF
- brain-derived neurotrophic factor
- HCN
- hippocampal neural
- DCX
- doublecortin.
References
- 1. Eriksson P. S., Perfilieva E., Björk-Eriksson T., Alborn A. M., Nordborg C., Peterson D. A., and Gage F. H. (1998) Neurogenesis in the adult human hippocampus. Nat. Med. 4, 1313–1317 [DOI] [PubMed] [Google Scholar]
- 2. Gage F. H. (2000) Mammalian neural stem cells. Science 287, 1433–1438 [DOI] [PubMed] [Google Scholar]
- 3. Lois C., and Alvarez-Buylla A. (1993) Proliferating subventricular zone cells in the adult mammalian forebrain can differentiate into neurons and glia. Proc. Natl. Acad. Sci. U.S.A. 90, 2074–2077 [DOI] [PMC free article] [PubMed] [Google Scholar]
- 4. Pagano S. F., Impagnatiello F., Girelli M., Cova L., Grioni E., Onofri M., Cavallaro M., Etteri S., Vitello F., Giombini S., Solero C. L., and Parati E. A. (2000) Isolation and characterization of neural stem cells from the adult human olfactory bulb. Stem Cells 18, 295–300 [DOI] [PubMed] [Google Scholar]
- 5. Gritti A., Bonfanti L., Doetsch F., Caille I., Alvarez-Buylla A., Lim D. A., Galli R., Verdugo J. M., Herrera D. G., and Vescovi A. L. (2002) Multipotent neural stem cells reside into the rostral extension and olfactory bulb of adult rodents. J. Neurosci. 22, 437–445 [DOI] [PMC free article] [PubMed] [Google Scholar]
- 6. Liu Z., and Martin L. J. (2003) Olfactory bulb core is a rich source of neural progenitor and stem cells in adult rodent and human. J. Comp. Neurol. 459, 368–391 [DOI] [PubMed] [Google Scholar]
- 7. Giachino C., and Taylor V. (2009) Lineage analysis of quiescent regenerative stem cells in the adult brain by genetic labelling reveals spatially restricted neurogenic niches in the olfactory bulb. Eur. J. Neurosci. 30, 9–24 [DOI] [PubMed] [Google Scholar]
- 8. Moreno-Estellés M., González-Gómez P., Hortigüela R., Díaz-Moreno M., San Emeterio J., Carvalho A. L., Fariñas I., and Mira H. (2012) Symmetric expansion of neural stem cells from the adult olfactory bulb is driven by astrocytes via WNT7A. Stem Cells 30, 2796–2809 [DOI] [PubMed] [Google Scholar]
- 9. Palmer T. D., Markakis E. A., Willhoite A. R., Safar F., and Gage F. H. (1999) Fibroblast growth factor-2 activates a latent neurogenic program in neural stem cells from diverse regions of the adult CNS. J. Neurosci. 19, 8487–8497 [DOI] [PMC free article] [PubMed] [Google Scholar]
- 10. Kukekov V. G., Laywell E. D., Suslov O., Davies K., Scheffler B., Thomas L. B., O'Brien T. F., Kusakabe M., and Steindler D. A. (1999) Multipotent stem/progenitor cells with similar properties arise from two neurogenic regions of adult human brain. Exp. Neurol. 156, 333–344 [DOI] [PubMed] [Google Scholar]
- 11. Arsenijevic Y., Weiss S., Schneider B., and Aebischer P. (2001) Insulin-like growth factor-I is necessary for neural stem cell proliferation and demonstrates distinct actions of epidermal growth factor and fibroblast growth factor-2. J. Neurosci. 21, 7194–7202 [DOI] [PMC free article] [PubMed] [Google Scholar]
- 12. Hsieh J., Aimone J. B., Kaspar B. K., Kuwabara T., Nakashima K., and Gage F. H. (2004) IGF-I instructs multipotent adult neural progenitor cells to become oligodendrocytes. J. Cell Biol. 164, 111–122 [DOI] [PMC free article] [PubMed] [Google Scholar]
- 13. van Praag H., Schinder A. F., Christie B. R., Toni N., Palmer T. D., and Gage F. H. (2002) Functional neurogenesis in the adult hippocampus. Nature 415, 1030–1034 [DOI] [PMC free article] [PubMed] [Google Scholar]
- 14. Carleton A., Petreanu L. T., Lansford R., Alvarez-Buylla A., and Lledo P. M. (2003) Becoming a new neuron in the adult olfactory bulb. Nat. Neurosci. 6, 507–518 [DOI] [PubMed] [Google Scholar]
- 15. Kee N., Teixeira C. M., Wang A. H., and Frankland P. W. (2007) Preferential incorporation of adult-generated granule cells into spatial memory networks in the dentate gyrus. Nat. Neurosci. 10, 355–362 [DOI] [PubMed] [Google Scholar]
- 16. Kempermann G. (2002) Why new neurons? Possible functions for adult hippocampal neurogenesis. J. Neurosci. 22, 635–638 [DOI] [PMC free article] [PubMed] [Google Scholar]
- 17. Gheusi G., Cremer H., McLean H., Chazal G., Vincent J. D., and Lledo P. M. (2000) Importance of newly generated neurons in the adult olfactory bulb for odor discrimination. Proc. Natl. Acad. Sci. U.S.A. 97, 1823–1828 [DOI] [PMC free article] [PubMed] [Google Scholar]
- 18. Biessels G. J., van der Heide L. P., Kamal A., Bleys R. L., and Gispen W. H. (2002) Ageing and diabetes: implications for brain function. Eur. J. Pharmacol. 441, 1–14 [DOI] [PubMed] [Google Scholar]
- 19. Gispen W. H., and Biessels G. J. (2000) Cognition and synaptic plasticity in diabetes mellitus. Trends Neurosci. 23, 542–549 [DOI] [PubMed] [Google Scholar]
- 20. Biessels G. J., Staekenborg S., Brunner E., Brayne C., and Scheltens P. (2006) Risk of dementia in diabetes mellitus: a systematic review. Lancet Neurol. 5, 64–74 [DOI] [PubMed] [Google Scholar]
- 21. Barnes D. E., and Yaffe K. (2011) The projected effect of risk factor reduction on Alzheimer's disease prevalence. Lancet Neurol. 10, 819–828 [DOI] [PMC free article] [PubMed] [Google Scholar]
- 22. Jolivalt C. G., Calcutt N. A., and Masliah E. (2012) Similar pattern of peripheral neuropathy in mouse models of type 1 diabetes and Alzheimer's disease. Neuroscience 202, 405–412 [DOI] [PMC free article] [PubMed] [Google Scholar]
- 23. Verdile G., Fuller S. J., and Martins R. N. (2015) The role of type 2 diabetes in neurodegeneration. Neurobiol. Dis. 84, 22–38 [DOI] [PubMed] [Google Scholar]
- 24. Piazza F. V., Pinto G. V., Trott G., Marcuzzo S., Gomez R., and Fernandes Mda C. (2011) Enriched environment prevents memory deficits in type 1 diabetic rats. Behav. Brain Res. 217, 16–20 [DOI] [PubMed] [Google Scholar]
- 25. Revsin Y., Rekers N. V., Louwe M. C., Saravia F. E., De Nicola A. F., de Kloet E. R., and Oitzl M. S. (2009) Glucocorticoid receptor blockade normalizes hippocampal alterations and cognitive impairment in streptozotocin-induced type 1 diabetes mice. Neuropsychopharmacology 34, 747–758 [DOI] [PubMed] [Google Scholar]
- 26. Stranahan A. M., Arumugam T. V., Cutler R. G., Lee K., Egan J. M., and Mattson M. P. (2008) Diabetes impairs hippocampal function through glucocorticoid-mediated effects on new and mature neurons. Nat. Neurosci. 11, 309–317 [DOI] [PMC free article] [PubMed] [Google Scholar]
- 27. Kumagai A. K. (1999) Glucose transport in brain and retina: implications in the management and complications of diabetes. Diabetes Metab. Res. Rev. 15, 261–273 [DOI] [PubMed] [Google Scholar]
- 28. Kuwabara T., Kagalwala M. N., Onuma Y., Ito Y., Warashina M., Terashima K., Sanosaka T., Nakashima K., Gage F. H., and Asashima M. (2011) Insulin biosynthesis in neuronal progenitors derived from adult hippocampus and the olfactory bulb. EMBO Mol. Med. 3, 742–754 [DOI] [PMC free article] [PubMed] [Google Scholar]
- 29. Kuwabara T., Hsieh J., Muotri A., Yeo G., Warashina M., Lie D. C., Moore L., Nakashima K., Asashima M., and Gage F. H. (2009) Wnt-mediated activation of NeuroD1 and retro-elements during adult neurogenesis. Nat. Neurosci. 12, 1097–1105 [DOI] [PMC free article] [PubMed] [Google Scholar]
- 30. Le Floch J. P., Le Lièvre G., Labroue M., Paul M., Peynegre R., and Perlemuter L. (1993) Smell dysfunction and related factors in diabetic patients. Diabetes Care 16, 934–937 [DOI] [PubMed] [Google Scholar]
- 31. Weinstock R. S., Wright H. N., and Smith D. U. (1993) Olfactory dysfunction in diabetes mellitus. Physiol. Behav. 53, 17–21 [DOI] [PubMed] [Google Scholar]
- 32. Gouveri E., Katotomichelakis M., Gouveris H., Danielides V., Maltezos E., and Papanas N. (2014) Olfactory dysfunction in type 2 diabetes mellitus: an additional manifestation of microvascular disease? Angiology 65, 869–876 [DOI] [PubMed] [Google Scholar]
- 33. Hidaka R., Machida M., Fujimaki S., Terashima K., Asashima M., and Kuwabara T. (2013) Monitoring neurodegeneration in diabetes using adult neural stem cells derived from the olfactory bulb. Stem Cell Res. Ther. 4, 51. [DOI] [PMC free article] [PubMed] [Google Scholar]
- 34. Dennis J. C., Coleman E. S., Swyers S. E., Moody S. W., Wright J. C., Judd R., Zhong Q., and Morrison E. E. (2005) Changes in mitotic rate and GFAP expression in the primary olfactory axis of streptozotocin-induced diabetic rats. J. Neurocytol. 34, 3–10 [DOI] [PubMed] [Google Scholar]
- 35. Raponi E., Agenes F., Delphin C., Assard N., Baudier J., Legraverend C., and Deloulme J. C. (2007) S100B expression defines a state in which GFAP-expressing cells lose their neural stem cell potential and acquire a more mature developmental stage. Glia 55, 165–177 [DOI] [PMC free article] [PubMed] [Google Scholar]
- 36. Lie D. C., Colamarino S. A., Song H. J., Désiré L., Mira H., Consiglio A., Lein E. S., Jessberger S., Lansford H., Dearie A. R., and Gage F. H. (2005) Wnt signalling regulates adult hippocampal neurogenesis. Nature 437, 1370–1375 [DOI] [PubMed] [Google Scholar]
- 37. Gao Z., Ure K., Ables J. L., Lagace D. C., Nave K. A., Goebbels S., Eisch A. J., and Hsieh J. (2009) Neurod1 is essential for the survival and maturation of adult-born neurons. Nat. Neurosci. 12, 1090–1092 [DOI] [PMC free article] [PubMed] [Google Scholar]
- 38. Gordon M. D., and Nusse R. (2006) Wnt signaling: multiple pathways, multiple receptors, and multiple transcription factors. J. Biol. Chem. 281, 22429–22433 [DOI] [PubMed] [Google Scholar]
- 39. Katoh M., and Katoh M. (2007) WNT signaling pathway and stem cell signaling network. Clin. Cancer Res. 13, 4042–4045 [DOI] [PubMed] [Google Scholar]
- 40. Varela-Nallar L., and Inestrosa N. C. (2013) Wnt signaling in the regulation of adult hippocampal neurogenesis. Front. Cell. Neurosci. 7, 100. [DOI] [PMC free article] [PubMed] [Google Scholar]
- 41. Boutin C., Hardt O., de Chevigny A., Coré N., Goebbels S., Seidenfaden R., Bosio A., and Cremer H. (2010) NeuroD1 induces terminal neuronal differentiation in olfactory neurogenesis. Proc. Natl. Acad. Sci. U.S.A. 107, 1201–1206 [DOI] [PMC free article] [PubMed] [Google Scholar]
- 42. Okamoto M., Inoue K., Iwamura H., Terashima K., Soya H., Asashima M., and Kuwabara T. (2011) Reduction in paracrine Wnt3 factors during aging causes impaired adult neurogenesis. FASEB J. 25, 3570–3582 [DOI] [PubMed] [Google Scholar]
- 43. Jessberger S., Clark R. E., Broadbent N. J., Clemenson G. D. Jr., Consiglio A., Lie D. C., Squire L. R., and Gage F. H. (2009) Dentate gyrus-specific knockdown of adult neurogenesis impairs spatial and object recognition memory in adult rats. Learn Mem. 16, 147–154 [DOI] [PMC free article] [PubMed] [Google Scholar]
- 44. Seib D. R., Corsini N. S., Ellwanger K., Plaas C., Mateos A., Pitzer C., Niehrs C., Celikel T., and Martin-Villalba A. (2013) Loss of Dickkopf-1 restores neurogenesis in old age and counteracts cognitive decline. Cell Stem Cell 12, 204–214 [DOI] [PubMed] [Google Scholar]
- 45. Bhutada P., Mundhada Y., Humane V., Rahigude A., Deshmukh P., Latad S., and Jain K. (2012) Agmatine, an endogenous ligand of imidazoline receptor protects against memory impairment and biochemical alterations in streptozotocin-induced diabetic rats. Prog. Neuropsychopharmacol. Biol. Psychiatry 37, 96–105 [DOI] [PubMed] [Google Scholar]
- 46. Jabbarpour Z., Shahidi S., Saidijam M., Sarihi A., Hassanzadeh T., and Esmaeili R. (2014) Effect of tempol on the passive avoidance and novel object recognition task in diabetic rats. Brain Res. Bull. 101, 51–56 [DOI] [PubMed] [Google Scholar]
- 47. Stewart R. R., Hoge G. J., Zigova T., and Luskin M. B. (2002) Neural progenitor cells of the neonatal rat anterior subventricular zone express functional GABA(A) receptors. J. Neurobiol. 50, 305–322 [DOI] [PubMed] [Google Scholar]
- 48. Wang D. D., Krueger D. D., and Bordey A. (2003) GABA depolarizes neuronal progenitors of the postnatal subventricular zone via GABAA receptor activation. J. Physiol. 550, 785–800 [DOI] [PMC free article] [PubMed] [Google Scholar]
- 49. Bolteus A. J., and Bordey A. (2004) GABA release and uptake regulate neuronal precursor migration in the postnatal subventricular zone. J. Neurosci. 24, 7623–7631 [DOI] [PMC free article] [PubMed] [Google Scholar]
- 50. Liu X., Wang Q., Haydar T. F., and Bordey A. (2005) Nonsynaptic GABA signaling in postnatal subventricular zone controls proliferation of GFAP-expressing progenitors. Nat. Neurosci. 8, 1179–1187 [DOI] [PMC free article] [PubMed] [Google Scholar]
- 51. Zhou Y., and Danbolt N. C. (2013) GABA and glutamate transporters in brain. Front. Endocrinol. 4, 165. [DOI] [PMC free article] [PubMed] [Google Scholar]
- 52. Pallotto M., and Deprez F. (2014) Regulation of adult neurogenesis by GABAergic transmission: signaling beyond GABAA-receptors. Front. Cell. Neurosci. 8, 166. [DOI] [PMC free article] [PubMed] [Google Scholar]
- 53. Tozuka Y., Fukuda S., Namba T., Seki T., and Hisatsune T. (2005) GABAergic excitation promotes neuronal differentiation in adult hippocampal progenitor cells. Neuron 47, 803–815 [DOI] [PubMed] [Google Scholar]
- 54. Ge S., Goh E. L., Sailor K. A., Kitabatake Y., Ming G. L., and Song H. (2006) GABA regulates synaptic integration of newly generated neurons in the adult brain. Nature 439, 589–593 [DOI] [PMC free article] [PubMed] [Google Scholar]
- 55. Nguyen L., Malgrange B., Breuskin I., Bettendorff L., Moonen G., Belachew S., and Rigo J. M. (2003) Autocrine/paracrine activation of the GABA(A) receptor inhibits the proliferation of neurogenic polysialylated neural cell adhesion molecule-positive (PSA-NCAM+) precursor cells from postnatal striatum. J. Neurosci. 23, 3278–3294 [DOI] [PMC free article] [PubMed] [Google Scholar]
- 56. Platel J. C., Dave K. A., and Bordey A. (2008) Control of neuroblast production and migration by converging GABA and glutamate signals in the postnatal forebrain. J. Physiol. 586, 3739–3743 [DOI] [PMC free article] [PubMed] [Google Scholar]
- 57. Nishimura M., Sato K., Mizuno M., Yoshiya I., Shimada S., Saito N., and Tohyama M. (1997) Differential expression patterns of GABA transporters (GAT1–3) in the rat olfactory bulb. Brain Res. Mol. Brain Res. 45, 268–274 [DOI] [PubMed] [Google Scholar]
- 58. Muranyi M., Ding C., He Q., Lin Y., and Li P. A. (2006) Streptozotocin-induced diabetes causes astrocyte death after ischemia and reperfusion injury. Diabetes 55, 349–355 [DOI] [PubMed] [Google Scholar]
- 59. Coleman E., Judd R., Hoe L., Dennis J., and Posner P. (2004) Effects of diabetes mellitus on astrocyte GFAP and glutamate transporters in the CNS. Glia 48, 166–178 [DOI] [PubMed] [Google Scholar]
- 60. Coleman E. S., Dennis J. C., Braden T. D., Judd R. L., and Posner P. (2010) Insulin treatment prevents diabetes-induced alterations in astrocyte glutamate uptake and GFAP content in rats at 4 and 8 weeks of diabetes duration. Brain Res. 1306, 131–141 [DOI] [PMC free article] [PubMed] [Google Scholar]
- 61. Gandhi G. K., Ball K. K., Cruz N. F., and Dienel G. A. (2010) Hyperglycaemia and diabetes impair gap junctional communication among astrocytes. ASN Neuro 2, e00030. [DOI] [PMC free article] [PubMed] [Google Scholar]
- 62. Cameron H. A., and Gould E. (1994) Adult neurogenesis is regulated by adrenal steroids in the dentate gyrus. Neuroscience 61, 203–209 [DOI] [PubMed] [Google Scholar]
- 63. Kim J. B., Ju J. Y., Kim J. H., Kim T. Y., Yang B. H., Lee Y. S., and Son H. (2004) Dexamethasone inhibits proliferation of adult hippocampal neurogenesis in vivo and in vitro. Brain Res. 1027, 1–10 [DOI] [PubMed] [Google Scholar]
- 64. Lau W. M., Qiu G., Helmeste D. M., Lee T. M., Tang S. W., So K. F., and Tang S. W. (2007) Corticosteroid decreases subventricular zone cell proliferation, which could be reversed by paroxetine. Restor. Neurol. Neurosci. 25, 17–23 [PubMed] [Google Scholar]
- 65. Unemura K., Kume T., Kondo M., Maeda Y., Izumi Y., and Akaike A. (2012) Glucocorticoids decrease astrocyte numbers by reducing glucocorticoid receptor expression in vitro and in vivo. J. Pharmacol. Sci. 119, 30–39 [DOI] [PubMed] [Google Scholar]
- 66. Carter B. S., Meng F., and Thompson R. C. (2012) Glucocorticoid treatment of astrocytes results in temporally dynamic transcriptome regulation and astrocyte-enriched mRNA changes in vitro. Physiol. Genomics 44, 1188–1200 [DOI] [PMC free article] [PubMed] [Google Scholar]
- 67. Noble E. E., Billington C. J., Kotz C. M., and Wang C. (2011) The lighter side of BDNF. Am. J. Physiol. Regul. Integr. Comp. Physiol. 300, R1053–R1069 [DOI] [PMC free article] [PubMed] [Google Scholar]
- 68. Binder D. K., and Scharfman H. E. (2004) Brain-derived neurotrophic factor. Growth Factors 22, 123–131 [DOI] [PMC free article] [PubMed] [Google Scholar]
- 69. Mu J. S., Li W. P., Yao Z. B., and Zhou X. F. (1999) Deprivation of endogenous brain-derived neurotrophic factor results in impairment of spatial learning and memory in adult rats. Brain Res. 835, 259–265 [DOI] [PubMed] [Google Scholar]
- 70. Taliaz D., Stall N., Dar D. E., and Zangen A. (2010) Knockdown of brain-derived neurotrophic factor in specific brain sites precipitates behaviors associated with depression and reduces neurogenesis. Mol. Psychiatry 15, 80–92 [DOI] [PMC free article] [PubMed] [Google Scholar]
- 71. Nitta A., Murai R., Suzuki N., Ito H., Nomoto H., Katoh G., Furukawa Y., and Furukawa S. (2002) Diabetic neuropathies in brain are induced by deficiency of BDNF. Neurotoxicol. Teratol. 24, 695–701 [DOI] [PubMed] [Google Scholar]
- 72. Schaaf M. J., Hoetelmans R. W., de Kloet E. R., and Vreugdenhil E. (1997) Corticosterone regulates expression of BDNF and trkB but not NT-3 and trkC mRNA in the rat hippocampus. J. Neurosci. Res. 48, 334–341 [PubMed] [Google Scholar]
- 73. Smith M. A., Makino S., Kvetnansky R., and Post R. M. (1995) Stress and glucocorticoids affect the expression of brain-derived neurotrophic factor and neurotrophin-3 mRNAs in the hippocampus. J. Neurosci. 15, 1768–1777 [DOI] [PMC free article] [PubMed] [Google Scholar]
- 74. Rerup C., and Tarding F. (1969) Streptozotocin- and alloxan-diabetes in mice. Eur. J. Pharmacol. 7, 89–96 [DOI] [PubMed] [Google Scholar]
- 75. Jafari Anarkooli I., Sankian M., Ahmadpour S., Varasteh A. R., and Haghir H. (2008) Evaluation of Bcl-2 family gene expression and Caspase-3 activity in hippocampus STZ-induced diabetic rats. Exp. Diabetes Res. 2008, 638467. [DOI] [PMC free article] [PubMed] [Google Scholar]
- 76. Fujimaki S., Hidaka R., Asashima M., Takemasa T., and Kuwabara T. (2014) Wnt protein-mediated satellite cell conversion in adult and aged mice following voluntary wheel running. J. Biol. Chem. 289, 7399–7412 [DOI] [PMC free article] [PubMed] [Google Scholar]
- 77. Machida M., Takeda K., Yokono H., Ikemune S., Taniguchi Y., Kiyosawa H., and Takemasa T. (2012) Reduction of ribosome biogenesis with activation of the mTOR pathway in denervated atrophic muscle. J. Cell. Physiol. 227, 1569–1576 [DOI] [PubMed] [Google Scholar]
- 78. Jurdak N., and Kanarek R. B. (2009) Sucrose-induced obesity impairs novel object recognition learning in young rats. Physiol. Behav. 96, 1–5 [DOI] [PubMed] [Google Scholar]
- 79. Antunes M., and Biala G. (2012) The novel object recognition memory: neurobiology, test procedure, and its modifications. Cogn. Process. 13, 93–110 [DOI] [PMC free article] [PubMed] [Google Scholar]
- 80. Ramanathan M., Jaiswal A. K., and Bhattacharya S. K. (1998) Differential effects of diazepam on anxiety in streptozotocin induced diabetic and non-diabetic rats. Psychopharmacology 135, 361–367 [DOI] [PubMed] [Google Scholar]
- 81. Gage F. H., Coates P. W., Palmer T. D., Kuhn H. G., Fisher L. J., Suhonen J. O., Peterson D. A., Suhr S. T., and Ray J. (1995) Survival and differentiation of adult neuronal progenitor cells transplanted to the adult brain. Proc. Natl. Acad. Sci. U.S.A. 92, 11879–11883 [DOI] [PMC free article] [PubMed] [Google Scholar]
- 82. Kuwabara T., Hsieh J., Nakashima K., Taira K., and Gage F. H. (2004) A small modulatory dsRNA specifies the fate of adult neural stem cells. Cell 116, 779–793 [DOI] [PubMed] [Google Scholar]
- 83. Wu Y., Wang W., Díez-Sampedro A., and Richerson G. B. (2007) Nonvesicular inhibitory neurotransmission via reversal of the GABA transporter GAT-1. Neuron 56, 851–865 [DOI] [PMC free article] [PubMed] [Google Scholar]
- 84. Jin X. T., Paré J. F., and Smith Y. (2012) GABA transporter subtype 1 and GABA transporter subtype 3 modulate glutamatergic transmission via activation of presynaptic GABA(B) receptors in the rat globus pallidus. Eur. J. Neurosci. 36, 2482–2492 [DOI] [PMC free article] [PubMed] [Google Scholar]
- 85. Krause S., and Schwarz W. (2005) Identification and selective inhibition of the channel mode of the neuronal GABA transporter 1. Mol. Pharmacol. 68, 1728–1735 [DOI] [PubMed] [Google Scholar]
- 86. Milanese M., Zappettini S., Jacchetti E., Bonifacino T., Cervetto C., Usai C., and Bonanno G. (2010) In vitro activation of GAT1 transporters expressed in spinal cord gliosomes stimulates glutamate release that is abnormally elevated in the SOD1/G93A(+) mouse model of amyotrophic lateral sclerosis. J. Neurochem. 113, 489–501 [DOI] [PubMed] [Google Scholar]