

Abstract
How histone post-translational modifications (PTMs) are inherited through the cell cycle remains poorly understood. Canonical histones are made in the S phase of the cell cycle. Combining mass spectrometry-based technologies and stable isotope labeling by amino acids in cell culture, we question the distribution of multiple histone PTMs on old versus new histones in synchronized human cells. We show that histone PTMs can be grouped into three categories according to their distributions. Most lysine mono-methylation and acetylation PTMs are either symmetrically distributed on old and new histones or are enriched on new histones. In contrast, most di- and tri-methylation PTMs are enriched on old histones, suggesting that the inheritance of different PTMs is regulated distinctly. Intriguingly, old and new histones are distinct in their phosphorylation status during early mitosis in the following three human cell types: HeLa, 293T, and human foreskin fibroblast cells. The mitotic hallmark H3S10ph is predominantly associated with old H3 at early mitosis and becomes symmetric with the progression of mitosis. This same distribution was observed with other mitotic phosphorylation marks, including H3T3/T6ph, H3.1/2S28ph, and H1.4S26ph but not S28/S31ph on the H3 variant H3.3. Although H3S10ph often associates with the neighboring Lys-9 di- or tri-methylations, they are not required for the asymmetric distribution of Ser-10 phosphorylation on the same H3 tail. Inhibition of the kinase Aurora B does not change the distribution despite significant reduction of H3S10ph levels. However, K9me2 abundance on the new H3 is significantly reduced after Aurora B inhibition, suggesting a cross-talk between H3S10ph and H3K9me2.
Keywords: chromatin, epigenetics, histone, mass spectrometry (MS), mitosis, post-translational modification (PTM), proteomics
Introduction
In eukaryotes, histone proteins facilitate the packaging of DNA molecules. The DNA double helix wraps around histone octamers to form nucleosomes. A histone octamer contains two copies of each core histone H3, H4, H2A, and H2B. A 5th histone, histone H1, is associated with the linker DNA which lies between the nucleosomes. Canonical histone proteins are cell cycle-dependent and are produced in S phase (1, 2), whereas cell cycle-independent histone variants (e.g. H3.3) are synthesized throughout the cell cycle (3). Histone proteins carry numerous post-translational modifications (PTMs)3 that are involved in multiple functions such as epigenetic regulation of transcription, DNA damage repair, and cell cycle progression (4, 5). To maintain lineage identity and to guide proper transcription, cells must replicate PTMs from old histones onto new histones at each cell division. Major efforts have been devoted to understanding how histones themselves are transmitted through the DNA replication fork in S phase (6). In principle, the newly deposited nucleosomes could contain entirely old or newly synthesized histone proteins, or a mixture of both. Accumulating evidence suggests that most H3/H4 tetramers remain intact, with the exception of some H3.3/H4 tetramers, indicating that nucleosomes should contain either new or old H3 and H4 rather than a mixture. Conversely, H2A/H2B dimers exchange freely during replication (6–8).
Determining the PTM profiles of newly deposited nucleosomes after replication, and how these profiles differ between old and new histone proteins, will help elucidate the mechanisms of histone PTM inheritance during the cell cycle. We and others have reported histone lysine methylation kinetics throughout the human cell cycle (9, 10). Although histone PTM inheritance is completed after one cell cycle, important repressive marks like H3K9me3 and H3K27me3 are not fully replenished until the next G1 phase(9). Groth and co-workers (11) reported an overview of multiple histone PTMs at the replication fork and made very similar observations. However, much remains unclear about how different histone PTMs are transmitted through mitosis.
Interestingly, a number of histone PTMs regulate cell cycle stage-specific processes and therefore may not need to be inherited from the old histones to new histones. For example, histone H3K56ac was shown to be added onto new histones during S phase and rapidly erased in G2 phase (12, 13). Mono-methylation of H4K20 is temporally added by G2 and M phase-specific activities of the methyltransferase PR-Set7/SET8 and is linked to cell cycle progression (14). Furthermore, a handful of histone phosphorylation (ph) marks are highly abundant in mitosis and are present at very low levels in the interphase, including H3S10ph, H3S28ph, H3T3ph, H1.4S26ph, etc. (15–21). The major kinase for these histone phosphorylation marks is Aurora B, which is part of the chromosomal passenger complex and plays essential roles in chromosome condensation, segregation, and cytokinesis during mitotic progression (22). Aurora B phosphorylates histones directly (17, 21, 23–26) or indirectly through activation of another kinase Haspin (27). The levels of these phosphorylation marks peak after the new histones are synthesized in S phase; therefore, they are not likely being transmitted from old to new histones. However, it remains unclear whether these histone phosphorylation marks play a role in facilitating epigenetic inheritance of other PTMs.
We report here a systematic analysis of the distribution of histone PTMs in mitosis. We show that most histone Kme2/3s were biased toward old histones, consistent with previous studies (9–11). H3K4me2/3, however, was symmetrically distributed on old and new H3. We also show that most Kme1 and Kac events were either symmetric or enriched on new histones, with the exception of H4K5acK8acK12acK16ac (H4 4–17 4-ac). Surprisingly, although the mitotic histone phosphorylation marks do not need to be inherited, they were predominantly associated with the old histones in early mitosis and only became more symmetrically distributed in late mitosis. This phenomenon was observed for four histone phosphorylation marks, including H3S10ph on both canonical histone H3.1/2 and the variant H3.3, S28ph on H3.1/2, H3T3/T6ph, and S26ph on a linker histone H1.4. In contrast, S28/S31ph on H3.3 was distributed symmetrically on old and new histones. We additionally demonstrate that the H3K9 residue is not required for the asymmetric distribution of Ser-10 phosphorylation on the same H3 tail.
Results
Systematic Analysis of the Distribution of Histone PTMs in Mitosis
To investigate the distribution of histone PTMs on old versus new histones during mitosis, we used pulse-SILAC (stable isotope labeling by amino acids in cell culture) (28) followed by mass spectrometry techniques. HeLa cells were synchronized at the G1/S boundary by double thymidine block (Fig. 1A). Typically, the majority of HeLa cells entered G2/M by 7–8 h after release (Fig. 1, D and E). Upon release, we cultured the cells with SILAC media containing 13C- and 15N-labeled arginine. Because canonical histone proteins are only synthesized in S phase (1, 2), any heavy Arg-labeled histones were therefore newly synthesized histones and could be detected by the subsequent mass spectrometry analysis. In addition, we included l-[methyl-13C,D3]methionine in some experiments to enable characterization of new methylation events. Methionine can be converted into S-adenosylmethionine (AdoMet), the only methyl donor in the cell (29). Therefore, heavy-labeled methionine can mark both new methylation events as well as new proteins (9). Incorporation of the supplemented heavy-labeled amino acids may not happen immediately because they take time to enter the cell and get incorporated into proteins. To test whether the cells can utilize supplemented stable isotope-labeled amino acids rapidly enough, we performed metabolomics analysis in one pulse-SILAC experiment. As shown in Fig. 1C, the majority of cellular arginine and AdoMet was already heavy-labeled by 2 h. By 4.5 h, both of them had reached a plateau of 98.9 and 90.8%, respectively. Minimum increase of extra labeling was achieved after 4.5 h. The maximum labeling efficiency was 99.1% for heavy arginine and 93.8% for heavy AdoMet. We also monitored heavy proline levels in addition to supplementing extra light proline in the medium because arginine can be converted into proline (30). Only a trace amount (<0.3%) of heavy proline was detected throughout the labeling time course, which would not likely affect our data analyses. Based on these data, we concluded that the pulse-SILAC was fast enough for labeling G2/M histones.
FIGURE 1.

Cell synchronization and SILAC. A, pulse-SILAC experimental paradigm for HeLa cells. B, pulse-SILAC experimental paradigm for HFF and 293T cells. C, metabolite analysis of one pulse-SILAC experiment in HeLa cells. Relative abundance of heavy arginine, light proline, and heavy AdoMet (SAM) was shown in a time course manner. Sum of both light and heavy forms of the same metabolite was set to be 100%. D, example flow cytometry data of a HeLa cell synchronization experiment shown in Fig. 2. E, example flow cytometry data showing HeLa cell synchronization and DMSO and Hes treatments; no apparent defects were found in Hes-treated cells. F, example flow cytometry data showing HFF cell synchronization. G, flow cytometry data showing synchronization experiment conducted in 293T cells transfected with either wild type or K9M H3.3 transgenes. Both cell lines had very similar DNA content distribution across different time points. * shows time points when cells were harvested for mass spectrometry analyses.
As shown in Fig. 2A, all canonical histone proteins quantified, including H3.1/2, H4, and H1.4, showed very similar labeling between 8.5 and 11 h, suggesting the majority of histone protein synthesis had finished by 8.5 h in our experimental paradigm. Consistently, flow cytometry measurements of DNA contents showed the majority of cells had finished S phase and entered G2/M phase by 8.5 h (Fig. 1D). However, the cell cycle-independent H3 variant H3.3 had a lower labeling rate compared with other histones, and the labeling continued to increase from 8.5 to 11 h (Fig. 2A), in agreement with the fact that H3.3 protein synthesis happens throughout the cell cycle (3). In general, old histones were over-represented in these pulse-SILAC experiments, likely due to recycling of cellular metabolites during histone synthesis (9). Taking the protein labeling efficiencies into consideration, we presented data in a normalized distribution manner as shown in Equation 1.
 |
The larger the number, the more asymmetric a particular PTM is biased toward the old histones. Fig. 2B shows a distribution map for a total of 57 histone PTM statuses (including unmodified) and their relative abundance in mitosis. The PTM statuses could be clustered into three categories according to their normalized distributions (Table 1) as follows: symmetrically distributed (29 statuses), enriched on new histones (8 statuses), and enriched on old histones (20 statuses). For PTMs requiring inheritance from the old histones to new histones, symmetric distributions implied that the inheritance had been completed before onset of mitosis. In contrast, enrichments on the old histones indicated that inheritance of such PTMs persisted into mitosis and even the next G1.
FIGURE 2.

Distribution pattern of histone PTMs in mitosis. A, labeling of histone proteins by pulse-SILAC experiment. For the relative abundance of old versus new histone H3 (total H3, H3.1/2, and H3.3), H4 and H1.4 were generated from two time points, 8.5 and 11 h, respectively. Fig. 1D shows that cells had finished S phase and entered G2/M phase at both time points. Numbers above each bar show average of three MS runs. Error bars show standard error. B, dynamic distribution of 57 histone PTM statuses in mitosis, including 16 unmodified statuses and 41 PTMs. All values used in this figure are listed in Table 1. The x and y axes show normalized distribution of histone PTM statuses at 8.5 and 11 h, respectively. The data were collected from the same HeLa cell pulse-SILAC experiment shown in A. The diagonal line indicates identical normalized distribution between the two time points. Each data dots were color-coded based on their averaged relative abundance between the two time points (Table 1). The color bar on the right was generated by log(2) value of the relative abundance (%). Square, asymmetric phosphorylation (ph) marks; star, H3.3S28ph; rhombus, H3K9me2/3 and H3.1/2 K27me2/3; circle, other PTMs. The arrowheads show the positions of five ph marks.
TABLE 1.
Abundance and distribution pattern of histone PTMs in mitosis
Listed are data used to generate Fig. 2B. Data were collected from the same pulse-SILAC experiment shown in Fig. 2, A and B, and Fig. 3, A–F. 3rd and 4th columns show relative abundance of each PTM status at 8.5 and 11 h, respectively. The standard errors of multiple MS runs are also shown. 5th column shows average relative abundance between 8.5 and 11 h. 6th and 7th columns show normalized distributions of PTM statuses. All normalized distributions were calculated by the following formula: normalized distribution of a PTM status = (% on old histone/% on new histone)/(old histone/new histone. The categories (shown in 1st column) were generated using arbitrary cutoff; statuses falling between −1,−1 and 1,1 were considered to be symmetric. Among the rest, the ones fell in the first quadrant were considered to be enriched on old histone, and the ones that fell in the fourth quadrant were considered to be enriched on new histone. The PTM statues were listed in a descending order according to the value in the 4th column, normalized distribution at 8.5 h (log2).
| Category | PTM status | Relative abundance (%) |
Normalized distribution (log2) |
|||
|---|---|---|---|---|---|---|
| 8.5 h | 11 h | Average | 8.5 h | 11 h | ||
| Enriched on old histone | H4K20me3 | 2.29 ± 0.06 | 1.90 ± 0.08 | 2.09 | 7.00a | 4.12 |
| H3K79me3 | 0.16 ± 0.01 | 0.67 ± 0.04 | 0.41 | 6.69 | 5.60 | |
| H3.1/2K36me3 | 3.70 ± 0.06 | 3.94 ± 0.07 | 3.82 | 4.38 | 3.42 | |
| H3K79me2 | 1.75 ± 0.15 | 1.98 ± 0.06 | 1.86 | 3.87 | 3.13 | |
| H3.1/2K27me3 | 16.11 ± 0.22 | 15.47 ± 0.21 | 15.79 | 3.63 | 2.89 | |
| H3.3K36me3 | 7.83 ± 0.25 | 8.29 ± 0.22 | 8.06 | 3.20 | 3.38 | |
| H3T3/T6ph | 0.39 ± 0.03 | 0.40 ± 0.09 | 0.39 | 2.88 | 0.44 | |
| H3.1/2S28ph | 4.51 ± 0.02 | 7.47 ± 0.22 | 5.99 | 2.63 | 0.83 | |
| H3.3K27me3 | 16.12 ± 2.63 | 11.80 ± 1.75 | 13.96 | 2.48 | 2.04 | |
| H4K20me2 | 94.69 ± 0.09 | 95.44 ± 0.26 | 95.06 | 2.43 | 1.04 | |
| H3K9me3 | 33.29 ± 0.39 | 31.39 ± 0.24 | 32.34 | 2.27 | 1.48 | |
| H1.4S26ph | 5.43 ± 0.49 | 18.51 ± 0.87 | 11.97 | 2.22 | 0.24 | |
| H3K79me1 | 20.49 ± 0.23 | 16.74 ± 0.71 | 18.61 | 2.18 | 2.06 | |
| H3.3K36me2 | 37.27 ± 2.23 | 32.00 ± 1.98 | 34.63 | 2.07 | 1.59 | |
| H3K18me1 | 0.66 ± 0.07 | 0.70 ± 0.11 | 0.68 | 1.98 | 2.89 | |
| H4(4–17) four-ac | 0.40 ± 0.04 | 0.14 ± 0.02 | 0.27 | 1.97 | 1.67 | |
| H3S10ph | 13.79 ± 1.17 | 26.96 ± 0.54 | 20.38 | 1.91 | 0.44 | |
| H3K4me1 | 1.92 ± 0.04 | 2.28 ± 0.05 | 2.10 | 1.61 | 1.50 | |
| H3.1/2K27me2 | 46.90 ± 1.11 | 45.03 ± 0.98 | 45.96 | 1.52 | 0.94 | |
| H3.1/2 K36me2 | 37.68 ± 0.71 | 34.51 ± 0.91 | 36.10 | 1.51 | 0.97 | |
| Symmetric | H3K9me2 | 50.80 ± 0.64 | 51.28 ± 0.58 | 51.04 | 0.85 | 0.45 |
| H3.1/2K36me1 | 17.29 ± 0.14 | 19.34 ± 0.15 | 18.31 | 0.80 | 0.46 | |
| H3K14un | 73.49 ± 1.11 | 81.97 ± 0.82 | 77.73 | 0.78 | 0.43 | |
| H3S10un | 86.21 ± 1.17 | 73.04 ± 0.54 | 79.62 | 0.56 | 0.35 | |
| H3K14ac | 26.50 ± 1.11 | 17.90 ± 0.82 | 22.20 | 0.56 | 0.21 | |
| H3.3S28/S31ph | 2.46 ± 0.03 | 6.37 ± 0.29 | 4.41 | 0.55 | 0.27 | |
| H3.3K27me2 | 50.72 ± 3.45 | 47.76 ± 1.20 | 49.24 | 0.52 | 0.35 | |
| H3.3K27me1 | 21.68 ± 0.56 | 26.14 ± 0.64 | 23.91 | 0.47 | 0.71 | |
| H3K23me1 | 0.70 ± 0.05 | 0.36 ± 0.04 | 0.53 | 0.42 | 0.21 | |
| H3K4me2 | 4.70 ± 0.20 | 0.85 ± 0.19 | 2.77 | 0.39 | 0.30 | |
| H3.1/2S28un | 95.49 ± 0.02 | 92.53 ± 0.22 | 94.01 | 0.38 | 0.12 | |
| H1.4K25me1 | 7.20 ± 0.37 | 2.72 ± 0.06 | 4.96 | 0.33 | 0.38 | |
| H4(4–17) un | 61.30 ± 0.76 | 67.21 ± 2.34 | 64.25 | 0.23 | 0.05 | |
| H3(18–26) un | 67.93 ± 1.63 | 72.02 ± 1.19 | 69.97 | 0.17 | 0.11 | |
| H3.3K36me1 | 24.59 ± 1.23 | 26.63 ± 1.40 | 25.61 | 0.13 | −0.16 | |
| H3.3S28/S31un | 97.54 ± 0.03 | 93.63 ± 0.29 | 95.59 | −0.01 | −0.08 | |
| H1. K25un | 92.80 ± 0.37 | 97.28 ± 0.06 | 95.04 | −0.02 | −0.01 | |
| H3T3/T6un | 99.61 ± 0.03 | 99.60 ± 0.09 | 99.61 | −0.04 | −0.06 | |
| H3K4un | 92.23 ± 0.25 | 95.16 ± 0.52 | 93.70 | −0.07 | −0.10 | |
| H1.4S26un | 94.57 ± 0.49 | 81.49 ± 0.87 | 88.03 | −0.07 | 0.00 | |
| H3K79un | 77.61 ± 0.35 | 80.62 ± 0.64 | 79.11 | −0.12 | −0.12 | |
| H3.1/2K27me1 | 21.65 ± 0.69 | 23.64 ± 0.54 | 22.65 | −0.15 | −0.30 | |
| H4(4–17) one-ac | 28.66 ± 0.87 | 26.11 ± 2.09 | 27.39 | −0.46 | −0.51 | |
| H3.1/2K36un | 41.33 ± 0.77 | 42.21 ± 0.90 | 41.77 | −0.49 | −0.62 | |
| H3K18/23ac | 29.49 ± 1.53 | 26.17 ± 1.13 | 27.83 | −0.64 | −0.63 | |
| H3K9ac | 0.53 ± 0.05 | 0.38 ± 0.09 | 0.45 | −0.68 | −0.45 | |
| H3K9me1 | 4.94 ± 0.23 | 5.40 ± 0.05 | 5.17 | −0.68 | −0.71 | |
| H3K4me3 | 0.77 ± 0.04 | 1.32 ± 0.22 | 1.04 | −0.78 | 0.97 | |
| H3K18ac23ac | 1.54 ± 0.01 | 0.86 ± 0.08 | 1.20 | −0.82 | −0.87 | |
| Enriched on new histone | H4(4–17) two-ac | 7.45 ± 0.30 | 5.45 ± 0.33 | 6.45 | −1.33 | −1.08 |
| H4(4–17) three-ac | 2.19 ± 0.04 | 1.08 ± 0.05 | 1.64 | −1.49 | −1.18 | |
| H3.3K36un | 30.32 ± 1.08 | 33.08 ± 0.41 | 31.70 | −1.54 | −1.16 | |
| H3K9un | 10.45 ± 0.80 | 11.54 ± 0.75 | 11.00 | −1.71 | −1.38 | |
| H4K20me1 | 0.94 ± 0.04 | 1.45 ± 0.13 | 1.19 | −1.74 | −2.27 | |
| H3.1/2K27un | 15.35 ± 0.41 | 15.74 ± 0.76 | 15.55 | −2.41 | −2.34 | |
| H3.3K27un | 11.48 ± 1.04 | 14.29 ± 0.70 | 12.88 | −3.15 | −2.57 | |
| H4K20un | 2.08 ± 0.03 | 1.21 ± 0.10 | 1.65 | −3.71 | −3.49 | |
a The H4K20me3 was 100% on the old H4 at 8.5 h so the normalized distribution was ∞. It was arbitrarily assigned with a log2 value of 7 (larger than all the other values in the table) for plotting in Fig. 2B.
Interestingly, the same type of histone PTMs tended to have a similar distribution. As listed in Table 1, most lysine mono-methylations and acetylations were either symmetrically distributed or enriched on the new histones. In contrast, most lysine di- and tri-methylations were enriched on the old histones, including H4K20me2/3, H3K79me2/3, H3K9me3, H3.1/2K27me2/3, H3.1/2K36me2/3, H3.3K27me3, and H3.3K36me2/3. These results extended previous findings from us and others demonstrating that new H3K9me3 and H3K27me3 are synthesized rather slowly and do not complete until next G1 (9–11). However, a few histone PTMs did not follow the general rules. For instance, K4me2 and me3 were symmetrically distributed, whereas H3K4me1 was enriched on old H3 (Table 1). This result demonstrates for the first time that me2/3 marks could be restored before mitosis and suggests that the mechanisms underlying the inheritance of H3K4me and other Kme marks are distinct. Another example is that H3K79me1/2/3s were all asymmetrically distributed on the old H3 in mitosis (Table 1), suggesting that the sole methyltransferase for H3K79, Dot1l (31), was preferentially recruited to old histone H3. Interestingly, Dot1/Dot1l deficiency causes various cell cycle defects in human cells and in other organisms (32), which might be related to its enrichment on the old H3. In addition, although K27me2 was asymmetrically distributed on the old histone H3.1/2, its counterpart was symmetrically distributed on H3.3. Finally, we found that H4K5acK8acK12acK16ac was enriched on old H4 at both time points, in contrast to most lysine acetylation marks (Table 1).
Enrichment of Histone Phosphorylation Marks on Old Histones in Mitosis
We also investigated the distribution of serine/threonine phosphorylations, which in principle do not require inheritance as they are mostly mitosis-specific (15–21). Surprisingly, four out of five Ser/Thr phosphorylations analyzed, namely H3S10ph, H3.1/2S28ph, H3T3/T6ph, and H1.4S26ph, were enriched on the old histones in early mitosis (Table 1 and Fig. 2B). The only exception was H3.3S28/S31ph, which was symmetrically distributed at both time points (Table 1 and Fig. 2B).
As H3S10ph was the most abundant form of histone Ser/Thr phosphorylation (Table 1 and Fig. 2B), we first confirmed the temporal pattern of its distribution in HeLa cells. Fig. 3A shows a clear inverse correlation of the asymmetry of H3S10ph against harvesting time, from six independent experiments with a total of 12 time points from the onset of mitosis. One of these experiments was conducted using heavy-to-light pulse labeling and produced a similar result as the other light-to-heavy experiments, ruling out any potential artifacts from SILAC labeling. In late G2 phase and early mitosis (6–7 h) when the H3S10ph signal first appears (15), a much smaller proportion of the new H3 than the old H3 was phosphorylated (Fig. 3B). As mitosis progresses, the level of H3S10ph increased on both old and new H3 with a clear delay on the new H3 (Fig. 3, B and C). Eventually the level of Ser-10 phosphorylation reached the same proportion on both old and new H3 (11 h and beyond, Fig. 3B).
FIGURE 3.

Histone phosphorylation marks were enriched on old histones in early mitosis. A, normalized H3S10ph distribution from three cell types: rhombus, six independent pulse-SILAC experiments with a total of 12 time points from HeLa cells; square, two independent pulse-SILAC experiments from HFF cells; triangle, one pulse-SILAC experiment from 293T cells. Normalized Ser-10 phosphorylation distribution = (S10ph on old H3/S10ph on new H3)/(old H3/new H3). y axis is in log2 scale. B, Ser-10 phosphorylation on new H3 had a lagged phase compared with Ser-10 phosphorylation on old H3. y axis is in log10 scale. C, relative abundance of histone phosphorylation marks in the pulse-SILAC experiments. C, all five phosphorylation marks are shown; C′, three less abundant phosphorylation marks are shown. D, normalized distribution of four additional histone phosphorylation marks. H3T3/T6ph, H3.1/2S28ph, and H1.4S26ph were enriched on old histones in early mitosis and became more symmetric in late mitosis, very similar to the distribution pattern of H3S10ph as shown in A. In contrast, distribution of H3.3S28/31ph was symmetric throughout mitosis. B–D, data for H3S10ph were from the same HeLa experiments shown in A. The data for H3T3/T6ph and H1.4S26ph were from four independent HeLa experiments with a total of six time points. The data for H3.1/2S28ph and H3.3S28/S31ph were from two experiments with three time points. H3.3S28/31ph was only detected in TiO2-enriched samples but not in input samples. Therefore the relative abundance was set to be 0% in C.
In addition to HeLa cells, we examined the distribution of H3S10ph in two additional cell lines, 293T cells and the primary cell line human foreskin fibroblast (HFF) cells (33). Fig. 1, F and G, shows that the majority of 293T and HFF cells were synchronized, although to a less extent than the HeLa cells (Fig. 1D). Because of the incomplete synchronization of these two cell types, we only collected samples in early time points. As shown in Figs. 3 and 4, we performed two independent synchronization experiments for HFF cells and collected samples at 6 and 7 h, respectively. We performed one synchronization experiment for 293T cells and collected samples at 7 h. Importantly, even with the less efficient cell cycle synchronization, H3S10ph was predominantly associated with the old H3 in both 293T cells and HFF cells (Fig. 3A). Taken together, we showed that Ser-10 phosphorylation was biased toward old histone H3 at early mitosis in all three cell lines tested and was likely common in other human cell types.
FIGURE 4.

Neighboring H3K9 was not required for the asymmetric distribution of Ser-10 phosphorylation. A, H3S10ph frequently coexisted with K9me2/3 in mitotic human cells. Bar graphs show relative abundance of H3K9 PTM statuses with a neighboring Ser-10 phosphorylation. HeLa cell data were collected from three pulse-SILAC experiments with four time points. The error bars show standard error of biological replicates. HFF cell data were collected from two pulse-SILAC experiments. 293T cells were collected from one pulse-SILAC experiment. The error bars show standard error of multiple MS runs. B and C, H3K9 residue was not required for asymmetric distribution of its neighboring Ser-10 phosphorylation on a transgenic H3.3K9M protein in 293T cells. Bar graphs show H3.3K9M protein synthesis (B) and distribution of Ser-10 phosphorylation on the mutant protein (C). The number below B shows level of H3.3K9M protein is 0.74% of total H3. The number below C indicates 0.81% of the mutant protein had Ser-10 phosphorylation. The numbers above each bar show average of three MS runs. Error bars show standard error. D–F, H3S10ph level and distribution remained the same in 293T cells expressing H3.3K9M transgenic protein. Bar graphs showing relative abundance of the following items in 293T cells expressing either HA- and FLAG-tagged H3.3 wild type (WT) protein or H3.3K9M mutant protein. D, K9me2/3; E, new and old WT H3 protein, including endogenous protein; F, Ser-10 phosphorylation on old and new H3. The numbers above each bar show the average. Error bars show standard error. The numbers below (F) show the percentage of Ser-10 phosphorylation from the wild type H3 protein. *, p < 0.05; **, p < 0.01.
The other three asymmetrically distributed Ser/Thr phosphorylation marks shared the same temporal pattern as H3S10ph in HeLa cells. As shown in Fig. 3D, H3T3/T6ph, H3.1/2S28ph, and H1.4S26ph were enriched on old histones at earlier time points (6–8.5 h) and became more symmetric at 11 h. In contrast, Ser-28/Ser-31 phosphorylation on a cell cycle-independent histone H3 variant, H3.3, was symmetric throughout mitosis (Figs. 2B and 3D). We concluded that the time-dependent asymmetric distribution of histone phosphorylations was universal among canonical histones, including both core histone (H3) and linker histone (H1.4), although the abundance of these phosphorylation events was very different in mitosis (Table 1 and Figs. 2B and 3C). These findings suggested the existence of a mechanism that distinguished old versus new histones at early mitosis, which led to enrichment of Ser/Thr phosphorylation on old histones.
H3K9 Was Not Required for Asymmetric Distribution of the Neighboring Ser-10 Phosphorylation on the Same H3 Tail
The enrichment of serine phosphorylation on old histone resembled the pattern of di- and tri-methylations on lysine residues (Fig. 2B and Table 1). Interestingly, the me2/3 on Lys-9 often coexists with H3S10ph on the same histone tails. As shown in Fig. 4A, the majority of the Lys-9 residue next to a phosphorylated Ser-10 phosphorylation was di- or tri-methylated in all three cell types we examined. We therefore sought to test whether the methylation status of the lysine residues could affect the phosphorylation status of the serine residues next to them.
To test whether H3K9 methylation affects the asymmetric Ser-10 phosphorylation distribution, we performed pulse-SILAC experiments in a 293T cell line carrying an H3.3K9M mutant transgene (34). As shown in Fig. 4, B and C, the distribution of Ser-10 phosphorylation on the mutant protein (MS10ph) was also enriched on the old mutant H3.3, strongly suggesting that the Lys-9 residue was not required for asymmetric distribution of Ser-10 phosphorylation on the same H3 tail. Furthermore, this result also suggested that Ser-10 phosphorylation on both H3.1/2 and H3.3 were enriched on old H3, contrary to the symmetric distribution of H3.3S28/S31ph (Fig. 2B and 3D). Interestingly, there is only one amino acid difference (residue 31) in the N-terminal tails of canonical H3 and H3.3. The distribution of these phosphorylation marks was thereby regulated site-specifically even for the same histone variant.
The K9M mutant protein has been shown to have a dominant negative effect on global K9me2/3 levels (34). As shown in Fig. 4D, a total of 14% drop of K9me2/3 levels were observed in K9M transgenic cells, compared with a 293T cell line carrying a WT H3.3 transgene (p < 0.05). However, essentially no difference on both the level and the distribution of Ser-10 phosphorylation on the wild type protein was observed, further supporting our conclusion that K9me2/3 did not affect the distribution of the neighboring Ser-10 phosphorylation (Fig. 4, E and F). Our results were consistent with previous in vitro biochemical studies, which showed that Aurora B does not have substrate preference for a trimethylated form of H3K9 peptide, among other modified forms of the same peptide (35–37).
Crosstalk between H3S10ph and H3K9me2
As previously mentioned, the majority of the K9 residue next to a phosphorylated Ser-10 phosphorylation was di- or tri-methylated (Fig. 4A). Intriguingly, the appearance of H3S10ph coincides with the dissociation of HP1, a K9me2/3-binding protein, from mitotic chromosomes, both of which are Aurora B-dependent (36, 38). These observations raised the hypothesis that a functional cross-talk existed between Ser-10 phosphorylation and the neighboring K9me2/3 that is usually bound by HP1 during interphase (39, 40).
To investigate the roles of histone phosphorylation in mitosis and its interaction with other histone PTMs (e.g. H3K9me2/3), we inhibited the mitotic kinase Aurora B using hesperadin (Hes) (26, 41). As shown in Fig. 5A, treating cells with 100 nm Hes (Fig. 1A) drastically reduced H3S10ph level in mitotic HeLa cells (harvested 11 h and beyond), without obviously delaying mitotic entrance (Fig. 1E). An average of 37.1% of H3 from DMSO-treated HeLa cells carried the Ser-10 phosphorylation mark, whereas only 1.0% of H3 from Hes-treated cells had Ser-10 phosphorylation (Fig. 5A). Interestingly, a small but significant reduction of H3K9me2 level was observed in Hes-treated cells (51.9%), compared with DMSO-treated cells (56.0%) (Fig. 5A). In contrast, no significant difference in the abundance of other lysine PTMs on the same peptide (Lys-9 or Lys-14) was seen. Surprisingly, the difference in K9me2 abundance between DMSO and Hes treatments was only seen on the new H3. As shown in Fig. 5B, K9me2 on the new H3 increased in a time-dependent manner in both DMSO- and Hes-treated cells. The increase in the Hes sample was less compared with DMSO (p < 0.05). In contrast, K9me2 on the old H3 stayed rather stable and did not differ between DMSO and Hes treatments (Fig. 5C, p > 0.05). These results suggested that H3S10ph/Aurora B cross-talk specifically with K9me2 and were involved in either promoting new K9me2 events or the maintenance of the pre-existing K9me2 in mitosis, or both. We did not observe a significant difference of pre-existing K9me2 levels between DMSO- and Hes-treated cells (data not shown), arguing for the latter. Additionally, DMSO- and Hes-treated cells had similar amounts of new K9me2 on the old H3 (data not shown), suggesting that H3S10ph/Aurora B's role was only limited to the new H3. The effect of inhibiting Aurora B is specific to the H3K9me2 mark, as very little changes in abundance of overall histone PTMs were observed (Fig. 6). In addition, given the observation that the abundance of all asymmetric histone phosphorylation marks was drastically reduced when Aurora B was inhibited (Fig. 7, A–C), we conclude that the absolute abundance of histone phosphorylation did not affect epigenetic inheritance of other PTMs under the time points tested here.
FIGURE 5.

Inhibiting Aurora B kinase caused reduction of H3K9me2 level and did not impact H3S10ph distribution. Inhibition of Aurora B kinase caused a large drop in H3S10ph level and a small reduction in H3K9me2 level, but did not impact other histone PTMs. Three independent HeLa pulse-SILAC experiments were performed, and data were collected from the following time points: experiment 1, 8.5 and 11 h; experiment 2, 11 h; experiment 3, 6, 11, 12, and 13 h. A, bar graphs show averaged levels of PTMs on H3(9–17) peptide upon DMSO or Hes treatments. Data from late mitosis time points are shown (11 h and beyond). *, p < 0.05; **, p < 0.01. Error bars show standard error. B and C, Hes treatment caused less new K9me2 methylation on the new H3. Normalized K9me2 abundance on the new H3 (B) and old H3 (C) in DMSO- and Hes-treated cells. p values were generated using data from the same five time points as in A. D–F, inhibition of Aurora B did not change the distribution of H3S10ph across mitosis. D, normalized Ser-10 phosphorylation distribution was highly similar between DMSO and Hes treatments. Data were collected from early to late mitosis time points (8.5–13 h). E and F, new H3 lagged behind to get Ser-10 phosphorylation in both DMSO and Hes treatments, compared with the old H3. E, DMSO-treated cells; F, Hes-treated cells. Data were collected from the same pulse-SILAC experiment, namely experiment 3.
FIGURE 6.

Hesperadin treatments did not affect relative levels of most histone PTMs. Bar graphs showing relative abundance of most commonly seen histone PTMs from three late mitosis time points (11 h and beyond). Only PTMs with relative abundance of over 0.5% are shown. Error bars show standard error. For all PTMs shown in this figure, there were no significant differences between DMSO- and Hes-treated cells (p > 0.05). Additional PTMs are shown in Figs. 5A and 7. A, PTMs on histone(3–8) peptide TKQTAR, very low levels of K4me2/3 were detected and not shown. B, PTMs on H3(18–26) peptide KQLATKAAR, very low levels of K18me1 and K23me1 were detected and not shown. C, PTMs on H3.1/2(27–40) peptide KSAPATGGVKKPHR, no K27ac was detected. D, PTMs on H3.3(27–40) peptide KSAPSTGGVKKPHR, no K27ac or Ser-28/Ser-31 phosphorylation was detected in the input samples. E, PTMs on H4(4–17) peptide GKGGKGLGKGGAKR; shown are levels of acetylation events on one, two, or three lysine residues on this peptide, with very low levels of 4-ac detected and not shown. F, PTMs on H4(20–23) peptide KVLR; Lys-20 methylation is cell cycle-regulated, and very low levels of K20un and K20me1 were detected in mitosis and not shown. G, K25me1 on H1.4(25–32) peptide KSAGAAKR.
FIGURE 7.

Hesperadin treatments reduced histone phosphorylation levels but did not impact their distribution patterns. Hes treatments reduced H3T3/T6ph (A), H3.1/2S28ph (B), and H1.4S26ph (C) levels, but it did not change the asymmetric distribution of these marks. *, p < 0.05; **, p < 0.01. D and E, bar graphs show relative abundance of histone protein SILAC labeling and phosphorylation mark distribution on H3 (D) and H1.4 (E). Error bars show standard error. Data were collected three late mitosis time points (11 h and beyond).
Inhibiting Aurora B Does Not Affect the Asymmetry of Histone Phosphorylations
Next, we sought to investigate the impact of inhibiting Aurora B on the distribution of H3S10ph and other phosphorylation marks. Fig. 5, D–F, shows DMSO- and Hes-treated HeLa cells, respectively, from the same pulse-SILAC experiment with four time points. As shown in Fig. 5D, essentially no difference was seen in the distribution of H3S10ph between DMSO- and Hes-treated HeLa cells. Both populations showed enrichment of H3S10ph on the old H3 in an earlier time point (6 h) and symmetric distribution at later time points (11–13 h). In both samples, the percentage of Ser-10 phosphorylation on the new H3 lagged behind in the early 6-h time point, but ultimately it reached a similar level as the old H3 (11–13 h) (Fig. 5, E and F). In addition, the asymmetric distribution of other asymmetric histone phosphorylation marks was not affected by Hes treatment despite an overall decrease in their levels (Fig. 7, D and E). Thus, as the enzymatic activity of Aurora B was inhibited, the reduction in substrate phosphorylation manifested proportionally. These results suggested that Aurora B functioned downstream of the marker distinguishing old versus new histones.
Discussion
Mass Spectrometry Provides a Powerful Tool to Study Dynamics of Histone PTMs
Traditional antibody-based techniques are limited to recognize only one or a few PTMs at a time. They also suffer from potential off-target issues and epitope masking effects. Indeed, both of these issues have been reported with commercially available antibodies against H3S10ph (42, 43). Antibody-related issues may therefore contribute to some discrepancies in the literature regarding the function of Ser-10 phosphorylation (44–46). Over the last decade, mass spectrometry has become a powerful and unbiased tool for histone PTM analysis. Using MS-based technologies, we not only can identify multiple PTMs simultaneously but also perform pulse-chase experiments on histone proteins. Combining MS and SILAC, we have shown that histone serine and threonine phosphorylations have asymmetric distributions in mitosis.
We used pulse-SILAC to label new histone synthesis. In theory, after one cell cycle division, the canonical histone protein abundance should double in the cells, and half of them should be labeled with SILAC media. However, we have never achieved greater than 40% labeling of canonical histones (Figs. 2A, 4, B and E, and 7, D and E). A number of factors could contribute to the incomplete labeling, including incomplete synchronization, impurities in the stable isotope-labeled compounds, and most importantly, the fact that cells recycle cellular metabolites to make new histones in S phase. Similar labeling efficiencies have been reported by us and others (9–11).
To rule out any potential artifacts that were linked to the heavy isotope labeling, one of our pulse-SILAC experiments was performed in a reverse fashion. HeLa cells were first cultured in heavy media for an extended period of time (more than 1 week with at least seven passages) to get complete labeling of the heavy-isotope amino acids (Arg and Met). Subsequently, these cells were subjected to a double thymidine block and were pulse-labeled in light media. These results, shown in Fig. 3, were highly consistent with light-to-heavy pulse-SILAC experiments.
H3.1/2 and H3.3 Show Different PTM Dynamics
To be noted, our analyses of histone H3 synthesis, H3S10ph, and Thr-3/Thr-6 phosphorylation include both the canonical histone H3.1/2 and H3.3 because we could not distinguish the variants in bottom-up mass spectrometry based on the peptides used (supplemental Tables S1–S3 and S5). In our experiments, the only peptide that can be used to distinguish between H3.1/2 and H3.3 levels was the H3(27–40) peptide as the 31st amino acid residue is different (H3.1/2, KSAPATGGVKKPHR; H3.3, KSAPSTGGVKKPHR) (Fig. 8B). However, this peptide has no less than 50 forms on each protein (supplemental Table S7) when labeled with heavy-Arg. The number of possible forms is even larger when using both heavy-Arg and heavy-Met in the media, making it impractical to analyze from a technical standpoint. We therefore only showed data for this peptide from pulse-SILAC experiments that have solely heavy-Arg labeling (Figs. 2B, 3, C and D, and 7, B and D). Importantly, although H3.3 synthesis occurs throughout the cell cycle (3), its relative level remained to be a small portion of total H3. For example, H3.3 was 5.4 and 5.5% of total H3 in a HeLa cell pulse-SILAC experiment at two different time points (8.5 and 11 h), respectively. When we used the H3(27–40) peptide to estimate protein synthesis in our experiments (supplemental Table S7), we obtained very similar relative abundance of old and new H3 (difference <1%) between H3.1/2(27–40) peptide and four unmodified peptides that are shared by H3.1/2/3 (Fig. 2A).
FIGURE 8.

Preferential PTMs on old histones in mitosis. Schematic showing major findings of this study. A, preferential phosphorylations on old histones in early mitosis. Histone H1 and H3/H4 tetramers are shown. Open circles indicate old histones and closed circles indicate newly synthesized canonical histones. According to previous studies (6–8), histone H3/H4 tetramers have very low split rates and therefore old H3/H4 stay together. In early mitosis, most mitotic histone phosphorylation events preferentially happened on old histone H1 and H3. In late mitosis, both old and new histones were phosphorylated. The mitotic phosphorylations were erased before cells enter the next G1 phase. Our data suggested that one or more markers (Ma) were involved in marking the old versus new histones in S, G2, and early mitosis. B, shown are histone PTMs that were enriched on old histones in mitosis (Table 1). Only partial protein sequence is shown for each histone. Peptide sequences that were not analyzed in this study are in gray. The H3.1/2(27–40) peptide is in blue, and the H3.3(27–40) peptide is in red. The line connecting the four acetylation marks on H4(2–16) peptide indicates only the four-ac was enriched on old H4 but not two-ac or three-ac (Table 1).
Our examination of the H3(27–40) peptide in both H3.1/2 and H3.3 demonstrated that the distributions of PTMs on H3.1/2 and H3.3 were highly similar with only two exceptions, Ser-28 phosphorylation and K27me2. Although both were enriched on the old histone H3.1/2, their counterparts were symmetrically distributed on H3.3 (Table 1 and Fig. 8B).
Histone H3T80ph and H4S47ph Were Not Detected in Mitosis
We did not identify any H3T80 phosphorylation in our samples, despite the recent report about mitosis-specific Thr-80 phosphorylation (43). Additionally, we did not detect any histone H4S47ph in any of our samples. This result was not surprising because H4S47ph is catalyzed by the Pak2 kinase, which is not mitosis-specific (47).
Relative Abundance and Normalized Distribution
Because of technical limitations, including inconsistency in cell cycle synchronization and SILAC media incorporation, we observed a relatively large variation in the relative abundance measurements of mitosis-specific PTMs across different pulse-SILAC experiments. For example, the relative abundance of H3S10ph levels varied from ∼20 to ∼50% at the 11-h time point across four experiments (Fig. 3C). To address this issue, we introduced the normalized distribution of PTMs in this study. As shown in Fig. 3A, the normalized distributions of H3S10ph at the four 11-h time points were more similar to each other than the relative abundances (Fig. 3C).
In addition, we provide a snapshot of the normalized distributions of 57 histone PTM statuses in Fig. 2B. We also showed the relative abundances of these PTM statuses in Fig. 2B and Table 1. The higher the abundance of a particular PTM was, the more confident we were. In general, we saw good reproducibility among experiments for any PTM status having a relative abundance above 1%.
Possible Mechanisms That Distinguish Old and New Histones
It was intriguing to discover the asymmetric distribution of histone phosphorylation events on old and new histones in mitosis (Fig. 8A). Based on our observations, we hypothesized that there was one or more marker(s) associated with either the old or new copies of histone proteins. The marker(s) should be added onto histones at S phase, either marking the old or newly synthesized histones. Subsequently, the marker(s) should remain associated with the old or new histones until late G2 and/or M phase as the histone phosphorylation events start. The marker(s) should be recognized by mitotic kinases that are responsible for histone phosphorylation. Finally, the marker(s) should be highly abundant, at least as abundant as the phosphorylation marks. We found asymmetric phosphorylation marks on both core histone H3 and linker histone H1.4, suggesting a common mechanism for all histone phosphorylation marks. Interestingly, Ser-10 phosphorylation but not Ser-28 phosphorylation on H3.3 is asymmetrically distributed (Figs. 3D and 4C), suggesting an alternative model that site-specific markers function locally. Our results suggested both mechanisms could exist and function coherently. Further investigation is needed to identify the molecular identity of the marker(s).
Our first candidate for the local marker of H3S10ph was H3K9me3 given its distribution pattern in mitosis (Fig. 2B), as well as the fact that H3S10ph is often associated with a neighboring K9me3 (Fig. 4A). Surprisingly, we showed in Fig. 4C that the Lys-9 residue was dispensable for the asymmetric distribution of Ser-10 phosphorylation. In addition, reduction in K9me2/3 levels did not change the global level of Ser-10 phosphorylation (Fig. 4, D–F). Therefore, K9me3 was unlikely to function as the marker for the asymmetric distribution of the neighboring Ser-10 phosphorylation on the same H3 tail.
Our data, however, did not rule out the possibility that the K9me3 on the other H3 molecule within the same nucleosome served as the marker for Ser-10 phosphorylation. Because the majority of H3/H4 tetramers (including most H3.3/H4 tetramers) do not split after replication (6–8), the H3/H4 tetramers are either old or new. Thus, H3K9me3 might still serve as the local marker for the distribution of the H3S10ph in the same nucleosome. Similarly, K27me2/3 might be the local marker for H3.1/2S28ph because the K27me2/3-Ser(P)-28 pair resembled many features of K9me3-Ser(P)-10. In contrast, K9me2/3 and K27me2/3 were not likely to be the markers for H3T3/6ph or the linker histone H1.4S26ph, especially given that H1.4 did not reside in the nucleosomes. Further investigation is required to test these ideas.
Intriguingly, a similar phenomenon was recently reported in the Drosophila male germ line (48, 49), where the germ line stem cells (GSCs) undergo asymmetric cell division to generate one GSC and one differentiating daughter cell. Chen and co-workers (48) discovered that old/pre-existing canonical histone H3 but not H3.3 were selectively segregated to the daughter GSC. They further showed that H3T3ph was required for the asymmetric inheritance of H3, and they suggested it was required in a specific time window (prophase to metaphase) (49). The asymmetric cell division is only limited to Drosophila GSCs and is not seen in surrounding somatic tissues, so is the asymmetric distribution of H3T3ph and directional inheritance of histone H3 (48, 49). However, the observations are highly similar to ours in this study that mitotic histone ph mark(s) is(are) enriched on the old histones in early mitosis, suggesting the underlying mechanism is conserved between Drosophila and humans.
Epigenetic Inheritance of Histone PTMs
Two distinct models have been proposed regarding how the epigenetic information of histone PTMs is carried through DNA replication as follows: either the enzymes or the PTMs are associated with chromatin and presumably will guide the inheritance after replication. Mazo and co-workers (50, 51) have shown in Drosophila embryos that the H3K4me3 and H3K27me3 are lost during replication, whereas the methyltransferases responsible are retained on chromosome, suggesting the former mechanism. Contradicting results from Strome and co-workers (52) showed that the H3K27me3 remains on chromatin in Caenorhabditis elegans from germline to the next generation. We and others (9–11) have previously studied histone methylation kinetics in the human cell cycle, revealing that overall levels of H3K9me2/3 and H3K27me2/3 are not significantly reduced in S phase. The decreases in relative abundance can be explained by dilution effects from the newly synthesized histones. In this study we further showed that many other histone PTMs, including H3K36me2/3 and H3K79me1/2/3, were enriched on old histones during mitosis (Figs. 2A and 8B and Table 1), supporting the observations seen in C. elegans that histone PTMs themselves are maintained for epigenetic inheritance. In addition, our results also suggested that the corresponding enzymes responsible for these PTMs would propagate the information from old histones to new histones after histone synthesis in S phase. The differences in the spatial and temporal activities of these enzymes might be responsible for the distributions we observed in this study. For example, H3K9me2/3 and H3K27me2/3 do not recover to their original level until the end of the next G1 phase, suggesting that the responsible enzymes are mainly active during G1.
Histone acetylations are another major category of PTMs commonly seen on histones. It is long established that newly synthesized H3 and H4 carry acetylation (ac) marks and that deacetylation is essential for the assembly process (6), although it remains unclear how the cell manages both deacetylation and epigenetic inheritance of acetylation at the same time. We showed in this study that most H3 and H4 ac marks, including H3K9ac, H3K14ac, H3K18/23ac, H3K18acK23ac, and H4(4–17) one-ac, were symmetrically distributed (Fig. 2B and Table 1). Two ac marks, namely H4(4–17) two-ac and H4(4–17) three-ac were enriched on new histones (Fig. 2B and Table 1). These two ac marks were of rather low abundance (<10%) and showed a decreasing trend from the 8.5-h time point to the 11-h time point, which suggested that they were from a small percentage of S phase cells (53, 54). Interestingly, H4(4–17) four-ac (K5acK8acK12acK16ac) was enriched on the old histones at both time points (Table 1 and Fig. 8B), suggesting that the epigenetic inheritance of this highly acetylated form (four-ac) of H4 was regulated differently from its less acetylated forms (one- to three-ac).
Biological Function of Histone Phosphorylations
Extensive work has been conducted to uncover the biological functions of histone phosphorylation marks (45, 46, 55–57). A common view is that they play distinct roles in interphase and mitosis. Several phosphorylation marks are implicated in transcriptional regulation of individual genes during interphase (58–63). However, their roles in mitosis remain elusive, despite the fact that the abundance of these marks is generally much higher in mitosis than in interphase (15–21). Our discovery about the asymmetric distribution of these marks might provide the first step toward understanding their function in mitosis. We originally hypothesized that histone phosphorylation marks served as indicators for distinguishing new versus old histones and were involved in guiding the inheritance of other histone PTMs. The reason that phosphorylation levels peak in mitosis may be because this is the only period during which the cell must differentiate old from new. However, H3K9me2 was the only other PTM affected by inhibiting Aurora B in mitosis, despite the fact that all four asymmetric histone phosphorylation marks were reduced drastically (Figs. 5A and 7, A–C). These results suggested that histone phosphorylation marks were not directly involved in epigenetic inheritance of most PTMs, with the caveat that the time frame of our experiments might have been too short to reveal the impact.
Although most Kme2/3s were enriched on the old histones in mitosis, H3K9me2 showed a symmetric distribution (Fig. 2B and Table 1). Therefore, it was surprising that H3K9me2, but not H3K9me3, was affected by Aurora B inhibition (Fig. 5A). As discussed previously, H3S10ph and/or Aurora B might be involved in either maintenance of old K9me2 or generation of new K9me2. Our results favored the latter model as we showed a significant difference in K9me2 levels on the new H3 but not the old H3 between DMSO and Hes treatments (Fig. 5, B and C). This observation was contradictory to previous work that showed Suv39h1 was incapable of methylating a Ser-10 phosphorylation peptide in vitro (35). The discrepancy may be due to either indirect interaction of H3K9me2-S10ph/Aurora B (i.e. mediated by other proteins) or technical limitations in the in vitro methyltransferase assay. In addition, the reduction in H3K9me2 levels was rather small, compared with the drop in H3S10ph and other phosphorylation mark levels. This could be due to an indirect impact of Hes treatments and therefore did not represent a cross-talk between H3S10ph/Aurora B and H3K9me2. Further work is required to investigate this potential cross-talk.
Experimental Procedures
Tissue Culture and Synchronization
HeLa S3 cells were cultured and maintained in suspension as described previously (64). In brief, HeLa cells were cultured in Minimum Essential Medium Eagle's Joklik Modification with l-glutamine (Sigma) supplemented with 10% Hyclone® new calf serum (GE Healthcare) and 100 units/ml penicillin/streptomycin (Life Technologies, Inc.). HeLa cells were maintained in a density between 1 × 10⁵ and 1 × 10⁶ cells/ml. The cell synchronization procedure is illustrated in Fig. 1A. For the double thymidine block, 2.5 mm thymidine (Acros Organics) was added to the media. The first block was 18–19 h. Cells were subsequently released for 8.5–10 h in media without thymidine and subjected to a second block with 2.5 mm thymidine for 15–17 h. For experiments with nocodazole, 0.1 μg/ml nocodazole (EMD Millipore) was supplemented with normal media after the double thymidine block. For experiments with the Aurora B inhibitor hesperadin, 100 nm hesperadin (EMD Millipore) or equivalent DMSO solvent was added to the media at 2 h after the double thymidine block. For different time points collected from the same experiment, a portion was removed from the suspension culture at each time point and analyzed by flow cytometry or mass spectrometry.
HFF cells and 293T cells were cultured and maintained as described previously (33, 34). Briefly, HFF and 293T cells were cultured in Dulbecco's modification of Eagle's medium (DMEM) with high glucose (Life Technologies, Inc.), supplemented with 10% fetal bovine serum (FBS) (Sigma). HFF cells were cultured below ∼80% confluency to avoid a contact inhibition-induced quiescence state. Cells below 13 passages were used. 293T cells were supplemented with 3 μg/ml puromycin (Santa Cruz Biotechnology) to maintain the HA- and FLAG-tagged H3.3 (WT or K9M) transgene. For synchronization of HFF and 293T cells, cells were plated at 20–25% confluency and subjected to serum starvation with 0.1% FBS for 24 h. Subsequently media with 10% FBS and 2 mm hydroxyurea were added for 18 h. Normal growth media with 0.1 μg/ml nocodazole was subsequently introduced for releasing. G/2 M cells were collected 6–7 h after releasing (Fig. 1B). For different time points collected from the same experiment, cells were plated separately in different tissue culture wells/plates but at identical densities and treated the same.
SILAC Medium Preparation
DMEM lacking l-arginine and l-methionine was purchased (AthenaES or Thermo Fisher Scientific Inc.). Joklik medium lacking l-arginine and l-methionine was made from powdered Joklik mixture (Sigma) and supplemented with all the necessary vitamins and amino acids (excluding l-arginine and l-methionine) based on the standard recipe. The SILAC medium was supplemented with 10% dialyzed FBS (Thermo Fisher Scientific Inc.), as well as l-arginine-13C6, 15N4-HCl (Cambridge Isotope Labs.) and l-methionine-(methyl-13C,D3) (Sigma), or regular light l-methionine (Sigma) according to the standard recipe. Light l-proline (Sigma) was also added to the medium at 200 mg/liter to prevent conversion from the heavy arginine (30).
Histone Extraction, Phosphorylated Peptide Enrichment
Histones were acid-extracted from cells and processed with two rounds of chemical derivatization, trypsin digestion, and desalting by Stage-Tips as described previously (65). These samples were either subjected directly to on-line nano-LC/MS/MS (input samples) or were enriched for phosphorylated peptides.
Phosphorylated peptide enrichment by TiO2 was performed as described previously (65–68). Briefly, propionylated and desalted histone peptides were mixed with at least a 4-fold excess of TiO2 beads (GL Sciences) in 200 μl of loading buffer (2 m lactic acid (Sigma) in 50% acetonitrile (ACN)). TiO2 micro-columns are made in the same way as Stage-Tips with a C8 mini-disk plug at the bottom of the tip. The histone peptide and TiO2/bead mixture were added onto the micro-column and centrifuged at 200 × g for 10–20 min. The micro-column was then rinsed with 200 μl of loading buffer and 2× 200 μl of wash buffer (50% ACN with 0.1% trifluoroacetic acid) at 1000 × g. Elution was performed twice with 200 μl of elution buffer (50 mm KH2PO4 in 50% ACN, pH 10.0) at 200 × g. TiO2-enriched samples were acidified with glacial acetic acid. The samples were then desalted using Stage-Tips and subjected to on-line nano-LC/MS/MS.
Nano-Liquid Chromatography Electrospray Ionization Tandem Mass Spectrometry (Nano-LC/MS/MS) and Data Analysis
The samples were loaded onto one of the three instrument setups as shown in supplemental Table S1, all at 300 nl/min. Histone peptides were resolved on a two-step gradient from 2% ACN to 30% ACN in 0.1% formic acid over 40 min and then from 30 to 95% ACN in 0.1% formic acid over 20 min. The mass spectrometers were operated in the data-dependent mode with dynamic exclusion enabled (repeat count, 1; exclusion duration, 0.5 min). MS instrument methods were set up as reported previously (2). Settings for resolution, automatic gain control, and normalized collision energy are listed in supplemental Table S1. For every cycle, one full MS scan (m/z 290 to 1600) was collected and followed by 10 MS/MS scans using either high energy C-trap dissociation or collision-induced dissociation in the ion trap (supplemental Table S1). All isolation windows were set at 2.0 m/z. Ions with a charge state of 1 and a rejection list of common contaminant ions (including keratin, trypsin, and BSA) (exclusion width = 10 ppm) were excluded from MS/MS.
For each MS run, 1–2 μg of input samples were loaded. For TiO2-enriched samples, 20–300 μg of equivalent were loaded. A minimum of triplicates was performed for each sample, except for one time point from a HeLa cell pulse-SILAC that only two good quality runs were achieved. As illustrated previously (65), we targeted the m/z for the isobaric peptides and quantified the relative abundance of their unique b or y ions at the MS/MS level. Subsequently, we determined the relative abundance at the MS1 level based on the ratios we obtained, either manually or by a Matlab-based program, EpiProfile (69). Data were corrected for differences in detection efficiencies based on the correction factors generated by a synthetic peptide library as described previously (70). For phosphorylated peptides that were not included in the synthetic peptide library, an average correction factor generated from all the peptides with the same histone backbone was used. For the histone H3.3(27–40) peptide, the H1.4(25–32) peptide, and the K9M(9–17) peptide, no correction factors were available, and thus no correction was performed.
MH+ masses of peptides quantified are listed in supplemental Tables S2 to S8. Most pulse-SILAC experiments were performed with the light-to-heavy media switch, with either both heavy-Arg and heavy-Met labeling or just heavy-Arg labeling. One pulse-SILAC experiment for HeLa cells was performed with heavy-to-light media switch, with both heavy-Arg and heavy-Met labeling in the original media. Histone H3(9–17) peptides quantified are listed in supplemental Table S2 with both heavy-Arg and heavy-Met labeling and supplemental Table S3 with just heavy-Arg labeling. For quantification of old versus new histone H3 and H4 proteins, four peptides from H3 and two peptides from H4 that are typically unmodified in mitosis were used to generate an average number for new protein synthesis (supplemental Table S4). For each peptide, the light and heavy peptides were quantified, and the sum was set to be 100%. We also monitored all peptides in supplemental Table S4 in this analysis for any potential PTMs but did not identify any in our experiments as expected. The supplemental Tables S5–S7 show additional peptides quantified. For differentially SILAC-labeled methylated peptides of the same modification (e.g. Lys-9me3:0, Lys-9me3:1, Lys-9me3:2, and Lys-9me3:3), the relative quantification of all these forms were combined and summarized. An example is given in supplemental Table S9.
PTM Distribution Normalization
The SILAC labeling of newly synthesized histone proteins was incomplete, i.e. we did not get 50% labeling of histones, presumably because of recycling of cellular amino acids. To account for this incomplete labeling, we normalized the distribution of PTMs based on the corresponding histone protein labeling efficiency. The normalized distribution was calculated for each pulse-SILAC time point as shown in Equation 2,
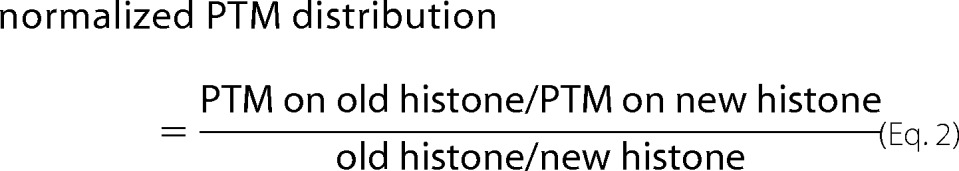 |
For the K9me2 on old or new H3 shown in Fig. 5, B and C, the normalized distribution was calculated as shown in Equations 3 and 4,
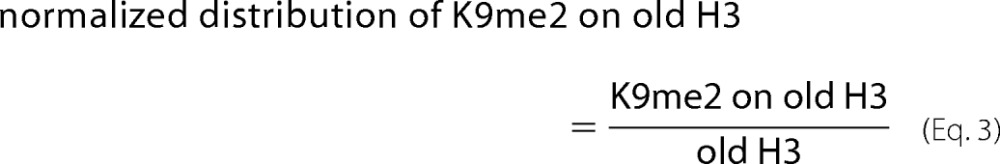 |
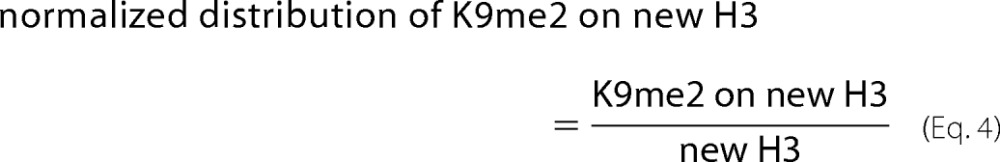 |
Old and new H3 and H4 proteins were quantified based on multiple peptides listed in supplemental Table S4. The H1.4 protein was quantified based on the 25–32 peptide shown in supplemental Table S6. H3.1/2 and H3.3 proteins were quantified based on the 27–40 peptide shown in supplemental Table S7. H3.3K9M peptides were listed in supplemental Table S8.
Statistical Analysis
The p values were generated by Student's t test (two-tailed).
Mass Spectrometry Data
The mass spectrometry proteomics data have been deposited to the ProteomeXchange Consortium via the PRIDE (71) partner repository with the dataset identifier PXD003709 and 10.6019/PXD003709.
Propidium Iodide (PI) Staining and Flow Cytometry Analysis
As described previously (9), cells were fixed in 70–80% ethanol and stained by PI for flow cytometry analysis. Briefly, one to three million cells were collected and rinsed with phosphate-buffered saline (PBS). Cells were subsequently resuspended in 1 ml of 4 °C PBS. 100% ethanol (−20 °C) was then added in a dropwise fashion to reach a total volume of >5 ml with moderate vortexing. After fixation overnight at 4 °C, cells were washed with PBS twice. Cells were then incubated with 0.08 mg/ml PI (EMD Millipore) and 0.02 mg/ml RNaseA (Roche Applied Science) in PBS for >1 h in the dark at room temperature. Flow cytometry was performed in either the Princeton University Flow Cytometry Resource Facility or the University of Pennsylvania Flow Cytometry and Cell Sorting Resource Laboratory. Data figures were generated using FlowJo.
Metabolomics Analyses
As described previously (9), metabolites were extracted from frozen cell pellets with 40% ACN, 40% methanol, and 0.1% formic acid on ice and centrifuged at 5000 × g to collect the supernatant. The supernatant was clarified by centrifugation at 16,000 × g prior to MS analyses. [12C6,14N4]- and [13C6,15N4]arginine, [12C5,14N]- and [13C5,15N]proline, and [12C,H3]- and [13C,D3]AdoMet were quantified as described previously (72).
Author Contributions
S. L. designed and performed the experiments and wrote the manuscript; Y. H. performed some 293T cell experiments; Z. Y. analyzed some data; D. M. M. performed some 293T cell experiments. B. A. G. designed the project.
Supplementary Material
Acknowledgments
We thank Adam G. Evertts and Hilary A. Coller (UCLA) for HFF cells; Peter Lewis (Wisconsin Institute for Discovery) for H3.3K9M 293T cells; Wenyun Lu and Joshua Rabinowitz (Princeton University) for metabolomics analysis; Bing He, Yao Yao, Li Yang, and Kelly Karch for reading and revising the manuscript; Ben E. Black, Hua-Ying Fan, Roberto Bonasio, Johayra S. Williams, Simone Sidoli, Barry M. Zee, and Rosalynn C. Molden for useful discussions; Christina DeCoste (Princeton University Flow Cytometry Resource Facility) and Hank Pletcher (University of Pennsylvania Flow Cytometry and Cell Sorting Resource Laboratory) for flow cytometry analysis.
This work was supported by a National Science Foundation CAREER award and National Institutes of Health Grants GM110174 and AI118891 (to B. A. G.). The authors declare that they have no conflicts of interest with the contents of this article. The content is solely the responsibility of the authors and does not necessarily represent the official views of the National Institutes of Health.

This article contains supplemental Tables S1–S9.
- PTM
- post-translational modification
- SILAC
- stable isotope labeling by amino acids in cell culture
- HFF
- human foreskin fibroblast
- ACN
- acetonitrile
- Hes
- hesperadin
- GSC
- germ line stem cell
- ac
- acetylation
- ph
- phosphorylation
- PI
- propidium iodide
- AdoMet
- S-adenosylmethionine.
References
- 1. Heintz N. (1991) The regulation of histone gene expression during the cell cycle. Biochim. Biophys. Acta 1088, 327–339 [DOI] [PubMed] [Google Scholar]
- 2. Osley M. A. (1991) The regulation of histone synthesis in the cell cycle. Annu. Rev. Biochem. 60, 827–861 [DOI] [PubMed] [Google Scholar]
- 3. Wu R. S., Tsai S., and Bonner W. M. (1982) Patterns of histone variant synthesis can distinguish G0 from G1 cells. Cell 31, 367–374 [DOI] [PubMed] [Google Scholar]
- 4. Bird A. (2007) Perceptions of epigenetics. Nature 447, 396–398 [DOI] [PubMed] [Google Scholar]
- 5. Goldberg A. D., Allis C. D., and Bernstein E. (2007) Epigenetics: a landscape takes shape. Cell 128, 635–638 [DOI] [PubMed] [Google Scholar]
- 6. Annunziato A. T. (2015) The fork in the road: histone partitioning during DNA replication. Genes 6, 353–371 [DOI] [PMC free article] [PubMed] [Google Scholar]
- 7. Xu M., Long C., Chen X., Huang C., Chen S., and Zhu B. (2010) Partitioning of histone H3-H4 tetramers during DNA replication-dependent chromatin assembly. Science 328, 94–98 [DOI] [PubMed] [Google Scholar]
- 8. Huang C., Zhang Z., Xu M., Li Y., Li Z., Ma Y., Cai T., and Zhu B. (2013) H3.3-H4 tetramer splitting events feature cell-type specific enhancers. PLoS Genet. 9, e1003558. [DOI] [PMC free article] [PubMed] [Google Scholar]
- 9. Zee B. M., Britton L.-M., Wolle D., Haberman D. M., and Garcia B. A. (2012) Origins and formation of histone methylation across the human cell cycle. Mol. Cell. Biol. 32, 2503–2514 [DOI] [PMC free article] [PubMed] [Google Scholar]
- 10. Xu M., Wang W., Chen S., and Zhu B. (2012) A model for mitotic inheritance of histone lysine methylation. EMBO Rep. 13, 60–67 [DOI] [PMC free article] [PubMed] [Google Scholar]
- 11. Alabert C., Barth T. K., Reverón-Gómez N., Sidoli S., Schmidt A., Jensen O. N., Imhof A., and Groth A. (2015) Two distinct modes for propagation of histone PTMs across the cell cycle. Genes Dev. 29, 585–590 [DOI] [PMC free article] [PubMed] [Google Scholar]
- 12. Masumoto H., Hawke D., Kobayashi R., and Verreault A. (2005) A role for cell-cycle-regulated histone H3 lysine 56 acetylation in the DNA damage response. Nature 436, 294–298 [DOI] [PubMed] [Google Scholar]
- 13. Recht J., Tsubota T., Tanny J. C., Diaz R. L., Berger J. M., Zhang X., Garcia B. A., Shabanowitz J., Burlingame A. L., Hunt D. F., Kaufman P. D., and Allis C. D. (2006) Histone chaperone Asf1 is required for histone H3 lysine 56 acetylation, a modification associated with S phase in mitosis and meiosis. Proc. Natl. Acad. Sci. U.S.A. 103, 6988–6993 [DOI] [PMC free article] [PubMed] [Google Scholar]
- 14. Jørgensen S., Schotta G., and Sørensen C. S. (2013) Histone H4 lysine 20 methylation: key player in epigenetic regulation of genomic integrity. Nucleic Acids Res. 41, 2797–2806 [DOI] [PMC free article] [PubMed] [Google Scholar]
- 15. Hendzel M. J., Wei Y., Mancini M. A., Van Hooser A., Ranalli T., Brinkley B. R., Bazett-Jones D. P., and Allis C. D. (1997) Mitosis-specific phosphorylation of histone H3 initiates primarily within pericentromeric heterochromatin during G2 and spreads in an ordered fashion coincident with mitotic chromosome condensation. Chromosoma 106, 348–360 [DOI] [PubMed] [Google Scholar]
- 16. Goto H., Tomono Y., Ajiro K., Kosako H., Fujita M., Sakurai M., Okawa K., Iwamatsu A., Okigaki T., Takahashi T., and Inagaki M. (1999) Identification of a novel phosphorylation site on histone H3 coupled with mitotic chromosome condensation. J. Biol. Chem. 274, 25543–25549 [DOI] [PubMed] [Google Scholar]
- 17. Goto H., Yasui Y., Nigg E. A., and Inagaki M. (2002) Aurora-B phosphorylates histone H3 at serine 28 with regard to the mitotic chromosome condensation. Genes Cells 7, 11–17 [DOI] [PubMed] [Google Scholar]
- 18. Preuss U., Landsberg G., and Scheidtmann K. H. (2003) Novel mitosis-specific phosphorylation of histone H3 at Thr11 mediated by Dlk/ZIP kinase. Nucleic Acids Res. 31, 878–885 [DOI] [PMC free article] [PubMed] [Google Scholar]
- 19. Polioudaki H., Markaki Y., Kourmouli N., Dialynas G., Theodoropoulos P. A., Singh P. B., and Georgatos S. D. (2004) Mitotic phosphorylation of histone H3 at threonine 3. FEBS Lett. 560, 39–44 [DOI] [PubMed] [Google Scholar]
- 20. Hake S. B., Garcia B. A., Kauer M., Baker S. P., Shabanowitz J., Hunt D. F., and Allis C. D. (2005) Serine 31 phosphorylation of histone variant H3.3 is specific to regions bordering centromeres in metaphase chromosomes. Proc. Natl. Acad. Sci. U.S.A. 102, 6344–6349 [DOI] [PMC free article] [PubMed] [Google Scholar]
- 21. Hergeth S. P., Dundr M., Tropberger P., Zee B. M., Garcia B. A., Daujat S., and Schneider R. (2011) Isoform-specific phosphorylation of human linker histone H1.4 in mitosis by the kinase Aurora B. J. Cell Sci. 124, 1623–1628 [DOI] [PubMed] [Google Scholar]
- 22. Carmena M., Wheelock M., Funabiki H., and Earnshaw W. C. (2012) The chromosomal passenger complex (CPC): from easy rider to the godfather of mitosis. Nat. Rev. Mol. Cell. Biol. 13, 789–803 [DOI] [PMC free article] [PubMed] [Google Scholar]
- 23. Hsu J. Y., Sun Z. W., Li X., Reuben M., Tatchell K., Bishop D. K., Grushcow J. M., Brame C. J., Caldwell J. A., Hunt D. F., Lin R., Smith M. M., and Allis C. D. (2000) Mitotic phosphorylation of histone H3 is governed by Ipl1/aurora kinase and Glc7/PP1 phosphatase in budding yeast and nematodes. Cell 102, 279–291 [DOI] [PubMed] [Google Scholar]
- 24. Adams R. R., Maiato H., Earnshaw W. C., and Carmena M. (2001) Essential roles of Drosophila inner centromere protein (INCENP) and aurora B in histone H3 phosphorylation, metaphase chromosome alignment, kinetochore disjunction, and chromosome segregation. J. Cell Biol. 153, 865–880 [DOI] [PMC free article] [PubMed] [Google Scholar]
- 25. Giet R., and Glover D. M. (2001) Drosophila aurora B kinase is required for histone H3 phosphorylation and condensin recruitment during chromosome condensation and to organize the central spindle during cytokinesis. J. Cell Biol. 152, 669–682 [DOI] [PMC free article] [PubMed] [Google Scholar]
- 26. Hauf S., Cole R. W., LaTerra S., Zimmer C., Schnapp G., Walter R., Heckel A., van Meel J., Rieder C. L., and Peters J.-M. (2003) The small molecule Hesperadin reveals a role for Aurora B in correcting kinetochore-microtubule attachment and in maintaining the spindle assembly checkpoint. J. Cell Biol. 161, 281–294 [DOI] [PMC free article] [PubMed] [Google Scholar]
- 27. Wang F., Ulyanova N. P., van der Waal M. S., Patnaik D., Lens S. M., and Higgins J. M. (2011) A positive feedback loop involving Haspin and Aurora B promotes CPC accumulation at centromeres in mitosis. Curr. Biol. 21, 1061–1069 [DOI] [PMC free article] [PubMed] [Google Scholar]
- 28. Ong S.-E., Blagoev B., Kratchmarova I., Kristensen D. B., Steen H., Pandey A., and Mann M. (2002) Stable isotope labeling by amino acids in cell culture, SILAC, as a simple and accurate approach to expression proteomics. Mol. Cell. Proteomics MCP 1, 376–386 [DOI] [PubMed] [Google Scholar]
- 29. Fontecave M., Atta M., and Mulliez E. (2004) S-Adenosylmethionine: nothing goes to waste. Trends Biochem. Sci. 29, 243–249 [DOI] [PubMed] [Google Scholar]
- 30. Bendall S. C., Hughes C., Stewart M. H., Doble B., Bhatia M., and Lajoie G. A. (2008) Prevention of amino acid conversion in SILAC experiments with embryonic stem cells. Mol. Cell. Proteomics 7, 1587–1597 [DOI] [PMC free article] [PubMed] [Google Scholar]
- 31. Feng Q., Wang H., Ng H. H., Erdjument-Bromage H., Tempst P., Struhl K., and Zhang Y. (2002) Methylation of H3-lysine 79 is mediated by a new family of HMTases without a SET domain. Curr. Biol. 12, 1052–1058 [DOI] [PubMed] [Google Scholar]
- 32. Kim W., Choi M., and Kim J.-E. (2014) The histone methyltransferase Dot1/DOT1L as a critical regulator of the cell cycle. Cell Cycle 13, 726–738 [DOI] [PMC free article] [PubMed] [Google Scholar]
- 33. Evertts A. G., Zee B. M., Dimaggio P. A., Gonzales-Cope M., Coller H. A., and Garcia B. A. (2013) Quantitative dynamics of the link between cellular metabolism and histone acetylation. J. Biol. Chem. 288, 12142–12151 [DOI] [PMC free article] [PubMed] [Google Scholar]
- 34. Lewis P. W., Müller M. M., Koletsky M. S., Cordero F., Lin S., Banaszynski L. A., Garcia B. A., Muir T. W., Becher O. J, and Allis C. D. (2013) Inhibition of PRC2 activity by a gain-of-function H3 mutation found in pediatric glioblastoma. Science 340, 857–861 [DOI] [PMC free article] [PubMed] [Google Scholar]
- 35. Rea S., Eisenhaber F., O'Carroll D., Strahl B. D., Sun Z. W., Schmid M., Opravil S., Mechtler K., Ponting C. P., Allis C. D., and Jenuwein T. (2000) Regulation of chromatin structure by site-specific histone H3 methyltransferases. Nature 406, 593–599 [DOI] [PubMed] [Google Scholar]
- 36. Fischle W., Tseng B. S., Dormann H. L., Ueberheide B. M., Garcia B. A., Shabanowitz J., Hunt D. F., Funabiki H., and Allis C. D. (2005) Regulation of HP1-chromatin binding by histone H3 methylation and phosphorylation. Nature 438, 1116–1122 [DOI] [PubMed] [Google Scholar]
- 37. Demidov D., Hesse S., Tewes A., Rutten T., Fuchs J., Ashtiyani R. K., Lein S., Fischer A., Reuter G., and Houben A. (2009) Aurora1 phosphorylation activity on histone H3 and its cross-talk with other post-translational histone modifications in Arabidopsis. Plant J. 59, 221–230 [DOI] [PubMed] [Google Scholar]
- 38. Hirota T., Lipp J. J., Toh B.-H., and Peters J.-M. (2005) Histone H3 serine 10 phosphorylation by Aurora B causes HP1 dissociation from heterochromatin. Nature 438, 1176–1180 [DOI] [PubMed] [Google Scholar]
- 39. Lachner M., O'Carroll D., Rea S., Mechtler K., and Jenuwein T. (2001) Methylation of histone H3 lysine 9 creates a binding site for HP1 proteins. Nature 410, 116–120 [DOI] [PubMed] [Google Scholar]
- 40. Nakayama J., Rice J. C., Strahl B. D., Allis C. D., and Grewal S. I. (2001) Role of histone H3 lysine 9 methylation in epigenetic control of heterochromatin assembly. Science 292, 110–113 [DOI] [PubMed] [Google Scholar]
- 41. Sessa F., Mapelli M., Ciferri C., Tarricone C., Areces L. B., Schneider T. R., Stukenberg P. T., and Musacchio A. (2005) Mechanism of Aurora B activation by INCENP and inhibition by hesperadin. Mol. Cell 18, 379–391 [DOI] [PubMed] [Google Scholar]
- 42. Duan Q., Chen H., Costa M., and Dai W. (2008) Phosphorylation of H3S10 blocks the access of H3K9 by specific antibodies and histone methyltransferase. Implication in regulating chromatin dynamics and epigenetic inheritance during mitosis. J. Biol. Chem. 283, 33585–33590 [DOI] [PMC free article] [PubMed] [Google Scholar]
- 43. Hammond S. L., Byrum S. D., Namjoshi S., Graves H. K., Dennehey B. K, Tackett A. J., and Tyler J. K. (2014) Mitotic phosphorylation of histone H3 threonine 80. Cell Cycle 13, 440–452 [DOI] [PMC free article] [PubMed] [Google Scholar]
- 44. Prigent C., and Dimitrov S. (2003) Phosphorylation of serine 10 in histone H3, what for? J. Cell Sci. 116, 3677–3685 [DOI] [PubMed] [Google Scholar]
- 45. Pérez-Cadahía B., Drobic B., and Davie J. R. (2009) H3 phosphorylation: dual role in mitosis and interphase. Biochem. Cell Biol. 87, 695–709 [DOI] [PubMed] [Google Scholar]
- 46. Sawicka A., and Seiser C. (2012) Histone H3 phosphorylation–a versatile chromatin modification for different occasions. Biochimie 94, 2193–2201 [DOI] [PMC free article] [PubMed] [Google Scholar]
- 47. Kang B., Pu M., Hu G., Wen W., Dong Z., Zhao K., Stillman B., and Zhang Z. (2011) Phosphorylation of H4 Ser 47 promotes HIRA-mediated nucleosome assembly. Genes Dev. 25, 1359–1364 [DOI] [PMC free article] [PubMed] [Google Scholar]
- 48. Tran V., Lim C., Xie J., and Chen X. (2012) Asymmetric division of Drosophila male germline stem cell shows asymmetric histone distribution. Science 338, 679–682 [DOI] [PMC free article] [PubMed] [Google Scholar]
- 49. Xie J., Wooten M., Tran V., Chen B.-C., Pozmanter C., Simbolon C., Betzig E., and Chen X. (2015) Histone H3 threonine phosphorylation regulates asymmetric histone inheritance in the Drosophila male germline. Cell 163, 920–933 [DOI] [PMC free article] [PubMed] [Google Scholar]
- 50. Petruk S., Sedkov Y., Johnston D. M., Hodgson J. W., Black K. L., Kovermann S. K., Beck S., Canaani E., Brock H. W., and Mazo A. (2012) TrxG and PcG proteins but not methylated histones remain associated with DNA through replication. Cell 150, 922–933 [DOI] [PMC free article] [PubMed] [Google Scholar]
- 51. Petruk S., Black K. L., Kovermann S. K., Brock H. W., and Mazo A. (2013) Stepwise histone modifications are mediated by multiple enzymes that rapidly associate with nascent DNA during replication. Nat. Commun. 4, 2841. [DOI] [PMC free article] [PubMed] [Google Scholar]
- 52. Gaydos L. J., Wang W., and Strome S. (2014) Gene repression. H3K27me and PRC2 transmit a memory of repression across generations and during development. Science 345, 1515–1518 [DOI] [PMC free article] [PubMed] [Google Scholar]
- 53. Sobel R. E., Cook R. G., Perry C. A., Annunziato A. T., and Allis C. D. (1995) Conservation of deposition-related acetylation sites in newly synthesized histones H3 and H4. Proc. Natl. Acad. Sci. U.S.A. 92, 1237–1241 [DOI] [PMC free article] [PubMed] [Google Scholar]
- 54. Jasencakova Z., Scharf A. N., Ask K., Corpet A., Imhof A., Almouzni G., and Groth A. (2010) Replication stress interferes with histone recycling and predeposition marking of new histones. Mol. Cell 37, 736–743 [DOI] [PubMed] [Google Scholar]
- 55. Oki M., Aihara H., and Ito T. (2007) Role of histone phosphorylation in chromatin dynamics and its implications in diseases. Subcell. Biochem. 41, 319–336 [PubMed] [Google Scholar]
- 56. Cerutti H., and Casas-Mollano J. A. (2009) Histone H3 phosphorylation: universal code or lineage specific dialects? Epigenetics 4, 71–75 [DOI] [PubMed] [Google Scholar]
- 57. Pérez-Cadahía B., Drobic B., Khan P., Shivashankar C. C., and Davie J. R. (2010) Current understanding and importance of histone phosphorylation in regulating chromatin biology. Curr. Opin. Drug Discov. Dev. 13, 613–622 [PubMed] [Google Scholar]
- 58. Chadee D. N., Hendzel M. J., Tylipski C. P., Allis C. D., Bazett-Jones D. P., Wright J. A., and Davie J. R. (1999) Increased Ser-10 phosphorylation of histone H3 in mitogen-stimulated and oncogene-transformed mouse fibroblasts. J. Biol. Chem. 274, 24914–24920 [DOI] [PubMed] [Google Scholar]
- 59. Thomson S., Mahadevan L. C., and Clayton A. L. (1999) MAP kinase-mediated signalling to nucleosomes and immediate-early gene induction. Semin. Cell Dev. Biol. 10, 205–214 [DOI] [PubMed] [Google Scholar]
- 60. Dou Y., Mizzen C. A., Abrams M., Allis C. D., and Gorovsky M. A. (1999) Phosphorylation of linker histone H1 regulates gene expression in vivo by mimicking H1 removal. Mol. Cell 4, 641–647 [DOI] [PubMed] [Google Scholar]
- 61. Lo W. S., Trievel R. C., Rojas J. R., Duggan L., Hsu J. Y., Allis C. D., Marmorstein R., and Berger S. L. (2000) Phosphorylation of serine 10 in histone H3 is functionally linked in vitro and in vivo to Gcn5-mediated acetylation at lysine 14. Mol. Cell 5, 917–926 [DOI] [PubMed] [Google Scholar]
- 62. Sarg B., Helliger W., Talasz H., Förg B., and Lindner H. H. (2006) Histone H1 phosphorylation occurs site-specifically during interphase and mitosis: identification of a novel phosphorylation site on histone H1. J. Biol. Chem. 281, 6573–6580 [DOI] [PubMed] [Google Scholar]
- 63. Zhang Q., Zhong Q., Evans A. G., Levy D., and Zhong S. (2011) Phosphorylation of histone H3 serine 28 modulates RNA polymerase III-dependent transcription. Oncogene 30, 3943–3952 [DOI] [PMC free article] [PubMed] [Google Scholar]
- 64. Zee B. M., Levin R. S., Xu B., LeRoy G., Wingreen N. S., and Garcia B. A. (2010) In vivo residue-specific histone methylation dynamics. J. Biol. Chem. 285, 3341–3350 [DOI] [PMC free article] [PubMed] [Google Scholar]
- 65. Lin S., and Garcia B. A. (2012) Examining histone post-translational modification patterns by high-resolution mass spectrometry. Methods Enzymol. 512, 3–28 [DOI] [PMC free article] [PubMed] [Google Scholar]
- 66. Larsen M. R., Thingholm T. E., Jensen O. N., Roepstorff P., and Jørgensen T. J. (2005) Highly selective enrichment of phosphorylated peptides from peptide mixtures using titanium dioxide microcolumns. Mol. Cell. Proteomics 4, 873–886 [DOI] [PubMed] [Google Scholar]
- 67. Li Q. R., Ning Z. B., Tang J. S., Nie S., and Zeng R. (2009) Effect of peptide-to-TiO2 beads ratio on phosphopeptide enrichment select. J. Proteome Res. 8, 5375–5381 [DOI] [PubMed] [Google Scholar]
- 68. Kettenbach A. N., and Gerber S. A. (2011) Rapid and reproducible single-stage phosphopeptide enrichment of complex peptide mixtures: application to general and phosphotyrosine-specific phosphoproteomics experiments. Anal. Chem. 83, 7635–7644 [DOI] [PMC free article] [PubMed] [Google Scholar]
- 69. Yuan Z.-F., Lin S., Molden R. C., Cao X.-J., Bhanu N. V., Wang X., Sidoli S., Liu S., and Garcia B. A. (2015) EpiProfile quantifies histone peptides with modifications by extracting retention time and intensity in high-resolution mass spectra. Mol. Cell. Proteomics 14, 1696–1707 [DOI] [PMC free article] [PubMed] [Google Scholar]
- 70. Lin S., Wein S., Gonzales-Cope M., Otte G. L., Yuan Z.-F., Afjehi-Sadat L., Maile T., Berger S. L., Rush J., Lill J. R., Arnott D., and Garcia B. A. (2014) Stable isotope labeled histone peptide library for histone post-translational modification and variant quantification by mass spectrometry. Mol. Cell. Proteomics 13, 2450–2466 [DOI] [PMC free article] [PubMed] [Google Scholar]
- 71. Vizcaíno J. A., Csordas A., del-Toro N., Dianes J. A., Griss J., Lavidas I., Mayer G., Perez-Riverol Y., Reisinger F., Ternent T., Xu Q.-W., Wang R., and Hermjakob H. (2016) 2016 update of the PRIDE database and its related tools. Nucleic Acids Res. 44, D447–456 [DOI] [PMC free article] [PubMed] [Google Scholar]
- 72. Bennett B. D., Yuan J., Kimball E. H., and Rabinowitz J. D. (2008) Absolute quantitation of intracellular metabolite concentrations by an isotope ratio-based approach. Nat. Protoc. 3, 1299–1311 [DOI] [PMC free article] [PubMed] [Google Scholar]
Associated Data
This section collects any data citations, data availability statements, or supplementary materials included in this article.