Abstract
Recent work demonstrates that Alport glomerular disease is mediated through a biomechanical strain-sensitive activation of mesangial actin dynamics. This occurs through a Rac1/CDC42 cross-talk mechanism that results in the invasion of the sub-capillary spaces by mesangial filopodia. The filopodia deposit mesangial matrix proteins in the glomerular basement membrane, including laminin 211, which activates focal adhesion kinase in podocytes culminating in the up-regulation of pro-inflammatory cytokines and metalloproteinases. These events drive the progression of glomerulonephritis. Here we test whether endothelial cell-derived endothelin-1 is upregulated in Alport glomeruli, and further elevated by hypertension. Treatment of cultured mesangial cells with endothelin-1 activates the formation of drebrin-positive actin microspikes. These microspikes do not form when cells are treated with the endothelin A receptor antagonist sitaxentan, or under conditions of siRNA knockdown of endothelin A receptor mRNA. Treatment of Alport mice with sitaxentan results in delayed onset of proteinuria, normalized glomerular basement membrane morphology, inhibition of mesangial filopodial invasion of the glomerular capillaries, normalization of glomerular expression of metalloproteinases and pro-inflammatory cytokines, increased lifespan, and prevention of glomerulosclerosis and interstitial fibrosis. Thus endothelin A receptor activation on mesangial cells is a key event in initiation of Alport glomerular disease in this model.
Keywords: Alport syndrome, glomerulonephritis, endothelin, actin dynamics
Introduction
The mature mammalian glomerular basement membrane (GBM) contains two separate networks of type IV collagen; a subendothelial network comprised of α1(IV)/α2(IV) collagen heterotrimers, and a subepithelial network comprised of α3(IV)/α4(IV)/α5(IV) collagen heterotrimers (1). The latter contains more interchain disulfide cross-links, and thus would likely contribute a degree of tension resistance to the GBM (2). In Alport syndrome, mutations in the genes encoding any of the three chains comprising the sub-epithelial network results in the absence of all three chains, owing to the requirement of all three chains for assembly of the heterotrimers (3). The resulting Alport GBM is thinner and the type IV collagen network is comprised of only α1(IV)/α2(IV) networks.
One consequence of a thinned and less crosslinked GBM collagen network is a presumed increase in its elasticity. Consistent with this, we previously showed that salt-induced hypertension resulted in elevated expression of pathologic genes in Alport glomeruli and accelerated progression of the disease (4). More recently we demonstrated that stretch mediated activation of the Rho GTPases Rac1 and CDC42 in Alport mesangial cells induced mesangial filopodial invasion of the glomerular capillary loops (5). The mesangial filopodia deposit laminin 211 in the GBM. This abnormal GBM laminin is known to progressively accumulate in the Alport GBM (6,7), but its cellular origin and its role in glomerular pathology, until recently, remained unknown. In a recent study it was shown that GBM laminin 211 activates focal adhesion kinase (FAK) on podocytes, which results in pathologic gene activation including those encoding matrix metalloproteinases (MMPs) and pro-inflammatory cytokines. Blocking FAK activation ameliorated Alport renal disease progression and improved renal function (8).
Here we show that biomechanical strain induces expression of endothelin-1 in endothelial cells from Alport mouse glomeruli. We further demonstrate that mesangial cells express endothelin A receptors (ETAR), but not endothelin B receptors (ETBR), unlike podocytes, which express predominantly ETBR with low levels of ETAR. Specific blockade of ETAR in Alport mice by sitaxentan significantly delayed the onset of Alport glomerular disease, ameliorated mesangial filopodial invasion of the glomerular capillaries, prevented interstitial fibrosis, and improved renal function. Thus, strain-mediated induction of endothelin-1 activates ETAR on mesangial cells resulting in mesangial filopodial invasion of glomerular capillaries. The filopodia deposit mesangial proteins in the GBM. One of these mesangial proteins, laminin 211, activates expression of pro-inflammatory cytokines and MMPs in glomerular podocytes. Blocking this pathway by way of ETAR blockade has significant therapeutic benefits, and thus this mechanism reveals a new class of therapeutic targets that have the potential to delay the onset and slow the progression of Alport renal disease.
Results
Endothelin-1 is induced in Alport glomerular endothelium and further induced by hypertension
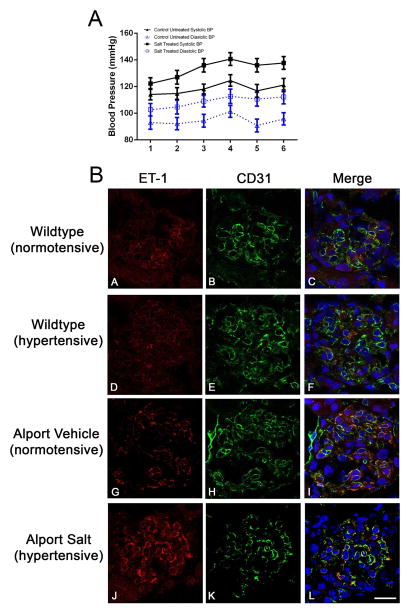
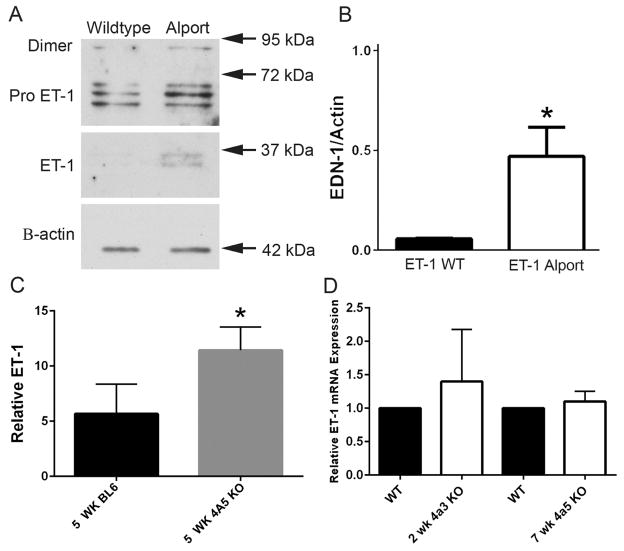
Preproteinuric C57Bl/6 X-linked Alport mice were made hypertensive by providing L-NAME salts in the drinking water from 4 to 7 weeks of age. Blood pressure was monitored twice weekly from 4 to 7 weeks of age using a CODA-2 tail cuff monitoring device. C57Bl/6 X-linked Alport mice were used because the CODA -2 system cannot accommodate measures in 2 week old mice, the age of pre-proteinuric 129 Sv autosomal Alport mice, due to their size. Figure 1A shows that animals given salt were consistently hypertensive relative to animals given water. At 7 weeks of age these animals are still pre-proteinuric (9). Cryosections were immunostained with antibodies specific for either endothelin-1 or CD31 (a marker for endothelial cells). Sections were stained simultaneously with the same antibody dilutions and imaged setting the gain of the confocal microscope using the hypertensive Alport sample immunostained for endothelin-1. Images for all remaining endothelin-1 immunostains were collected using this same gain setting, thus reflecting relative fluorescence to the hypertensive Alport sample. The lower panel of Figure 1B shows that the immunostaining intensity of ET-1 in glomeruli from hypertensive Alport mice is greater than that for normotensive Alport mice, which are greater than that for wild type mice. ET-1 co-localizes with CD31, indicating the cellular source of ET-1 is the endothelium. Western blot analysis shown in Figure 2A–B confirms significantly elevated expression of active ET-1 in Alport glomeruli compared to wild type. Significantly Elevated active endothelin was observed in the urine of 5 week old C57 Bl/6 XLAS mice, a biomarker for chronic kidney disease (10), by microplate ELISA (Figure 2C). Glomerular endothelin mRNA was not significantly elevated in either 129 Sv or the C56Bl/6 Alprot mouse models (Figure 2D).
Figure 1.
1A: Induction of hypertension in Alport mice. C57Bl/6 X-linked Alport mice were made hypertensive by giving them the L-NAME salts in their drinking water from 4 to 7 weeks of age. Normotensive mice were given plain drinking water. Blood pressures were measured longitudinally using the CODA-2 tail cuff system. Numbers on the X-axis represent individual measurements which were performed twice weekly from 4 to 7 weeks of age. Both systolic and diastolic changes comparing normotensive and hypertensive mice were stastically significant (P<0.05). 1B: Hypertension induces endothelin-1 in Alport glomerular endothelial cells. Cryosections were dual immunostained with antibodies specific for either endothelin-1 or CD31 (a marker for endothelial cells). ET-1, endothelin-1. Elevated expression of endothelin-1 is clearly evident in glomeruli from hypertensive mice relative to normotensive mice (Compare G and J). This was not observed in wild type mice (compare A and D). Co-localization of endothelin-1 with CD31 demonstrates this induction is coming from the endothelial cell compartment. Bar=30μm.
Figure 2.
ET-1 protein expression is elevated in glomeruli and urine from Alport mice relative to age/ strain-matched wild type mice. Panel A. Glomeruli were isolated from 2 week old (pre-proteinurc) 129 Sv Alport mice and wild type mice. Lysates were analyzed by western blots and probed with anti-ET-1 antibodies. Panel B. Active ET-1 was quantified on quadruplicate blots by densitometry, demonstrating significantly elevated ET-1 in Alport versus wild type glomeruli. Panel C. Urine from 5 week C57 Bl/6 wild type and X-linked Alport mice was analyzed for active ET-1 using a microplate ELISA assay. Panel D. Glomerular RNA analysis by real time RT-PCR shows that ET-1 mRNA levels are not significantly elevated in either the pre-proteinuric 129 Sv autosomal Alport model or the C57 Bl/6 X-linked Alport model. *P< 0.05
ETAR activation on mesangial cells induce the formation of filopodia
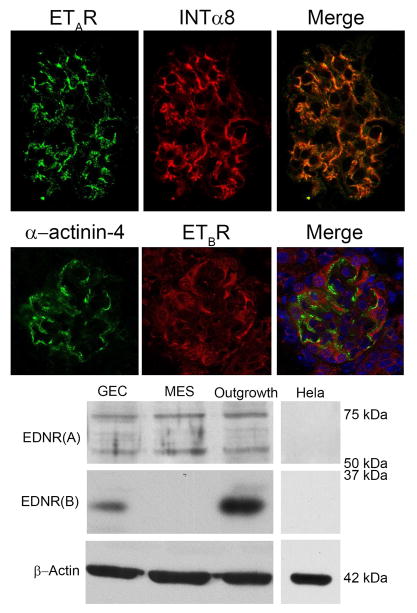
Previous studies in rat have shown that ETARs are expressed on glomerular mesangial cells and podocytes, while ETBRs are on podocytes and endothelial cells (11). We examined the relative expression of ETRs in the 129 Sv mouse. Figure 3 (upper panels) shows that glomerular ETAR immunostaining co-localizes with the mesangial cell marker, integrin α8, consistent with its expression in mesangial cells. In contrast, ETBR immunostaining was observed in podocytes, identified with α-actinin-4. Western blots (Figure 3, lower panel) confirm that only the ETAR is detected in cultured mesangial cells, while both ETAR and ETBR are detected in cultured podocytes (GECs). Glomerular outgrowths were used as a positive control for both receptors.
Figure 3.
Endothelin A receptor is the primary endothelin receptor on mouse mesangial cells. Upper panel: Kidney cryosections from wild type mice were dual stained with antibodies specific for the endothelin A receptor and the mesangial cell marker integrin α8. Staining in a single glomerulus is shown. The merged image shows that the endothelin A receptor staining is primarily in the mesangial cell compartment. Bar=30μm. The lower panel shows that Endothelin B receptors are principally expressed on podocytes, consistent with earlier reports (10). Alpha-actinin-4 is used as a podocyte marker. Panel B. Western blots from cultured mesangial cells (MES) and podocytes (GEC) confirm that ETAR is robustly expressed on mesangial cells, while ETBR is not detected. Cultured podocytes and glomerular outgrowths (cultured for 24 hours after glomerular isolation, used as a positive control for both endothelin receptors) express both ETAR and ETBR. Hela cell extracts were used as a negative control, and expressed neither ETARs or ETBRs.
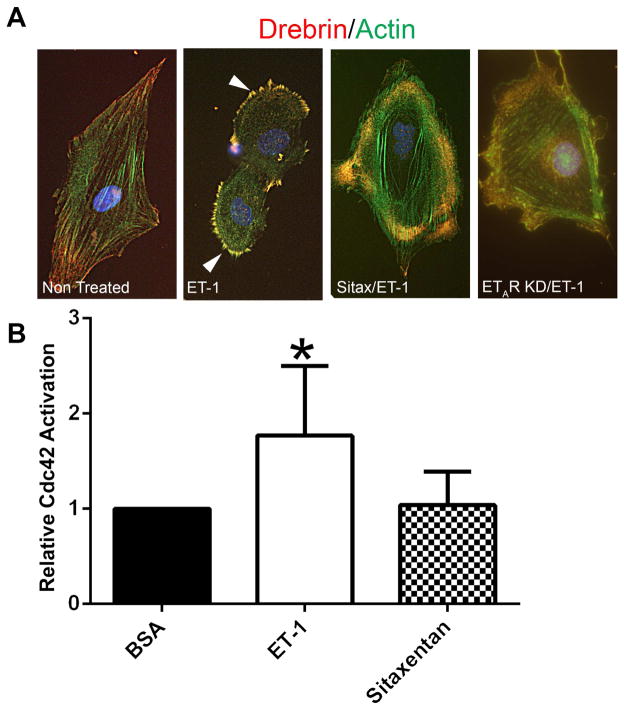
It has been previously shown that endothelin-1 activates CDC42/RAC1 in mesangial cells via ETARs (12,13), and we showed that CDC42/RAC1 crosstalk was linked to the activation of mesangial filopodial invasion of glomerular capillaries (5). A direct link between mesangial cell activation and filopodial formation has not been established. To address this, we pre-treated (or not) serum-starved cultured mesangial cells with sitaxentan and then stimulated the cells with endothelin-1. Cells were then dual labeled with anti-drebrin antibodies (drebrin stabilizes actin filaments in filopodia) and phalloidin. The results in Figure 4A demonstrate that treatment of cultured mesangial cells with endothelin-1 induces the formation of drebrin-positive filopodial microspikes, and pretreatment of cells with the ETAR antagonist Sitaxentan blocks their formation. We further analyzed lysates from cultured mesangial cells using these same conditions for the activation of CDC42 (GTP-CDC42). The results in Figure 4B show that endothelin-1 treatment significantly activates CDC42 in these cells, and that pretreatment with sitaxentan prevents this activation.
Figure 4.
Treatment of mesangial cells with endothelin-1 activates CDC42 and induces the formation of drebrin-positive actin microspikes; microspikes and CDC42 activation are inhibited by pre-treatment of cells with Sitaxentan. Panel A: Cultured mesangial cells were serum starved, pretreated for 1 hour with or without Sitaxentan, treated for 30 minutes with endothelin-1, fixed with acetone, and dual stained with anti-drebrin antibodies (red) and phalloidin (green). Drebrin-positive microspikes (filopodia, denoted by arrowheads) are highly abundant on the endothelin-treated cells, but not detected when the cells are pre-treated with Sitaxentan or in ETAR knockdown cells (control). Bar=12μm. Panel B: Cells were treated the same way as in panel A, then lysates prepared and assayed by ELISA for GTP-CDC42. Endothelin treatment significantly activates CDC42 in the cultured mesangial cells, and its activation is inhibited by pre-treatment of cells with Sitaxentan.
ETAR blockade delays Alport glomerular disease initiation and ameliorates interstitial fibrosis in Alport mice
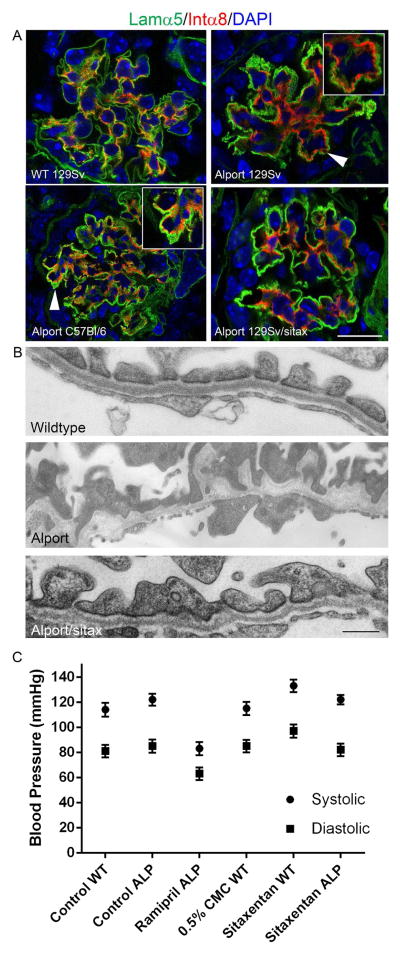
To determine whether ETR antagonism prevents mesangial filopodia formation in vivo, 129 Sv autosomal Alport mice were given sitaxentan once daily by oral gavage from 2 weeks to 7 weeks of age. Kidney cryosections were immunostained using antibodies laminin α5 and integrin α8 to determine the degree of mesangial filopodial invasion in the glomerular capillaries. Transmission electron microscopy was used to determine whether the ETAR antagonist ameliorates GBM damage. The results in Figure 5A (arrowheads/insets) demonstrate that both vehicle-treated 129 Sv autosomal Alport mice (7 weeks of age) and vehicle-treated C57 Bl/6 XLAS mice (15 weeks of age) showed extensive invasion of glomerular capillaries by mesangial filopodia. Sitaxentan-treated mice showed marked reduction of mesangial filopodial invasion of glomerular capillaries, as evidenced by the relative lack of integrin a8 immunopositivity in the glomerular capillary loops. Normalization of GBM ultrastructural morphology was also observed (Figure 5B and C) compared GBM morphology observed in vehicle-treated Alport mice. Lower magnification images of the GBM from which these examples were taken can be viewed in supplementary Figure 1. Sitaxentan treatment did not effect blood pressure (Figure 5C), suggesting its effects on Alport renal disease are ETAR-mediated rather than non-specific.
Figure 5.
Endothelin A receptor blockade prevents mesangial process invasion of glomerular capillaries and ameliorates GBM damage in Alport mice. 129 Sv Alport animals were treated with the endothelin A receptor specific blocking agent Sitaxentan from 2 weeks to 7 weeks of age. Dual staining demonstrates absence of integrin α8 immunostaining in the glomerular capillaries, which are dual stained with anti-laminin α5 antibodies (Panel A). Arrows denote integrin α8 immunopositivity in the capillary loops of the glomeruli from untreated 129 Sv Autosomal Alport mice and C57 Bl/6 X-linked Alport mice, and the relative absence of integrin α8 immunopositivity in the sitaxentan-treated mice. Sitaxentan ameliorates GBM dysmorphology and (Panel B), largely normalizing the irregular thickening and thinning observed for the GBM of 7 week old Alport mice. Bar=500nm. Sitaxentan treatment does not affect blood pressure (Panel C). Wild type and Alport mice were treated with nothing (control), vehicle (CMC), ramipril (positive control for an agent known to effect blood pressure), or sitaxentan for 1 week and blood pressures measured (5 measures per condition) using a tail cuff method (CODA 2). While blood pressure was lower in the ramipril-treated mice, sitaxentan treatment had no effect on blood pressure.
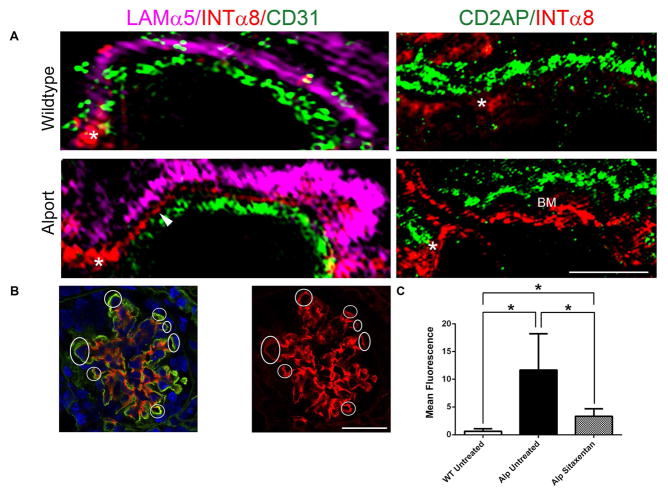
The idea of mesangial filopodial invasion is new to Alport research. To clearly demonstate this, we performed ultra-high resolution structured illumination microscopy (SIM) analysis on 7 week old Alport mouse glomeruli. Figure 6A shows that filopodia (labeled with anti-integrin α8 antibodies) are visible (arrow heads), contiguous with the mesangial angles (asterisks), and exclusive of both the glomerular endothelium (labeled with anti-CD31 antibodies) and the GBM (labeled with anti-laminin α5 antibodies). The mesangial angles lie between the GBM and the endothelium (14). We further show in Figure 6A that the podocyte pedicles (labeled with anti-CD2AP antibodies) do not overlap with the mesangial filopodia, with space between the two markers defining the glomerular basement membrane (GBM). This rules out ectopic activation of integrin α8 by either podocytes or endothelial cells. Figure 6B and C shows quantitative analysis of mesangial filopodial invasion based on total red fluorescence in the capillaries. The graph (Figure 6C-left) shows quantitative analysis of total red fluorescence (integrin α8 immunostaining) in the capillary region from 6 independent glomeruli (from three individual mice) per group. Asignificant elevation in capillary red fluorescence was observed in glomeruli from vehicle-treated Alport mice compared wild type, and normalization of capillary integrin α8 immunostaining in the sitaxentan-treated mice. The images used for this analysis are in Supplementary Figure 2.
Figure 6.
Panel A (left panels) Ultrahigh resolution Structured Illumination Microscopy (SIM) of Alport mouse glomeruli reveals that mesangial filopodia (arrowhead) emanate from the mesangial angles (asterisk), and flow between the glomerular endothelial cells, labeled using anti-CD31 antibodies, and the GBM, labeled using anti-laminin α5 antibodies. These processes are not observed in wild type glomeruli. Panel A (right panels) SIM analysis of dual staining with the podocyte pedicle marker CD2AP and integrin α8 demonstrate non-overlapping staining in the alport capillary loops with a space in between the labeled area where the basemtn membrane (BM) is located. Bar=2.5μm. Panel B. Integrin α8 immunolabeling in the GBM demonstrates extensive filopodial invasion (circled) in 7 week Alport glomeruli that is prevented by treatment of animals with Sitaxentan. Bar=15μm. Panel C. Sitaxentan treatment significantly reduces integrin α8 immunopositivity in the glomerular capillary loops. At least 6 glomeruli from at least 3 independent animals per group were analyzed by quantifying red fluorescence in circumferential capillary loops (denoted in Panel B as circled regions) using NIH image J software. Mesangial angles were excluded.
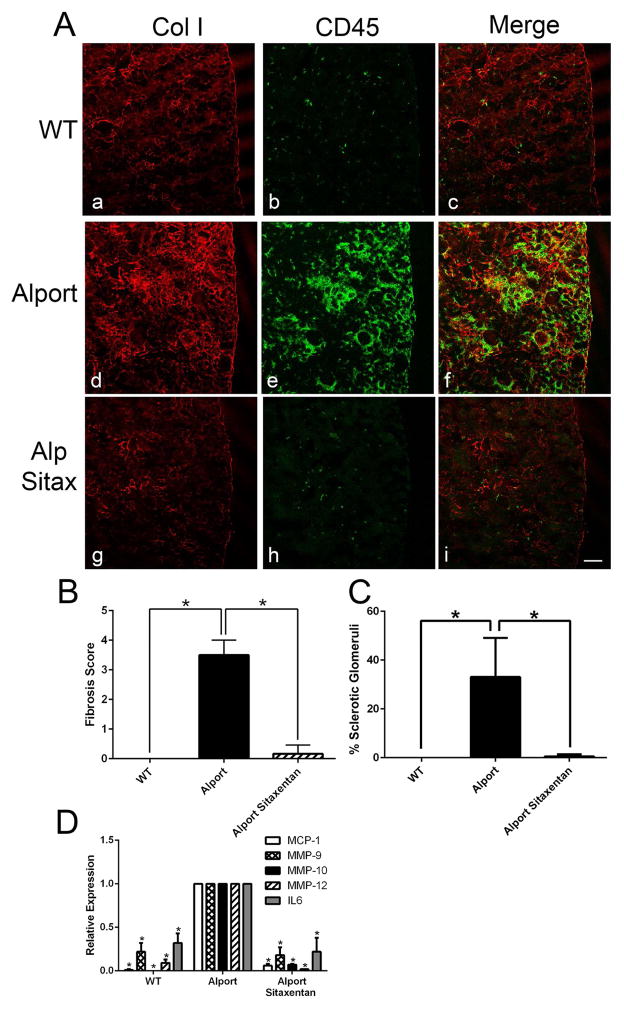
Sitaxentan treatment ameliorated interstitial fibrosis and leukocyte recruitment to the renal interstitium, as evidenced by anti-collagen I (fibrosis marker) and anti-CD45 (pan-leukocyte marker) immunostaining (Figure 7A). Quantitative analysis for both fibrosis scores and % sclerotic glomeruli were reduced to near wild type levels in sitaxentan-treated mice relative to untreated Alport mice (Figure 7B and C). Glomerular expression of MMP-9, -10, and -12 as well as proinflammatory cytokines IL-6 and MCP-1 were significantly reduced in sitaxentan-treated Alport mice relative to Alport mice (Figure 7D) to near wild type levels. Analysis of RNA from renal cortex of these same mice using a mouse fibrosis microarray confirmed amelioration of expression for large number of genes associated with fibrogenesis in sitaxentan-treated Alport mice compared to Alport mice given vehicle (Table 1).
Figure 7.
Panel A Sitaxentan treatment ameliorates interstitial fibrosis and monocytic infiltration in Alport mouse kidneys. Cryosections from Sitaxentan-treated and vehicle treated wild type and Alport mice were immunostained with antibodies specific for collagen I (a marker for fibrosis) and CD45 (a pan-leukocyte marker). Note the complete absence of fibrosis and interstitial leukocytes in the treated mice. Bar=50μM. Panel B. Sitaxentan treatment ameliorates Alport interstitial fibrosis. Fibrosis scores were determined by blinded quantification of the relative cortical area with dense collagen I immunostaining (five anials per group). A score of 1 is 10%; a score of 4 is 40%. Panel C. Sitaxentan treatment ameliorates glomerulosclerosis in Alport mice. Sclerotic glomeruli were counted (blindly) and plotted as percent relatve to the total number of glomeruli (five animals per group). Panel D. Sitaxentan treatment reduces mRNA expression of MMP-9, MMP-10, MMP-12, MCP-1, and IL-6 in glomeruli from Alport mice. Glomerular RNA from Sitaxentan-treated and vehicle-treated mice was analyzed by real time RT-PCR for the indicated transcripts. MMP, matrix metalloproteinase; MCP-1, monocyte chemoattractant protein-1; IL-6, interleukin 6. *P<0.001
Table 1.
Expression profiling of renal cortex mRNA from wild type, Alport, and sitaxentan-treated Alprot mice using a mouse fibrosis microarray.
| Fold Change | ||||
|---|---|---|---|---|
| Alport vs WT | Sitax Alp vs WT | Sitax Alp vs Alp | ||
| Extracellular Matrix and Cell Adhesion | Itgb8 | 0.5 | 1.2 | 2.4 |
| Itgb3 | 4.9 | 1.9 | 0.5 | |
| Itga2 | 6.1 | 3.5 | 0.7 | |
| Col1a2 | 8.6 | 3.0 | 0.4 | |
| Col3a1 | 16.5 | 4.7 | 0.3 | |
| Mmp1a | 0.4 | 0.8 | 1.8 | |
| Plat | 1.8 | 1.9 | 1.1 | |
| Timp2 | 1.9 | 1.7 | 0.9 | |
| Serpinh1 | 1.9 | 1.2 | 0.7 | |
| Lox | 6.2 | 3.8 | 0.7 | |
| Mmp2 | 6.6 | 3.2 | 0.6 | |
| Mmp14 | 6.8 | 2.4 | 0.5 | |
| Mmp9 | 10.5 | 3.2 | 0.4 | |
| Mmp3 | 10.6 | 2.4 | 0.3 | |
| Serpine1 | 23.7 | 10.7 | 0.6 | |
| Timp1 | 525.4 | 113.1 | 0.3 | |
| Growth Factors | Egf | 0.2 | 1.0 | 5.9 |
| Vegfa | 0.6 | 1.2 | 1.8 | |
| Pdgfa | 1.7 | 1.4 | 0.8 | |
| Pdgfb | 2.3 | 1.1 | 0.6 | |
| Hgf | 4.3 | 3.4 | 0.8 | |
| Inflammatory | II1b | 9.0 | 2.5 | 0.4 |
| Tnf | 18.6 | 4.7 | 0.4 | |
| Ccr2 | 19.5 | 4.4 | 0.2 | |
| Pro-Fibrotic | Ctgf | 1.8 | 3.3 | 1.9 |
| Snai1 | 2.2 | 1.7 | 0.8 | |
| Grem1 | 10.0 | 4.2 | 0.5 | |
| Ccl3 | 10.4 | 3.6 | 0.3 | |
| Ccl11 | 11.3 | 3.8 | 0.3 | |
| Ccl12 | 104.4 | 19.6 | 0.2 | |
| TGFβ Superfamily | Bmp7 | 0.4 | 0.9 | 2.5 |
| Tgfbr2 | 1.6 | 1.2 | 0.8 | |
| Tgfbr1 | 1.7 | 1.6 | 0.9 | |
| Cebpb | 1.8 | 1.9 | 1.0 | |
| Nfkb1 | 1.9 | 1.5 | 0.8 | |
| Tgif1 | 2.2 | 1.5 | 0.8 | |
| Dcn | 2.6 | 3.7 | 1.4 | |
| Tgfb3 | 3.0 | 1.6 | 0.6 | |
| Tgfb1 | 3.3 | 1.6 | 0.6 | |
| Myc | 3.4 | 2.1 | 0.7 | |
| Thbs2 | 6.7 | 2.3 | 0.4 | |
| Apoptosis | Fasl | 16.7 | 3.4 | 0.2 |
 = 2-Tailed t-test (p<0.05)
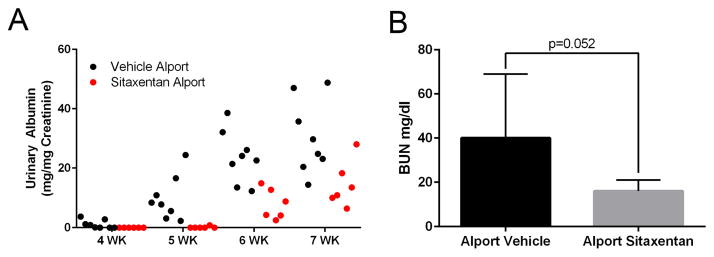
Sitaxentan-treated mice showed delayed onset of proteinuria, as well as significantly reduced proteinuria after the onset (Figure 8A), which is normally detected by 3 weeks of age in the 129 Sv autosomal Alport mouse model (6). This is consistent with the idea that ETAR blockade delays disease initiation. Furthermore, BUN levels were reduced in sitaxentan-treated Alport mice relative to vehicle treated Alport mice (8B). Surprisingly, lifespan was increased only by approximately 20% (data anot shown). This nominal improvement likely reflects the sitaxentan toxicity, as this class of compounds is notoriously toxic.
Figure 8.
Sitaxentan treatment of Alport mice significantly delays the onset and progression of proteinuria, and reduces serum BUN levels. Urine was collected at the indicated timepoints and analyzed for albumin using an ELISA kit. Albumin measures were normalized to urinary creatinine. Note that measurable albumin in the Sitaxentan-treated mice was not detected until 6 weeks of age. Consistent with a delayed onset of glomerular disease. Bun measures were performed on serum from 7 week old vehicle or sitaxentan-treated Alport mice. *P<0.05
Discussion
In an earlier report we showed that hypertension accelerated the progression of Alport glomerular disease, suggesting a key role for biomechanical strain in the disease mechanism (4). This observation was extended with the discovery that mesangial processes invade the glomerular capillaries in a biomechanical strain-mediated Rac1/CDC42-activation mechanism (5). Importantly, the mesangial filopodia in the GBM are depositing mesangial matrix proteins, including laminin 211, which activates focal adhesion kinase in glomerular podocytes, resulting in the activation of genes encoding pro-inflammatory cytokines and metalloproteinases through an NF-kappaB-dependent signaling pathway, which drive the progression of GBM damage (8). The link between NF-kappaB activation in podocytes and the progression of Alport glomerular disease in the autosomal mouse model was recently strengthened by the observation that deletion of p53 in podocytes accelerated the progression of the disease by limiting podocyte expression of pro-inflammatory cytokines (15). The tumor suppressor p53 is a well-established negative regulator of NF-kappaB (16).
We surmised the mechanism underlying the activation of mesangial filopodia might reveal novel targets of therapeutic intervention aiming to arrest the initiation of these events. Here we show that induction of ET-1 expression in glomerular endothelial cells activates ETARs on mesangial cells culminating in CDC42 activation and the invasion of the sub-endothelial spaces of the glomerular capillaries by mesangial filopodia. These events constitute the earliest pathologic events yet identified, occurring before the onset of proteinuria (8, and data presented herein). In vitro, formation of drebrin-positive actin microspikes in cultured primary mesangial cells in response to ET-1 stimulation demonstrates that the pathway is intact and active. In vivo, ultra-high resolution structured illumination microscopy proves that integrin α8 immunopositivity is in between, and not overlapping with the GBM and the endothelium, and contiguous with the mesangial angles, providing strong evidence that these filopodial projections do indeed originate from the mesangial cells. Proteinuria has been shown as causative of interstitial fibrosis in the kidney (17), and thus might be partially responsible for the reduction in interstitial fibrosis in sitaxentan-treated Alport mice.
It is likely that that multiple factors contribute to Alport glomerular disease initiation. Altered type IV collagen composition of the GBM might influence cell signaling. Ultra high resolution immunolocalization studies showed that the α3(IV)/α4(IV)/α5 network in wild type mice may not engage podocyte receptors. In Alport mice, however, the α1(IV)/α2(IV) network is proximate enough to bind to collagen receptors on podocyte foot processes (18). The collagen-binding discoidin domain receptor 1 is present on the podocyte pedicles, and could bind the α1(IV)/α2(IV) network resulting in receptor activation (19). Deletion of DDR1 in Alport mice resulted in improved renal function and a 50% increase in lifespan, supporting this notion (19).
Biomechanical stretching of glomerular podocytes activates angiotensin II receptors and increases expression of secreted protein acidic and rich in cysteine (SPARC) (20,21). The former is associated with apoptosis, and the latter is associated with accelerated renal injury in diabetic mice. Thus, biomechanical stretching of podocytes has been shown to have some direct maladaptive effects on podocyte biology, and thus could contribute to Alport glomerular disease.
ET-1 is secreted by podocytes in adriamycin-induced glomerulosclerosis, a model for focal segmental glomerular sclerosis, where it binds to ETARs on glomerular endothelial cells, activating mitochondrial-targeted reactive oxygen species leading to podocyte loss (22). The fact that this mechanism is so different from the one described here demonstrates the diversity of ET-1 mediated influences on glomerular cells. This work suggests that release of endothelin-1 by endothelial cells in our model might promote similar pathology. Thus, the inflences of ETAR blockade on Alport glomerular pathology might involve direct contributions of all three glomerular cell types.
Biomechanical stretching may not be the only factor contributing to elevated expression of endothelin-1 in Alport glomerular endothelium. TGF-β1 and TNF-α are induced in glomerular podocytes of Alport mice (23,24). Both cytokines have been shown to up-regulate expression of endothelin-1 in other systems (25,26). Sustained induction of endothelin-1 might be dominated early by a strain-dependent mechanism, and laterby a cytokine-dependent mechanism.
In summary, this work confirms that ET-1 mediated activation of ETAR on glomerular mesangial cells activates CDC42-dependent filopodial invasion of glomerular capillaries in Alport mice. These filopodia are the likely source of laminin 211, as well as other mesangial matrix proteins known to accumulate in the GBM of Alport humans, dogs and mice (6,7), and shown to underlie the FAK-dependent activation of NF-KappaB, which induces expression of pro-inflammatory cytokines and MMPs in podocytes (8). These events underlie Alport glomerular disease initiation, and reveal new therapeutic targets. Sitaxentan treatment increased lifespan approximately 20%, which is disappointing given the degree of renal protection observed. This nominal improvement might reflect the toxicity of Sitaxentan, and suggests additional work needs to be done, perhaps using genetic modeling, to determine the full extent of renoprotection that might be achieved by inactivating this pathway.
Identification of elevated ET-1 levels in the urine of pre-proteinuric Alport mice suggests that ET-1 may be an early biomarker for Alport renal disease as it has proven to be for other models of CKD (10). The development of early biomarkers is currently a priority in the Alport field, as it may provide a sensitive means of monitoring response of emergent therapies (27). It would thus be useful to determine whether urinary ET-1 levels are elevated in pre-proteinuric Alport patients.
Methods
Mice
129 Sv autosomal Alport mice were developed here (28). C57 Bl/6 X-linked Alport mice were developed by Rheault et al.(29) and were obtained from the Jackson Laboratories. All mice were on pure genetic backgrounds and maintained as in house colonies. All procedures involving animals were conducted in accordance of an approved IACUC protocol. Every effort was made to minimize usage as well as minimize any pain or distress.
Antibodies
Anti-α-actinin 4 was from Santa Cruz Biotechnology, Inc (Dallas, TX, USA, Cat #: SC-49333); anti-CD31 was from Thermo Fisher Scientific, Inc (Rockford, IL, USA, Cat #: MA1-40074); Anti-collagen 1 was from CedarLane (Cat# CL50151AP) at 1:200 and CD45 was from eBioscience (Cat# 14-0451) at 1:100. anti-Endothelin-1 was from Abbiotec (San Diego, CA, USA, Cat #: 250633) and Pierce (Lifetechnologies, Cat# PA3.067); anti-Endothelin Receptor A was from Novus Biologicals (Littleton, CO, USA, Cat #: NB600-836); anti-Endothelin Receptor B was from EMD Millipore (Billerica, MA, USA, Cat #: AB3284); anti-Integrin α8 was from R&D Systems, Inc (Minneapolis, MN, USA, Cat #: AF4076); anti- Laminin α2 was from Sigma-Aldrich (St. Louis, MO, USA, Cat #: L-0663); anti-Laminin α5 was a gift from Dr. Jeff Miner (Washington University, St. Louis, MO).
Immunofluorescence microscopy
Fresh frozen kidneys were sectioned at 8-μm and acetone fixed. Sections were incubated overnight at 4°C in the appropriate primary antibody solutions. The dual stains of rat anti-CD31 antibody at 1:50 and rabbit anti-Endothelin-1 antibody at 1:300. Dual stain of goat anti- α Actinin 4 antibody at 1:100 and rabbit anti-Endothelin Receptor B antibody at 1:100 were diluted in 1 % BSA in 0.3% PBST (Triton X-100). Anti-Collagen 1 was used at 1:200 and anti-CD45 was used at 1:100. The dual stains of anti-Endothelin Receptor A at 1:100, goat anti-Integrin α8 at 1:1000, rat anti-Laminin α2 at 1:200, and rabbit anti-Laminin α5 at 1:2000 were diluted in 0.3% PBST + 5% FBS. Triple stain of rat anti-CD31 at 1:50, goat anti-Integrin α8 at 1:1000, and rabbit anti-Laminin α5 at 1:2000 were diluted in 0.3% PBST + 5% FBS. Secondary antibodies were at 1:500 for 1 hour at room temperature.
Mean fluorescence analysis
Images were analyzed using ImageJ. Each capillary loop was measured for area, integrated density and mean gray value. Three regions next to the capillary loop were measured for background values. The corrected total fluorescence was calculated by taking the integrated density subtracted by the area multiplied by the mean fluorescence of the background measurements.
Confocal Microscopy
Confocal images captured using a Leica TCS SP8 MP confocal imaging system, using a 63x NA: 1.4 oil or 10x NA: 0.3 objective.
Structured Illumination Microscopy
SIM images were captured using a Zeiss ELYRA PS.1 Super-resolution microscope.
Real Time qRT-PCR
Real time qRT-PCR was performed as described previously (5). Samples were normalized to Mouse GAPDH Endogenous Control VIC® Probe (Applied Biosystems catolog #: 4352339E) which was run alongside IL-6 (Catalog # 4331182, ID# Mm00446190_m1), MCP-1 (Catalog # 4331182, ID# Mm00441242_m1), MMP-9 (Catalog # 4331182, ID# Mm00442991_m1), MMP-10 (Catalog # 4331182, ID# Mm00444630_m1), and MMP-12 (Catalog # 4331182, ID# Mm00500554_m1) TaqMan® Gene Expression Assay Probes (Applied Biosystems).
Sclerotic glomeruli analysis
Paraffin tissue sections were stained with Periodic acid-Schiff (PAS). Percentage of sclerotic glomeruli were recorded for each section blinded.
Fibrosis scoring
Slides stained with anti-collagen 1 and anti-CD45 (pan leukocyte) antibodies were scored blinded based on the approximate percentage of the total area of the renal cortex that was inundated with collagen 1 and leukocytes. A score of 1 represents 10% fibrosis.
Albuminuria and Blood Urea Nitrogen (BUN) measures
Urine Albumin measurements were determined by using Molecular Innovation’s (Novi, MI) Mouse Albumin Antigen Assay (cat. # MSAKT) and normalized using BioAssay Systems (Hayward, CA) QuantiChrom Creatinine Assay Kit (DICT-500). BUN measures were performed using a Cobas Integra 400 plus analyzer (Roche) in accordance with the manufacturer’s instructions.
ET-1 Elisa
75 μL of urine was assayed using a Quantikine©Elisa (R&D Systems, Minneapolis, MN) for active Endothelin-1 as per manufacturer’s recommendations and normalized to creatinine (above).
Primary Mesangial Cells (MES) were derived and characterized as previously described (30). For Cdc42 G-Lisa® Activation Assay (Cytoskeleton, Denver, CO.) 30 % confluent MES cultures were incubated with 1% FCS-containing media for 24 hours, followed by 0.05% BSA containing media overnight. 10 μM Sitaxentan was added to cultures for one hour, followed by 250 nM Endothelin-1 (ET-1) (Syd Labs, Boston, MA.) for 5 minutes. Lysates were collected and assayed as per manufacturer’s instructions. For ET-1 induction of Filopodial formation, MES were cultured and serum deprived as above, exposed to 10 μM Sitaxentan for one hour, followed by 250 nM EDN-1 for 30 minutes. Slides were fixed in −20° acetone, perfused with 0.1% Triton/PBS and stained with 1:250 dilution of antibody specific for Drebrin (Gene Tex, Irvine CA) and phalloidin (Molecular Probes, Grand Island, NY).
Conditional Immortalized Glomerular Epithelial Cells (GEC’s), previously derived and characterized (31), were grown under permissive conditions (10 % FCS, 10 U/ml -interferon at 33°C).
Western Blot(s) for EDNr (A), (B), ET-1 and β-Actin were performed on protein lysates from glomeruli, GEC’s, MES, and outgrowths. 10 μg samples were denatured/reduced with the addition of 6X SDS loading buffer containing fresh β-mercapoethanol at 65° for at least two hours. 10% SDS PAGE gels were run as described (31). A 1:2000 dilution of primary antibodies (for ET-1, 1:500) were incubated in 5 % non-fat dry milk in PBST (0.1 % Triton), overnight at 4°. For EDNr (A) a 1:10,000 dilution of Donkey anti- Sheep IgG Antibody [HRP] (NB7190 NOVUS) was incubated for 2 hours in 5% milk/PBST and then developed using ECL (32109 Pierce, Grand Island, NY). For EDNr (B) a 1:5000 dilution of Goat anti-Rabbit IgG Antibody [HRP] (057K4857 Sigma) was incubated for 2 hours in 1% BSA/PBST and then developed using ECL 2 (80196 Pierce). For β-Actin a 1:10,000 dilution of Goat anti-Mouse IgG Antibody [HRP] (025K6105 Sigma) was used.
Glomerular isolation
Glomeruli were isolated by transcardiac perfusion of 4 uM Dynabeads (Life Technologies) and glomeruli isolated using a magnet as described by Takemoto et al., (32).
Blood pressure monitoring
Blood pressures were measured using th CODA2 tail cuff system as previously described (4).
Microarray
Total RNA was isolated from renal cortex (n=5 per group) from wild type and Alport mice given 10 mg/kg sitaxentan or vehicle from 2 to 7 weeks of age. RNA was analyzed by real time RT-PCR using the Mouse Fibrosis PCR Array (Qiagen) according to the manufacturer’s instructions.
Statistical analysis
Real time qRT-PCR data was analyzed using the one sample Student’s t-test (controls were always set arbitrarily equal to 1). Mean fluorescence and % sclerotic glomeruli data were analyzed by two-tailed Student’s t-test.
Supplementary Material
Supplemental Figure 1. Lower magnification images of electron micrographs used to produce Figure 5B. Bar= 1.25 μm.
Supplemental Figure 2. Images analyzed using Image J software to quantify GBM fluorescence for integrin α8 shown graphically in Figure 6C.
Acknowledgments
We are grateful Skip Kennedy for help in figure preparation. Confocal microscopy was conducted at the Integrated Biomedical Imaging Facility, Creighton University, Omaha, NE (GM103427, GM110768, GM103427 of the NIGMS of NIH, and the Creighton University School of Medicine). Structured illumination microscopy was conducted at the Advanced Microscopy Core Facility, UNMC, Omaha, NE. Support for the UNMC Advanced Microscopy Core Facility was provided by the Nebraska Research Initiative, the Fred and Pamela Buffett Cancer Center Support Grant (P30CA036727), and an Institutional Development Award (IDeA) from the NIGMS of the NIH (P30GM10639). Transmission electron microscopy was conducted at the Microscopy and Digital Imaging Core of the Research Center for Auditory and Vestibular Studies at Washington University (P30 DC004665). This work was supported by NIH R01 DK055000 to DC. And R01-DC006442 to MAG.
Footnotes
Disclosure Statement: This work was done as a collaboration between the Cosgrove Laboratory and Shiguang Liu’s laboratory at Genzyme. Genzyme performed microarray analysis, analyzed serum samples for blood urea nitrogen levels, duplicated lifespan and physiologic measures (proteinuria and BUN) to independently verify our findings, and participated in the writing and review of the manuscript. There were no direct financial contributions to the Cosgrove laboratory (sponsored research support, licensing agreements or royalties).
Publisher's Disclaimer: This is a PDF file of an unedited manuscript that has been accepted for publication. As a service to our customers we are providing this early version of the manuscript. The manuscript will undergo copyediting, typesetting, and review of the resulting proof before it is published in its final citable form. Please note that during the production process errors may be discovered which could affect the content, and all legal disclaimers that apply to the journal pertain.
Literature cited
- 1.Kleppel MM, Fan W, Cheong HI, et al. Evidence for separate networks of classical and novel basement membrane collagen. Characterization of alpha 3(IV)-Alport antigen heterodimer. J Biol Chem. 1992;267:4137–4142. [PubMed] [Google Scholar]
- 2.Gunwar S, Ballester F, Noelken ME, et al. Glomerular basement membrane. J Biol Chem. 1998;273:8767–8775. doi: 10.1074/jbc.273.15.8767. [DOI] [PubMed] [Google Scholar]
- 3.LeBleu V, Sund M, Sugimoto H, et al. Identification of the NC1 domain of α3 chain as critical for α3α4α5 type IV collagen network assembly. J Biol Chem. 2010 Dec 31;285(53):41874–41885. doi: 10.1074/jbc.M110.149534. [DOI] [PMC free article] [PubMed] [Google Scholar]
- 4.Meehan DT, Delimont D, Cheung L, et al. Biomechanical strain causes maladaptive gene regulation, contributing to Alport glomerular disease. Kidney Int. 2009;76:968–976. doi: 10.1038/ki.2009.324. [DOI] [PMC free article] [PubMed] [Google Scholar]
- 5.Zallocchi M, Johnson B, Meehan DT, et al. α1β1 integrin/Rac1-dependent mesangial invasion of glomerular capillaries in Alport syndrome. Am J Pathol. 2013;183:1269–1280. doi: 10.1016/j.ajpath.2013.06.015. [DOI] [PMC free article] [PubMed] [Google Scholar]
- 6.Cosgrove D, Rodgers K, Meehan D, et al. Integrin α1β1 and transforming growth factor-β1 play distinct roles in Alport glomerular pathogenesis and serve as dual targets for metabolic therapy. Am J Pathol. 2000;157:1649–1659. doi: 10.1016/s0002-9440(10)64802-x. [DOI] [PMC free article] [PubMed] [Google Scholar]
- 7.Kashtan CE, Kim Y, Lees GE, et al. Abnormal glomerular basement membrane laminins in murine, canine, and human Alport syndrome: Aberrant laminin α2 deposition is species independent. J Am Soc Nephrol. 2001;12:252–260. doi: 10.1681/ASN.V122252. [DOI] [PubMed] [Google Scholar]
- 8.Delimont D, Dufek BM, Meehan DT, et al. Laminin alpha2-mediated focal adhesion kinase activation triggers Alport glomerular pathogenesis. PloS One. 2014;9(6):e99083. doi: 10.1371/journal.pone.0099083. [DOI] [PMC free article] [PubMed] [Google Scholar]
- 9.Gross O, Beirowski B, Koepke ML, et al. Preemptive ramipril therapy delays renal failure and reduces renal fibrosis in COL4A3-knockout mice with Alport syndrome. Kidney Int. 2003;63:438–446. doi: 10.1046/j.1523-1755.2003.00779.x. [DOI] [PubMed] [Google Scholar]
- 10.Grenda R, Wuhl E, Litwin M, et al. urinary excretion of endothelin-1 (ET-1), transforming growth factor beta1 (TGF-beta1) and vascular endothelial growth factor (VEGF165) in paedeatric chronic kidney diseases: results from ESCAPE trial. Nephrol Dial Transplant. 2007;22:3487–3494. doi: 10.1093/ndt/gfm300. [DOI] [PubMed] [Google Scholar]
- 11.Wendel M, Knels L, Kummer W, et al. Distribution of endothelin receptor subtypes ETA and ETB in the rat kidney. J Histochem Cytochem. 2006;54:1193–1203. doi: 10.1369/jhc.5A6888.2006. [DOI] [PubMed] [Google Scholar]
- 12.Chahdi A, Sorokin A. Endothelin 1 stimulates beta1 Pix-dependent activation of Cdc42 through the G(salpha) pathway. Exp Biol Med. 2006;231:761–765. [PubMed] [Google Scholar]
- 13.Chahdi A, Miller B, Sorokin A. Endothelin 1 induces beta 1Pix translocation and Cdc42 activation via protein kinase A-dependent pathway. J Biol Chem. 2005;280:578–584. doi: 10.1074/jbc.M411130200. [DOI] [PubMed] [Google Scholar]
- 14.Sakai T, Kriz W. The structural relationship between mesangial cells and basement membrane of the renal glomerulus. Anat Embryol (Berl) 1987;176:373–386. doi: 10.1007/BF00310191. [DOI] [PubMed] [Google Scholar]
- 15.Fukuda R, Suico MA, Kai Y, et al. Podocyte p53 limits the severity of experimental Alport syndrome. J Am Soc Nephrol. 2015 May 12; doi: 10.1681/ASN.2014111109. Epub ahead of print. [DOI] [PMC free article] [PubMed] [Google Scholar]
- 16.Webster GA, Perkins ND. Transcriptional cross talk between NF-kappaB and p53. Mol Cell Biol. 1999 May;19(5):3485–3495. doi: 10.1128/mcb.19.5.3485. [DOI] [PMC free article] [PubMed] [Google Scholar]
- 17.Eddy AA. Proteinuria and interstitial injury. Nephrol Dial Transplant. 2004 Feb;19(2):277–281. doi: 10.1093/ndt/gfg533. [DOI] [PubMed] [Google Scholar]
- 18.Suleiman H, Zhang L, Roth R, et al. Nanoscale protein architecture of the kidney glomerular basement membrane. Elife. 2013 Oct 8;:e01149. doi: 10.7554/eLife.01149. [DOI] [PMC free article] [PubMed] [Google Scholar]
- 19.Gross O, Girgert R, Beirowski B, et al. Loss of collagen-receptor DDR1 delays renal fibrosis in hereditary type IV collagen disease. Matrix Biol. 2010 Jun;29(5):346–356. doi: 10.1016/j.matbio.2010.03.002. Epub 2010 Mar 20. [DOI] [PubMed] [Google Scholar]
- 20.Durvasula RV, Shankland SJ. Mechanical strain increases SPARC levels in podocytes: implications for glomerulosclerosis. Am J Physiol Renal Physiol. 2005;289:F577–F584. doi: 10.1152/ajprenal.00393.2004. [DOI] [PubMed] [Google Scholar]
- 21.Durvasula RV, Petermann AT, Hiromura K, et al. Activation of a local tissue angiotensin system in podocytes by mechanical strain. Kidney Int. 2004;65:30–39. doi: 10.1111/j.1523-1755.2004.00362.x. [DOI] [PubMed] [Google Scholar]
- 22.Daehn I, Casalena G, Zhang T, et al. Endothelial mitochondrial oxidative stress determines podocyte depletion in segmental glomerulosclerosis. J Clin Invest. 2014;124:1608–1621. doi: 10.1172/JCI71195. [DOI] [PMC free article] [PubMed] [Google Scholar]
- 23.Sayers R, Kalluri R, Rodgers KD, et al. Role for transforming growth factor-beta1 in Alport renal disease progression. Kidney Int. 1999;56:1662–1673. doi: 10.1046/j.1523-1755.1999.00744.x. [DOI] [PubMed] [Google Scholar]
- 24.Ryu M, Mulay SR, Miosge N, et al. Tumour necrosis factor-α drives Alport glomerulosclerosis in mice by promoting podocyte apoptosis. J Pathol. 2012 Jan;226(1):120–131. doi: 10.1002/path.2979. Epub 2011 Sep 26. [DOI] [PubMed] [Google Scholar]
- 25.Rodriguez-Pascual F, Reimunde FM, Redondo-Horcajo M, et al. Transforming growth factor-beta induces endothelin-1 expression through activation of the Smad signaling pathway. J Cardiovasc Pharmacol. 2004 Nov;44(Suppl 1):S39–S42. doi: 10.1097/01.fjc.0000166216.27544.22. [DOI] [PubMed] [Google Scholar]
- 26.Marsden PA, Brenner BM. Transcriptional regulation of the endothelin-1 gene by TNF-alpha. Am J Physiol. 1992 Apr;262(4 Pt 1):C854–861. doi: 10.1152/ajpcell.1992.262.4.C854. [DOI] [PubMed] [Google Scholar]
- 27.Pohl M, Danz K, Gross O, et al. Diagnosis of Alport syndrome-search for proteomic biomarkers in body fluids. Pediatric nephrol. 2013;28:2117–2123. doi: 10.1007/s00467-013-2533-5. [DOI] [PubMed] [Google Scholar]
- 28.Cosgrove D, Meehan DT, Grunkemeyer JA, et al. Collagen 4A3 knockout: A mouse model for autosomal Alport syndrome. Genes and Development. 1996;10:2981–2992. doi: 10.1101/gad.10.23.2981. [DOI] [PubMed] [Google Scholar]
- 29.Rheault MN, Kren SM, Thielen BK, et al. Mouse model of X-linked Alport syndrome. J Am Soc Nephrol. 2004;15:1466–1474. doi: 10.1097/01.asn.0000130562.90255.8f. [DOI] [PubMed] [Google Scholar]
- 30.Cosgrove D, Meehan DT, Delimont D, et al. Integrin alpha1beta1 regulates matrix metalloproteinases via p38 mitogen-activated protein kinase in mesangial cells: implications for Alport syndrome. Am J Pathol. 2008;172:761–773. doi: 10.2353/ajpath.2008.070473. [DOI] [PMC free article] [PubMed] [Google Scholar]
- 31.Rao VH, Meehan D, Delimont D, et al. Role for MMP-12 in GBM damage associated with Alport syndrome. Am J Pathol. 2006;169:32–46. doi: 10.2353/ajpath.2006.050896. [DOI] [PMC free article] [PubMed] [Google Scholar]
- 32.Takemoto M, Asker N, Gerhardt H, et al. A new method for large scale isolation of kidney glomeruli from mice. Am J Pathol. 2002 Sep;161(3):799–805. doi: 10.1016/S0002-9440(10)64239-3. [DOI] [PMC free article] [PubMed] [Google Scholar]
Associated Data
This section collects any data citations, data availability statements, or supplementary materials included in this article.
Supplementary Materials
Supplemental Figure 1. Lower magnification images of electron micrographs used to produce Figure 5B. Bar= 1.25 μm.
Supplemental Figure 2. Images analyzed using Image J software to quantify GBM fluorescence for integrin α8 shown graphically in Figure 6C.


