

Abstract
BACKGROUND AND PURPOSE:
Perfusion imaging in the angiography suite may provide a way to reduce time from stroke onset to endovascular revascularization of patients with large-vessel occlusion. Our purpose was to compare conebeam CT perfusion with multidetector CT perfusion.
MATERIALS AND METHODS:
Data from 7 subjects with both multidetector CT perfusion and conebeam CT perfusion were retrospectively processed and analyzed. Two algorithms were used to enhance temporal resolution and temporal sampling density and reduce the noise of conebeam CT data before generating perfusion maps. Two readers performed qualitative image-quality evaluation on maps by using a 5-point scale. ROIs indicating CBF/CBV abnormalities were drawn. Quantitative analyses were performed by using the Sørensen-Dice coefficients to quantify the similarity of abnormalities. A noninferiority hypothesis was tested to compare conebeam CT perfusion against multidetector CT perfusion.
RESULTS:
Average image-quality scores for multidetector CT perfusion and conebeam CT perfusion images were 2.4 and 2.3, respectively. The average confidence score in diagnosis was 1.4 for both multidetector CT and conebeam CT; the average confidence scores for the presence of a CBV/CBF mismatch were 1.7 (κ = 0.50) and 1.5 (κ = 0.64). For multidetector CT perfusion and conebeam CT perfusion maps, the average scores of confidence in making treatment decisions were 1.4 (κ = 0.79) and 1.3 (κ = 0.90). The area under the visual grading characteristic for the above 4 qualitative quality scores showed an average area under visual grading characteristic of 0.50, with 95% confidence level cover centered at the mean for both readers. The Sørensen–Dice coefficient for CBF maps was 0.81, and for CBV maps, 0.55.
CONCLUSIONS:
After postprocessing methods were applied to enhance image quality for conebeam CT perfusion maps, the conebeam CT perfusion maps were not inferior to those generated from multidetector CT perfusion.
Recent results from several clinical trials1–5 provide compelling evidence that in patients with an acute ischemic stroke due to an anterior circulation large-artery occlusion, revascularization improved functional outcomes and reduced mortality, compared with conventional therapy. The following additional insights were provided by these trials: 1) the critical interplay between the elapsed time from stroke onset to revascularization and functional outcome, and 2) the potential value of multidetector CT perfusion (MDCTP) in patient selection for endovascular treatment. Other studies further document and emphasize the link between outcomes and the elapsed time between stroke onset and revascularization.1,2,6–8 Because “time is brain,” our study aimed at comparing the diagnostic utility of dynamic perfusion maps obtained with conebeam CT (CBCT) with ones obtained by using multidetector CT (MDCT). We were motivated to do this because if the CBCT measurements are similar to those obtained by using MDCT, the ability to obtain perfusion measurements in the angiography suite would largely eliminate the delays currently associated with multitechnique imaging protocols.9–11
While the feasibility of acquiring dynamic conebeam CT perfusion maps has been demonstrated both in animals and humans, the poor temporal resolution (4–6 seconds) and poor sampling density (7–10 data points) available with current C-arm angiographic systems still presents significant challenges in acquiring data that are comparable with those obtained with MDCTP.11,12 In this study, dynamic perfusion data obtained by using a commercial flat panel detector angiographic system (Axiom Artis zee; Siemens, Erlangen, Germany) were processed by using previously reported novel algorithms which, by reducing noise and also enhancing temporal resolution and temporal sampling, very significantly reduce these limitations.13–15 Dynamic CBCT perfusion maps postprocessed by using these algorithms were compared with dynamic perfusion maps from the same subject's conventional MDCTP study.
Materials and Methods
Patient Selection
From a group of 17 consecutive patients with acute ischemic stroke who were examined with both C-arm conebeam CT perfusion (CBCTP) and MDCTP or MR perfusion imaging, 7 had both CBCTP and MDCTP before endovascular treatment. Data from these 7 were used for this study. All studies were performed under an approved ethics committee protocol.
Among the 7 cases, 1 was spontaneous thrombus lysis before revascularization therapy. In this instance, the CBCT perfusion maps showed very little abnormality compared with the earlier MDCTP maps. In another case, there was significant truncation in the acquired data, which resulted in a truncated arterial input function. These 2 cases were excluded from quantitative image-quality analysis. Further details of the 2 cases can be found in the “Discussion.”
Data Acquisition
MDCTP datasets were acquired by using multisection CT, Somatom Definition AS (Siemens). The total z-direction coverage was 80 mm. Contrast was injected by using a dual-syringe angiographic power injector (Accutron; Medtron, Saarbruecken, Germany) with the following protocol: Thirty-milliliters of contrast medium, Imeron 350 (iopamidol; Bracco, Milan, Italy) was injected into a peripheral vein at a rate of 4 mL/s followed by a 30-mL saline chase.
The interval from performing the MDCTP to arrival in the angiography suite averaged about 30 minutes (range, 20–40 minutes). On arrival in the angiography suite, a dynamic C-arm CBCTP data acquisition was performed by using a prototype data- acquisition mode on a commercial biplane flat detector angiographic system (Axiom Artis zee). Sixty milliliters of contrast medium was injected into a peripheral vein with the use of a dual-syringe power injector (Accutron). For each acquisition, 9 bidirectional rotations (5 forward and 4 reverse) were performed; the contrast medium was injected 5 seconds after the start of the first rotation. Thus, the images from the first 2 rotations did not contain contrast and could be used as the mask images while images from the other 7 captured the bolus passing through the vasculature. These are designated as the “fill” images. The rotation angular range was 200° at approximately 5 seconds for each rotation. Two hundred forty-eight projections were acquired during each rotation. The tube potential was 77 kV(peak), and the dose rate was 0.36 μGy/projection. This acquisition protocol resulted in a temporal window to sample the contrast uptake curve of approximately 5 seconds, with 41 seconds of total acquisition duration. In the 9-sweep CBCTP acquisition protocol used in this study, a total radiation dose of 4.6 mSv9 was delivered to the patient. The dose from a state-of-the-art diagnostic CTP examination is 5.0 mSv.16
Image Postprocessing
MDCT Perfusion Maps.
The acquired MDCTP projection datasets were reconstructed by using the vendor's commercial software, and the parametric perfusion maps (CBF, CBV, MTT, TTP) were calculated by using the NeroPBV perfusion software provided by the vendor (Siemens). Final perfusion maps were reformatted into 512 × 512 images with 10-mm thickness.
CBCT Perfusion Maps.
To enhance the temporal resolution/temporal sampling density and to reduce noise in the reconstructed CBCTP maps, we postprocessed all of the reconstructed image volumes by using the prior image constrained compressed sensing (PICCS) algorithm14,15 to reduce noise and a new technique, temporal resolution and sampling recovery,13 to enhance temporal resolution and improve temporal sampling density. The total time needed to process images with PICCS and temporal resolution and sampling recovery is <3 minutes for each clinical case by using a personal computer equipped with a graphics card. After the application of PICCS and temporal resolution and sampling recovery algorithms, we used the postprocessed CBCT image volumes to generate the dynamic perfusion maps (CBF, CBV, MTT, and TTP) by using the same proprietary software used for the MDCTP maps. The CBCT maps were reformatted into 10-mm section thicknesses to match the CTP maps.
A 3D rigid registration algorithm (a commercially available component of the DynaCT [Siemens] application) was also applied to coregister the MDCTP and the CBCTP maps for comparison; no other motion-correction software was used for image postprocessing.
Image Evaluation
Both MDCTP and CBCTP maps were imported into a research workstation (Nero PBV; Siemens), where CBCTP maps were registered to the corresponding CTP maps. The same color map was applied for both MDCTP and CBCTP datasets. Under the guidance of an experienced clinician, the window and level were adjusted separately for CBCTP and MDCTP to optimize the maps for viewing and analysis.
Qualitative Image-Quality Evaluation.
Four consecutive (adjacent) image sections were selected from each case for evaluation. These yielded 56 images (4 × 7 = 28 images for CTP and 28 images for CBCTP) for each of the 4 dynamic perfusion maps (CBF, CBV, MTT, TTP). The 4 maps from the same section were put together on 1 PowerPoint slide (Microsoft, Redmond, Washington). Then, the 56 slides of each map parameter were randomized and anonymized. These randomized slides were presented to the 2 experienced clinicians (P.Y. and C.S.) to score the quality of maps by using the following 5-point scale: 1, excellent image quality, no limitations for clinical use; 2, good image quality, minimal limitations for clinical use; 3, sufficient image quality, moderate limitations for clinical use but no substantial loss of information; 4, restricted image quality, relevant limitations for clinical use, clear loss of information; 5, poor image quality, image not usable, loss of information; image must be repeated. For each slide, the readers were also asked to indicate their confidence level in determining whether there was a mismatch between CBV and CBF and in making treatment decisions by using the following 5-point rating scale: 1, definitely can; 2, possibly can; 3, unsure; 4, possibly cannot; 5, definitely cannot. After the evaluation of each slide, the 2 readers were asked to record their diagnosis by using the following annotations: 1) no lesion, 2) left, right, or bilateral lesion. They were also asked to indicate their assessment regarding the existence of a mismatch: yes or no.
No other clinical data were provided to the readers, so the diagnosis made was solely based on the 4 parametric maps of each of the 56 slides.
Quantitative Image-Quality Analysis.
By consensus, the same observers who performed the qualitative analysis drew a ROI on the CBF and CBV maps of the 40 datasets (4 for each of the 5 datasets) to indicate the extent of any abnormality. The similarity of the ROIs between the matching (corresponding MDCTP and CBCTP) maps was then quantitatively analyzed for both CBF and CBV maps. The Sørensen-Dice coefficients were used to quantify the similarity of the corresponding ROIs. If the 2 ROIs have the same size and shape, then the Sørensen-Dice coefficient simply shows what percentage of their ROIs overlap (a coefficient of 1 means 100% overlap of the 2 ROIs, and a coefficient of 0.5 means the 2 ROIs overlap by 50%).
Statistical Analysis
Statistical analysis was performed by using the software package (R, Version 3.2.1, http://www.r-project.org). The image quality, confidence level evaluation, and Sørensen-Dice coefficient for ROI similarity analysis are presented as mean ± SD.
Because the scores of image quality and confidence level were ordinal categoric, a visual grading characteristics (VGC) analysis was performed. The 2 axes corresponded to the image criteria scores (ICS) of MDCTP and CBCTP, respectively (ICSCTP versus ICSCBCTP). The similarity analysis of MDCTP and CBCTP in terms of image quality and confidence level was evaluated by using the area under the VGC curve (AUCVGC), in which AUCVGC = 0.5 means that the 2 modalities have equivalent performance. Cohen κ coefficients were calculated to evaluate the interobserver agreement for each variable. The interobserver agreement was described as unacceptable (κ < 0), poor (0 ≤ κ <0.4), fair (0.4 ≤ κ <0.6), good (0.6 ≤ κ <0.8), and excellent (κ ≥ 0.8).
Results
The image quality of the perfusion maps (Fig 1) was judged to be between good and sufficient for both MDCTP (pooled reader rating, 2.4) and CBCTP (pooled reader rating, 2.3) with fair interobserver agreement (κ= 0.45 and 0.62 for MDCTP and CBCTP, respectively). The 2 reviewers also agreed (κ between 0.42 and 0.90) that they had the confidence (scales from 1.2 to 2.0) of making stroke diagnosis, determining whether there is a mismatch, and making treatment decisions on the basis of the perfusion maps computed from both MDCTP and CBCTP datasets. The detailed results of image-quality and confidence level scores are presented in Table 1.
Fig 1.
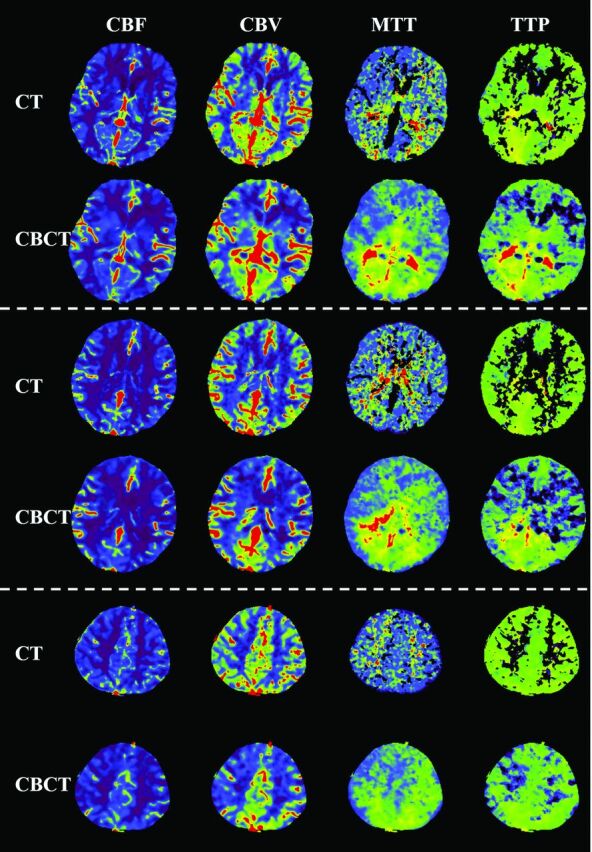
Examples of perfusion parametric maps for both MDCT and CBCT modalities. There are 4 type of maps: CBF, CBV, MTT, and TTP. Three different section locations, separated by using a dashed line, are shown.
Table 1:
Results of image-quality and confidence level evaluation for MDCTP and CBCTP parametric maps
| Modality and Rating | Reader 1 | Reader 2 | Cohen κ |
|---|---|---|---|
| MDCTP | |||
| Image quality | 2.5 ± 0.7 | 2.3 ± 0.8 | 0.45 |
| Confidence level of making stroke diagnosis | 1.6 ± 1.2 | 1.2 ± 0.5 | 0.42 |
| Confidence level of determining whether there is a mismatch | 2.0 ± 1.5 | 1.4 ± 0.7 | 0.50 |
| Confidence level of making treatment decisions | 1.5 ± 1.1 | 1.3 ± 0.7 | 0.79 |
| CBCTP | |||
| Image quality | 2.4 ± 0.6 | 2.1 ± 0.7 | 0.62 |
| Confidence level of making stroke diagnosis | 1.5 ± 0.9 | 1.3 ± 0.5 | 0.75 |
| Confidence level of determining whether there is a mismatch | 1.6 ± 0.9 | 1.4 ± 0.5 | 0.64 |
| Confidence level of making treatment decisions | 1.3 ± 0.5 | 1.3 ± 0.5 | 0.90 |
The VGC curves (Fig 2) demonstrated equivalent performance of MDCTP and CBCTP in terms of image quality (AUCVGC = 0.54 for observer 1 and 0.52 for observer 2) and confidence level of making a stroke diagnosis (AUCVGC = 0.49 for observer 1 and 0.45 for observer 2), determining whether there is a mismatch (AUCVGC = 0.53 for observer 1 and 0.47 for observer 2), and making treatment decisions (AUCVGC = 0.50 for observer 1 and 0.47 for observer 2). AUCVGC > 0.5 indicates that CBCTP has better performance and AUCVGC < 0.5 indicates that MDCTP has better performance. The 95% confidence interval covers 0.5 for both readers.
Fig 2.

Visual grading characteristic curves of the 2 readers in terms of image quality (A) and confidence level of making a stroke diagnosis (B), determining whether there is a mismatch (C), and making treatment decisions (D), respectively. The area under the curve and its 95% confidence interval are also noted on each subplot. ICS indicates image criteria scores.
Table 2 presents the pooled observer reading results for stroke diagnosis. The 2 observers had excellent agreement (κ = 0.93 and 0.94 for MDCTP and CBCTP maps, respectively) about the lesion identification for both MDCTP and CBCTP maps. The 2 observers also agreed on the mismatch detection on the basis of both MDCTP and CBCTP maps; the detailed results are presented in Table 3.
Table 2:
Pooled observer results for lesion identification and location by modalitya
| Modalities | Left | Right | Bilateral | No. of Lesions | Total | Cohen κ |
|---|---|---|---|---|---|---|
| MDCTP | 30 | 25 | 0 | 1 | 56 | 0.93 |
| CBCTP | 32 | 17 | 4 | 3 | 56 | 0.94 |
Cohen κ quantified the interobserver agreement for both modalities.
Table 3:
Pooled observer results for mismatch diagnosis by modalitya
| Modalities | Mismatch (Yes) | Mismatch (No) | Total | Cohen κ |
|---|---|---|---|---|
| MDCTP | 7 | 49 | 56 | 0.51 |
| CBCTP | 16 | 40 | 56 | 0.65 |
Cohen κ quantified the interobserver agreement for both modalities.
The statistical results of similarity analysis of abnormal regions for both CBF and CBV are shown in Table 4. For CBF maps, the abnormal regions extracted from CTP and CBCTP maps showed a strong correlation (Sørensen-Dice coefficient = 0.81± 0.09), while for CBV maps, the abnormal region just demonstrated a fair correlation (Sørensen-Dice coefficient = 0.55 ± 0.23).
Table 4:
Sørensen-Dice coefficient and ROI size results for both CBF and CBV mapsa
| Maps | Sørensen-Dice Coefficient |
ROI Size |
||
|---|---|---|---|---|
| Mean | SD | MDCTP | CBCTP | |
| CBF | 0.81 | 0.09 | 1 ± 0.69 | 0.97 ± 0.44 |
| CBV | 0.55 | 0.23 | 0.38 ± 0.21 | 0.45 ± 0.24 |
The ROI size was normalized with respect to mean ROI size of MDCTP CBF maps.
Examples of the parametric maps (CBF, CBV, MTT, and TTP) for both MDCTP and CBCTP are presented in Figs 1 and 3. The parametric maps of CBCTP look quite similar compared with those from MDCTP, especially for the CBF and CBV maps. In the CBF and CBV maps, gray matter and white matter can be differentiated by both modalities. The same observations can be found in Fig 4.
Fig 3.
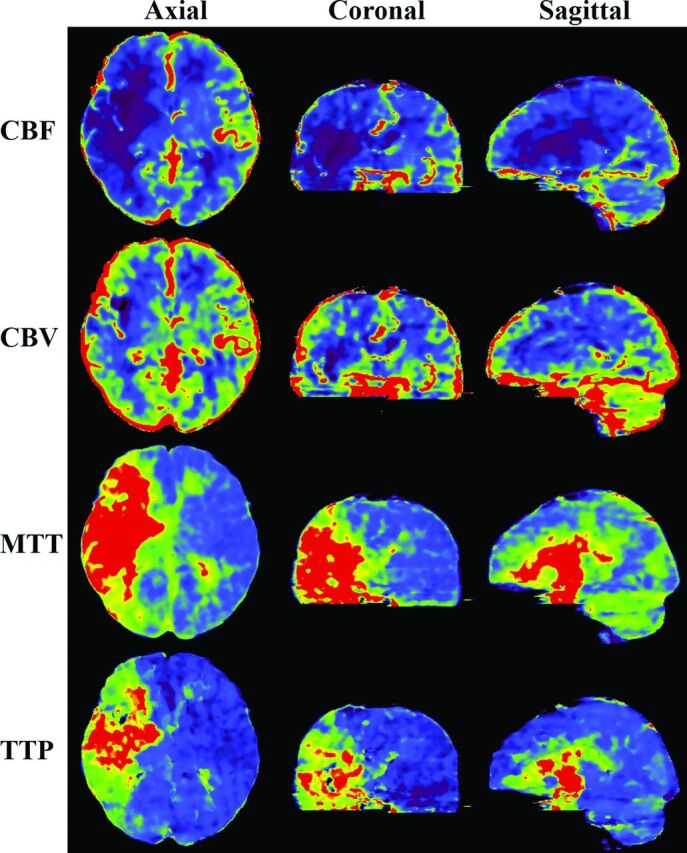
CBCTP-derived parametric maps (CBF, CBV, MTT, TTP) shown on axial, coronal, and sagittal sections. The section thickness is 10 mm for all the images.
Fig 4.

Example of ROI evaluation for CBF and CBV maps from the same patient at same section location. The white ROIs were drawn by the 2 neuroradiologists to indicate the abnormality regions on each map by consensus.
Discussion
In this small feasibility study, parametric perfusion maps (CBF, CBV, MTT, and TTP) made by using data obtained with a commercial biplane flat detector angiographic C-arm system were compared with perfusion maps from conventional MDCT. In terms of image quality, confidence levels of making a diagnosis of a stroke, determining whether there was a mismatch between CBV and CBF, and making treatment decisions, the perfusion maps from CBCTP datasets were judged to have information content equivalent to that of maps obtained from the MDCTP dataset.
In the abnormality shape and size studies, the region of abnormality on the CBV maps was usually much smaller than that on CBF maps (∼40% of CBF ROI sizes, Table 4). Thus, it is harder to manually contour abnormal ROIs on the CBV maps with good precision. This difficulty partially explains why the Sørensen-Dice coefficient is smaller for CBV (Table 4).
The perfusion maps generated from biplane C-arm CBCTP look similar to the maps generated from MDCTP. There was good correlation between the maps in depicting regions of abnormal perfusion. However, because the evolution of ischemic tissue is quite dynamic as time progresses, the shape and location of the penumbra and core may change. The differences in the time between obtaining the MDCTP and CBCTP maps may be 1 reason why these maps may look different. These differences can partially explain the slightly different diagnoses from diagnostic multisection CT and C-arm CBCT (Table 3). The 1 case in this series in which there was spontaneous lysis of a thrombus in the MCA (Fig 5) provides an excellent example of the dynamic nature of the evolution of blood flow and perfusion in acute ischemic stroke. Just as this patient's blood flow and perfusion improved in the MDCTP and CBCTP interval, those of others are perhaps more likely to deteriorate. The potential benefit of being able to measure perfusion parameters at the time when treatment is initiated seems obvious: By replacing conventional MDCTP imaging in patients with acute stroke with CBCTP imaging, the time between stroke onset and revascularization can be substantially reduced. This reduction could be especially helpful for patients being referred from external hospitals for endovascular therapy.17,18 The contrast dose and radiation dose associated with CBCTP are relatively low so that the concept of performing perfusion measurements more than once in some revascularization procedures is, in our opinion, quite reasonable.
Fig 5.

A, CBF map from the MDCTP dataset. B, CBV map from the MDCTP dataset. C, MDCTA image before transfer of the patient to the interventional suite. D, CBF map from the CBCTP dataset acquired after the same patient was transferred to the interventional suite. E, CBV map from the CBCTP dataset. F, Volume-rendered time-resolved CBCTA image derived from the CBCTP dataset. G, DSA image in the interventional suite before the treatment started.
There are several limitations to this study. First, the sample size is small, and the results only demonstrate the feasibility of the technique. Second, these data acquisitions were performed at a single institution (Department of Neuroradiology, University Erlangen-Nuremberg, Germany) during a short time. A multi-institution study with a larger patient cohort is needed to validate both the reliability and reproducibility of CBCTP perfusion maps. Third, all patients were treated under general anesthesia; how severe patient motion associated with awake patients affects the image quality should be evaluated in future study. Fourth, the software used to enhance temporal resolution/temporal sampling and to reduce noise has not yet been optimized for large-scale deployment, so its functionality in a clinical environment has not been established. Fifth, data-acquisition protocols, including contrast dose, radiation dose, delay time, number of back-and-forth acquisitions, and angular coverage for each conebeam CT acquisition, are also not optimized (Fig 6).
Fig 6.

A, A CBF map from a CTP dataset. B, A CBV map from a CTP dataset. C, Arterial input function curve of the CTP dataset used to compute perfusion maps. D, A CBF map from the CBCTP dataset of the same patient. E, A CBV map from the CBCTP dataset. F, Arterial input function curve of the CBCTP dataset used to compute perfusion maps.
Conclusions
After postprocessing with novel methods to enhance temporal sampling/resolution and reduce noise, perfusion data obtained by using a commercial biplane flat detector angiographic system was adequate to create clinically usable parametric maps of CBF, CBV, MTT and TTP. These maps were judged noninferior in information content to perfusion maps obtained by using a commercial MDCT. If available in the angiographic suite, this capability would further enrich the environment for diagnosis, triage, and treatment of patients with an acute ischemic stroke due to a large-artery occlusion.
ABBREVIATIONS:
- AUC
area under the curve
- CBCT
conebeam CT
- CBCTP
conebeam CT perfusion
- MDCT
multidetector CT
- MDCTP
multidetector CT perfusion
- PICCS
prior image constrained compressed sensing
- VGC
visual grading characteristics
Footnotes
Disclosures: Sebastian Schafer—UNRELATED: Employment: Siemens Medical Solutions USA. Kevin Royalty—UNRELATED: Employment: I am a full-time employee of Siemens Medical Solutions. My role is Director of Research Collaborations Eastern North America. Charles Strother—RELATED: Grant: Siemens,* Comments: Funds were provided under a sponsored research agreement between Siemens and the University of Wisconsin-Madison School of Medicine and Public Health; Provision of Writing Assistance, Medicines, Equipment, or Administrative Support: Angiography equipment was provided under a Master Research Agreement between Siemens and the University of Wisconsin-Madison School of Medicine and Public Health*; UNRELATED: Grants/Grants Pending: Funds were provided for x-ray angiography advanced imaging techniques under a sponsored research agreement between Siemens and the University of Wisconsin-Madison School of Medicine and Public Health*; Patents (planned, pending or issued): Payments were made under a nonexlusive licensing agreement; Travel/Accommodations/Meeting Expenses Unrelated to Activities Listed: reimbursed by Siemens for travel and expenses for Symposium on Quantitative DSA 2015 Taiwan. Guang-Hong Chen—RELATED: Grant: National Institutes of Health,* Siemens Research Contract*; UNRELATED: Patents (planned, pending or issued): I am the inventor of PICCS, a patented technology; Royalties: PICCS-related patents were licensed to GE Healthcare and royalties were received by Wisconsin Alumni Research Foundation (WARF).* However, that has nothing to do with the work presented here. *Money paid to the institution.
The work was partially supported by a research grant from the National Institutes of Health (U01 EB021183) and a research agreement with Siemens AX.
REFERENCES
- 1. Berkhemer OA, Fransen PSS, Beumer D, et al. A randomized trial of intraarterial treatment for acute ischemic stroke. N Engl J Med 2015;372:11–20 10.1056/NEJMoa1411587 [DOI] [PubMed] [Google Scholar]
- 2. Campbell BC, Mitchell PJ, Kleinig TJ, et al. ; EXTEND-IA Investigators. Endovascular therapy for ischemic stroke with perfusion-imaging selection. N Engl J Med 2015;372:1009–18 10.1056/NEJMoa1414792 [DOI] [PubMed] [Google Scholar]
- 3. Saver JL, Goyal M, Bonafe A, et al. ; SWIFT PRIME Investigators. Stent-retriever thrombectomy after intravenous t-PA vs. t-PA alone in stroke. N Engl J Med 2015;372:2285–95 10.1056/NEJMoa1415061 [DOI] [PubMed] [Google Scholar]
- 4. Jovin TG, Chamorro A, Cobo E, et al. ; REVASCAT Trial Investigators. Thrombectomy within 8 hours after symptom onset in ischemic stroke. N Engl J Med 2015;372:2296–306 10.1056/NEJMoa1503780 [DOI] [PubMed] [Google Scholar]
- 5. Goyal M, Demchuk AM, Menon BK, et al. ; ESCAPE Trial Investigators. Randomized assessment of rapid endovascular treatment of ischemic stroke. N Engl J Med 2015;372:1019–30 10.1056/NEJMoa1414905 [DOI] [PubMed] [Google Scholar]
- 6. Broderick JP, Palesch YY, Demchuk AM, et al. ; Interventional Management of Stroke (IMS) III Investigators. Endovascular therapy after intravenous t-PA versus t-PA alone for stroke. N Engl J Med 2013;368:893–903 10.1056/NEJMoa1214300 [DOI] [PMC free article] [PubMed] [Google Scholar]
- 7. Khatri P, Yeatts SD, Mazighi M, et al. ; IMS III Trialists. Time to angiographic reperfusion and clinical outcome after acute ischaemic stroke: an analysis of data from the Interventional Management of Stroke (IMS III) Phase 3 Trial. Lancet Neurol 2014;13:567–74 10.1016/S1474-4422(14)70066-3 [DOI] [PMC free article] [PubMed] [Google Scholar]
- 8. Menon BK, Almekhlafi MA, Pereira VM, et al. ; STAR Study Investigators. Optimal workflow and process-based performance measures for endovascular therapy in acute ischemic stroke: analysis of the Solitaire FR thrombectomy for acute revascularization study. Stroke 2014;45:2024–29 10.1161/STROKEAHA.114.005050 [DOI] [PubMed] [Google Scholar]
- 9. Struffert T, Deuerling-Zheng Y, Kloska S, et al. Dynamic angiography and perfusion imaging using flat detector CT in the angiography suite: a pilot study in patients with acute middle cerebral artery occlusions. AJNR Am J Neuroradiol 2015;36:1964–70 10.3174/ajnr.A4383 [DOI] [PMC free article] [PubMed] [Google Scholar]
- 10. Strother CM. 3D imaging in the angiography suite: from vascular anatomy to implant and physiology assessment. AJNR Am J Neuroradiol News Digest November 2013. http://ajnrdigest.org/3d-imaging-angiography-suite-vascular-anatomy-implant-physiology-assessment/. Accessed August 26, 2015.
- 11. Royalty K, Manhart M, Pulfer K, et al. C-arm CT measurement of cerebral blood volume and cerebral blood flow using a novel high-speed acquisition and a single intravenous contrast injection. AJNR Am J Neuroradiol 2013;34:2131–38 10.3174/ajnr.A3536 [DOI] [PMC free article] [PubMed] [Google Scholar]
- 12. Manhart MT, Aichert A, Struffert T, et al. Denoising and artefact reduction in dynamic flat detector CT perfusion imaging using high speed acquisition: first experimental and clinical results. Phys Med Biol 2014;59:4505–24 10.1088/0031-9155/59/16/4505 [DOI] [PubMed] [Google Scholar]
- 13. Tang J, Xu M, Niu K, et al. A novel temporal recovery technique to enable cone beam CT perfusion imaging using an interventional C-arm system. In: Proceedings of SPIE Conference on Medical Imaging, Orlando, Florida. February 9, 2013 [Google Scholar]
- 14. Chen GH, Tang J, Leng S. Prior image constrained compressed sensing (PICCS): a method to accurately reconstruct dynamic CT images from highly undersampled projection data sets. Med Phys 2008;35:660–63 10.1118/1.2836423 [DOI] [PMC free article] [PubMed] [Google Scholar]
- 15. Niu K, Tang J, Royalty K, et al. Radiation dose reduction and CNR enhancement in C-arm cone beam CT. In: Proceedings of SPIE Conference on Medical Imaging, Orlando, Florida. February 9, 2013 [Google Scholar]
- 16. Manniesing R, Oei MT, van Ginneken B, et al. Quantitative dose dependency analysis of whole-brain CT perfusion imaging. Radiology 2016;278:190–07 10.1148/radiol.2015142230 [DOI] [PubMed] [Google Scholar]
- 17. Hung SC, Lin CJ, Guo WY, et al. Toward the era of a one-stop imaging service using an angiography suite for neurovascular disorders. BioMed Res Int 2013;2013:e873614 10.1155/2013/873614 [DOI] [PMC free article] [PubMed] [Google Scholar]
- 18. Doerfler A, Gölitz P, Engelhorn T, et al. Flat-panel computed tomography (DYNA-CT) in neuroradiology: from high-resolution imaging of implants to one-stop-shopping for acute stroke. Clin Neuroradiol 2015;25(suppl 2):291–97 10.1007/s00062-015-0423-x [DOI] [PubMed] [Google Scholar]