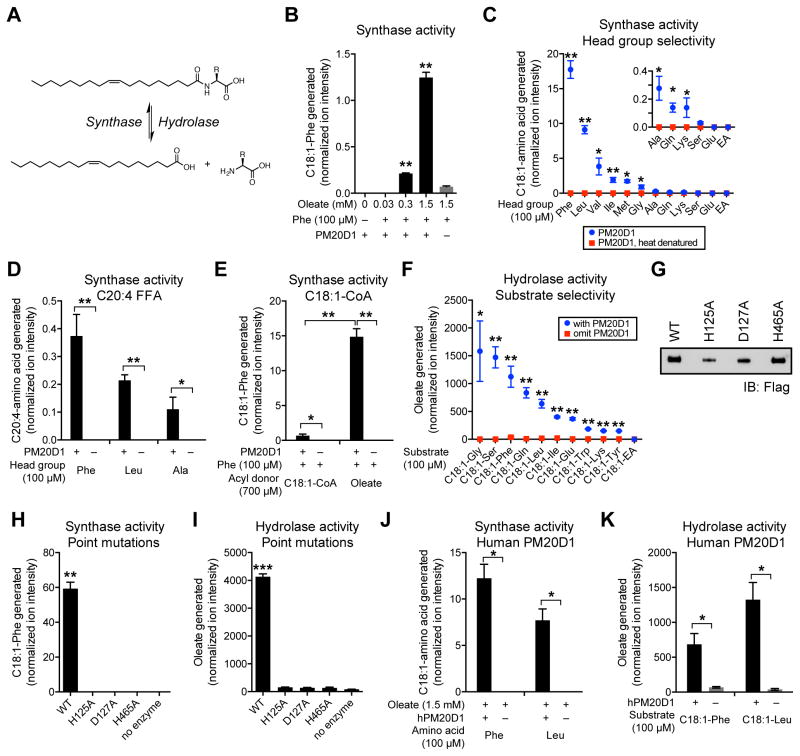
Figure 4. Enzymatic activity of PM20D1 in vitro.
(A) Schematic of synthase and hydrolase reaction of free fatty acid and free amino acid to N-acyl amino acid.
(B) Relative levels of C18:1-Phe generated in vitro from Phe (100 μM), oleate (0.03–1.5 mM), and purified mouse PM20D1-flag.
(C–E) Relative levels of C18:1-amino acid generated in vitro from the indicated head group (100 μM) and purified mouse PM20D1-flag using either oleate (1.5 mM, C), arachidonate (1.5 mM, D) or oleoyl-coenzyme A (C18:1-CoA, 0.7 mM, E). For (C), EA, ethanolamine.
(F) Relative levels of oleate generated in vitro from the indicated N-acyl amide substrates (100 μM) and purified mouse PM20D1-flag. C18:1-EA, N-oleoyl ethanolamine.
(G) Anti-flag Western blot of immunoaffinity purified mouse PM20D1-flag or the indicated point mutants.
(H) Relative levels of C18:1-Phe generated in vitro from Phe (100 μM), oleate (1.5 mM), and the indicated wild-type (WT) or mutant PM20D1-flag protein.
(I) Relative levels of oleate generated in vitro from C18:1-Phe (100 μM) and the indicated wild-type (WT) or mutant PM20D1-flag protein.
(J) Relative levels of C18:1-amino acid generated in vitro from the indicated head group (100 μM), oleate (1.5 mM), and purified human PM20D1-flag.
(K) Relative levels of oleate generated in vitro from the indicated N-acyl amide substrate (100 μM) and purified human PM20D1-flag.
For (B–F) and (H–K), enzymatic assays were carried out in PBS at 37°C for 1.5 hours, n=3/group, mean ± SEM, * p<0.05, ** p<0.01, for reaction with PM20D1 versus reaction omitting PM20D1, or reaction with PM20D1 versus reaction with heat-denatured PM20D1. Y-axes indicates relative ion intensity normalized to 1 nmol of a D3,15N-serine internal standard that was doped in during the extraction process prior to MS analysis.
See also Figure S4.

