Abstract
Aim
To evaluate the pharmacokinetic profile (PK) and embolization effect of 70–150µm doxorubicin eluting beads (DEB) following intra-arterial injection (i.a.) in the rabbit liver VX2 tumour model.
Materials and Methods
In this ACUC approved study, 25 white New Zealand rabbits were randomly assigned into small DEB Group (SDB, n=7, 70–150µm DEB), large DEB Group (LDB, n=7, 100–00µm DEB), untreated controls (n=7), and doxorubicin controls (n=4, without tumour, received i.a. 12.5 mg doxorubicin). Plasma PK was assessed up to 180 min post-injection. Drug tissue and liver enzyme levels, radiologic tumor response and histopathologic tumour necrosis were assessed at 7 days.
Results
Mean tumour doxorubicin concentrations were 922.83nM (SD=722.05) and 361.48nM (SD= 473.23) for the SDB and LDB, respectively (p= 0.005). There was no statistically significant difference in tumour doxorubicinol, plasma doxorubicin and doxorubicinol PK values. More beads were observed in the SDB tumours (p=0.01). Liver enzymes increased and gradually declined over the observation period, with significantly higher values in the SDB.
Conclusion
In this preclinical study, plasma PK of i.a. injected 70–150µm DEB was not different than that of 100–300µm DEB. More beads and higher tissue doxorubicin levels were observed in the SDB tumours.
Keywords: Liver Neoplasms; Injections, Intra-arterial; Doxorubicin; Microspheres; Drug-eluting Beads, DEB
Introduction
Drug-eluting bead chemoembolization (DEB-TACE) with doxorubicin has been established as a simple and standardized alternative of transcatheter arterial chemoembolization (TACE) with lipiodol, for the treatment of unresectable hepatocellular carcinoma(1, 2). During DEB-TACE, microspheres loaded with doxorubicin are selectively or super-selectively injected intra-arterially in order to achieve high intra-tumoral doxorubicin concentration, with minimal systemic doxorubicin exposure. Microsphere size in relation to embolization effect and drug elution rate has been the focus of translational and clinical research since the inception of this technique. While in vitro and in vivo evidence suggests that large doxorubicin-eluting beads (700–900 µm) elute doxorubicin more slowly than smaller ones (100–300 µm), there is limited in vivo preclinical data on the doxorubicin release profiles of the smaller (70–150 µm) DEBs (3–7).
The current study aims to evaluate the effects of 70–150µm doxorubicin-eluting DEBs on plasma and tissue pharmacokinetics, liver function tests, tumour response to therapy on imaging (using the modified Response Evaluation Criteria in Solid Tumours, [mRECIST]) and tumour necrosis on pathology. The clinically validated and routinely used 100–300 µm DEBs served as a comparator and reference.
Materials and Methods
In this Animal Care and Use Committee-approved study, the New Zealand White rabbit animal model was used for the in vivo experiments. VX2 carcinoma cells were used to induce orthotopic tumour growth in the liver thus modelling hepatic arterial supply patterns similar to hepatocellular carcinoma at 10–14 days following transplantation(8, 9).
VX2 cells liver implantation
An aliquot of 200 µL VX2 cells (~1 × 10⁷ cells,) was injected at each hind leg of adult New Zealand White male rabbits, which served as tumour carriers. Tumour growth was allowed for 2 weeks. Carrier tumours were excised and minced. Aliquots of fresh tumour chunks (~100 µL) were then implanted to the left hepatic lobe of recipient animals (9). At approximately two weeks following implantation of VX2 cells to the liver, single liver tumours were identified on baseline CT scans of the liver and treatment was initiated.
Animal Study Design
Our study was designed to observe statistically significant differences on treatment effect, based on the assumption that each treatment group may show mean percentage of tumour necrosis of 75 (SD=20), whereas the control group may show a mean tumour percent necrosis of 45 (SD=13) in agreement with previously published data (10). Assuming power=0.9, alpha=0.05, treatment to control ratio of 1:1, seven animals were used per group. Accordingly, N=25 New Zealand White, rabbits, weighing 3.8–4.3 kg, were randomly assigned into the following groups: 1) Large DEB group (N=7), treated intra-arterially with 100–300 µm DEBs ; 2) Small DEB group (N=7), treated intra-arterially with 70–150 µm DEBs; 3) Untreated Control group (N=7) with animals that did not receive any therapy and were observed for tumour growth and finally 4) Doxorubicin Control group with N=4 tumour-free rabbits that received 12.5 mg intra-arterial doxorubicin and served as the comparison group for the plasma doxorubicin pharmacokinetics study.
Doxorubicin loading procedure on DEB
DEB (DC Bead™, Biocompatibles UK Ltd, Farnham, Surrey, UK) were supplied in two different size ranges of 100–300 µm and 70–150 µm containing 2 mL of hydrated bead volume. Vials containing 50 mg of doxorubicin powder were reconstituted with 2 mL of sterile water and mixed well to obtain a clear red solution (25mg/mL Dox). Then, 3 mL of doxorubicin (75 mg of doxorubicin per vial, 37.5 mg/mL of beads) were added to each vial of DC Bead. Doxorubicin loading was performed for a minimum of 2 hours with intermittent gentle agitation directly before each procedure. The drug loaded DC Beads suspension was mixed with an equal volume of non-ionic contrast medium (Omnipaque™ 370, GE Healthcare, Princeton, NJ).
DEB-TACE procedure
Two interventional radiologists (P.R. and O.P.) performed the embolization according to conventional protocols. Briefly, a 3-French sheath (Cook, Inc., Bloomington, IN) was introduced into the femoral artery. A 2-French catheter (JB1 catheter; Cook, Inc. Bloomington, IN) was then advanced into the aorta and to the celiac axis, where a selective arteriogram was performed. The left hepatic artery was then selectively catheterized with the aid of a steerable guide wire (0.014 in, Transcend™ wire; Boston Scientific Oncology, Natick, MA). From this position, 1mL of DEB/contrast medium of doxorubicin suspension/contrast medium was slowly injected under fluoroscopic guidance until the entire volume was delivered or stasis was observed (average doxorubicin delivered in both DEB-TACE groups = 12.5 mg). Upon completion of the intra-arterial injection, the catheter was removed and the sheath was left in place until the completion of blood draw sampling for the pharmacokinetic study.
CT imaging studies
Twenty-four hours before each DEB-TACE procedure, a baseline dynamic wide-detector CT scan (Aquilion One, Toshiba Co., Tokyo, Japan) of the liver was performed to measure tumour axial dimensions. A second dynamic CT scan of the liver was obtained for each rabbit before euthanasia. Tumour Response was characterized using mRECIST (11). CT scanning imaging parameters were: 120 kV tube voltage; 80 mA tube current; 0.5 sec gantry revolution time; 1 mm pixel spacing; 512×512 matrix (spatial resolution); and 0.5 mm reconstructed slice thickness. Dynamic CT scanning was initiated after a scan delay time of 6 sec, after the beginning of the contrast agent injection of 7 mL (1.5 mL/kg body weight, at 1 mL/sec) iso-osmolar contrast agent (iodixanol 320 mg I/mL, Visipaque ™ 320, GE Healthcare Inc., Princeton, NJ).
Histopathologic evaluation
All DEB-TACE treated animals were euthanized either at 7 days after each DEB-TACE procedure (~21 days following tumour implantation). Control animals were euthanized 21 days following VX2 tumour implantation (in the Untreated Control Group) or at 21 days following study entry (Doxorubicin Control Group). The liver, tumour, spleen, lungs, heart, GI tract and kidneys were grossly inspected upon euthanasia. Tumours were cut and divided in two pieces of roughly equal volume, for snap freezing and formalin fixing, respectively. Tissues selected for paraffin embedment were sectioned (50 µm) and placed in 10% buffered formalin. One slide (5 µm) from each paraffinized section was stained with haematoxylin and eosin (H&E). The total number of DEB per tissue slide was recorded. For each tumour slide, the percentage of tumour necrosis was calculated based on a previously published method(10).
Pharmacokinetics study
To determine the systemic pharmacokinetics of doxorubicin and doxorubicinol, 3 mL blood was drawn from animals at 20, 40, 60, 120, and 180 minutes after administration of DEBs (Large and Small DEB Groups) or intra-arterial doxorubicin (Doxorubicin Control Group). Plasma analysis was done via liquid chromatography-tandem mass spectrometry, according to a previously published protocol(10, 12).
For measurements of tumour tissue doxorubicin and doxorubicinol concentrations, tumour samples for the pharmacokinetic study were further sliced into two parts, corresponding to the tumour centre and the tumour periphery, respectively. Non-tumorous liver samples from the left and right lobes were also obtained and similarly divided into two samples per location to measure non-target deposition of doxorubicin and DEBs. Concentrations of doxorubicin and doxorubicinol in tissues were measured in homogenate tissue by liquid chromatography/mass spectrometry and high performance liquid chromatography with a fluorescence detector, following a previously published protocol (10). The pharmacokinetic analysis of plasma doxorubicin and doxorubicinol included calculations of the area-under-the curve (AUC20 –180 min, expressed in nM*min) using a non-compartmental model and the trapezoidal rule, maximum plasma concentration (Cmax, expressed in nM), half-life (t1/2, in min), elimination Ke, and time-to-maximum-concentration (tomc, in min). The maximum plasma concentration of doxorubicin and doxorubicinol detected from baseline (20 min) to 180 min after intraarterial injection was defined as Cmax. The half-life (t1/2) was defined as the time at which the metabolite plasma concentration has decreased to half of Cmax. Ke was defined as the elimination constant and tomc (tmax) is defined as the time to reach Cmax.
Biochemical liver function assessment
Blood samples for assessment of liver function were obtained at baseline and in selected animals, at 24, 48, and 72 hours, and in all animals before euthanasia. Liver function tests included liver enzymes (aspartate transaminase [AST] and alanine transaminase [ALT]), gamma-glutamyl transferase (GGT), and total bilirubin.
Statistical analysis
Statistical analysis was performed using STATA version 12.0 (Stata Corporation, College Station, TX, USA). Results were expressed as mean, standard error of mean (SEM) or standard deviation (SD) values. Unpaired t-tests were used for comparisons of continuous variables between two groups. Results were considered statistically significant if p<0.05.
Results
Intra-arterial embolization with DC Bead
The mean duration of DEB injection was 9.6 minutes (SD= 6) for Large DEB Group and 9.4 minutes (SD=5) for Small DEB Group (p=0.98). This slow rate of injection (approximately 0.1 mL/minute) was chosen, so as to avoid early vessel spasm and to ensure that the total amount of DEB would be injected. The total amount of DEB/contrast medium suspension was delivered in 5 out 7 rabbits of the Large DEB Group. Retrograde flow inside the selected artery was observed in the other 2 rabbits, in which 0.8 and 0.7 mL were injected, respectively, and the injection was prematurely terminated. Similarly, the total (1 mL) of DEB/Contrast medium suspension was injected in 5 out 7 rabbits of the Small DEB Group. Retrograde flow inside the selected artery was observed in the other 2 rabbits, in which 0.35 and 0.7 mL were injected, respectively and the injection was prematurely terminated.
Gross pathology and histopathology
The heart, lungs, kidneys, duodenal tissue, pylorus, spleen and small bowel were found grossly intact at necropsy in all animals. The appearance of the liver was normal in non-embolized areas but pale, wedge-shaped areas were identified in embolized and necrotic areas. Tumours appeared quite necrotic in all treated animals and in some instances, with central liquefaction. Untreated animals had necrotic tumours, but without core liquefaction. On histopathology, mean percent tumour necrosis was 73.1 (SD: 17.6) in the Large DEB Group and 58.6 (SD: 28.3) in the Small DEB Group (p= 0.27). Mean percent tumour necrosis in the Untreated Control Group was 61.6 (SD: 22.3), reflecting primarily the aggressive nature of the VX2 tumour model.
DEB counts
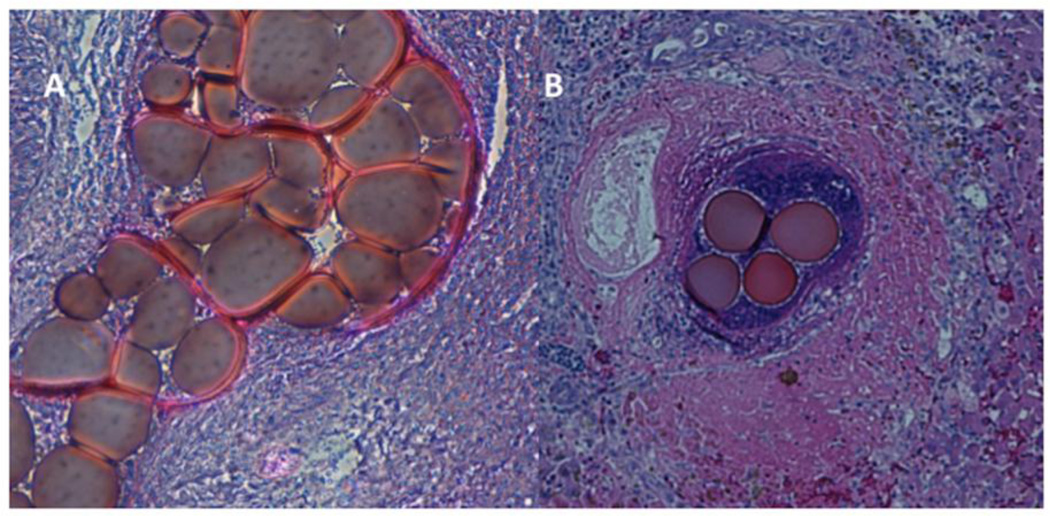
Single beads and DEB clusters were identified inside the tumour in both groups (Figure 1). However, a greater number of beads, primarily clustered, were identified in the Small DEB Group. The average number of beads per tumour slide was 6.94 (SD=9.13) in the Small DEB Group, compared to 3.29 (SD=4.12) in the Large DEB Group (p= 0.01). The average number of beads per slide in ipsilateral-to-tumour liver tissue was 1.53 per liver tissue slide (SD= 3.97) in the Large DEB Group and 2.97 (SD=9.05) in the Small DEB Group (p= 0.008). The average number of beads per slide in the contralateral liver tissue was 3.86 per liver tissue slide (SD=4.10) in the Large DEB Group and 2.63 (SD=8.92) in the Small DEB Group (p= 0.39). DEB were also found in gallbladder tissue, duodenum, small bowel and spleen tissue slides of both groups. An isolated single large DEB was found in the right lung of one animal. DEBs were not identified in the heart or kidneys of both groups (Table 1).
Figure 1.
Pathology images of H&E-stained slides of tumours treated with 70–150 µm DEB.
A. Cluster of 70–150µm DEB inside a tumour-feeding arteriole, which they almost completely obliterate, at the tumour centre (magnification × 40).
B. Cluster of 70–150µm DEB inside a tumour-feeding arteriole, at the tumour periphery (magnification × 25), in a different animal than in Figure 1A. Tumour is identified in the left section of this image, with characteristic tumour cell necrosis (purple). Healthy hepatic parenchyma is identified at the right of this image. There is also inflammatory reaction (purple) at the area surrounding the DEB.
TABLE 1.
Average number of beads per tissue slide in non-targeted organs and relevant p-values for the comparison of the average number of beads per tissue slide of Large (100–300 µm) DEB and Small (70–150 µm) DEB groups.
| Large DEB group | Small DEB group | P-value | |
|---|---|---|---|
| Gall bladder | 2.03 | 3.06 | 0.2 |
| Small Bowel | 0.41 | 0 | >0.9 |
| Pylorus | 0.05 | 0 | >0.9 |
| Duodenum | 0.23 | 0.22 | >0.9 |
| Right lung | 0.08 | 0.05 | >0.9 |
| Left lung | 0.03 | 0 | >0.9 |
| Spleen | 0.2 | 0 | >0.9 |
Liver function
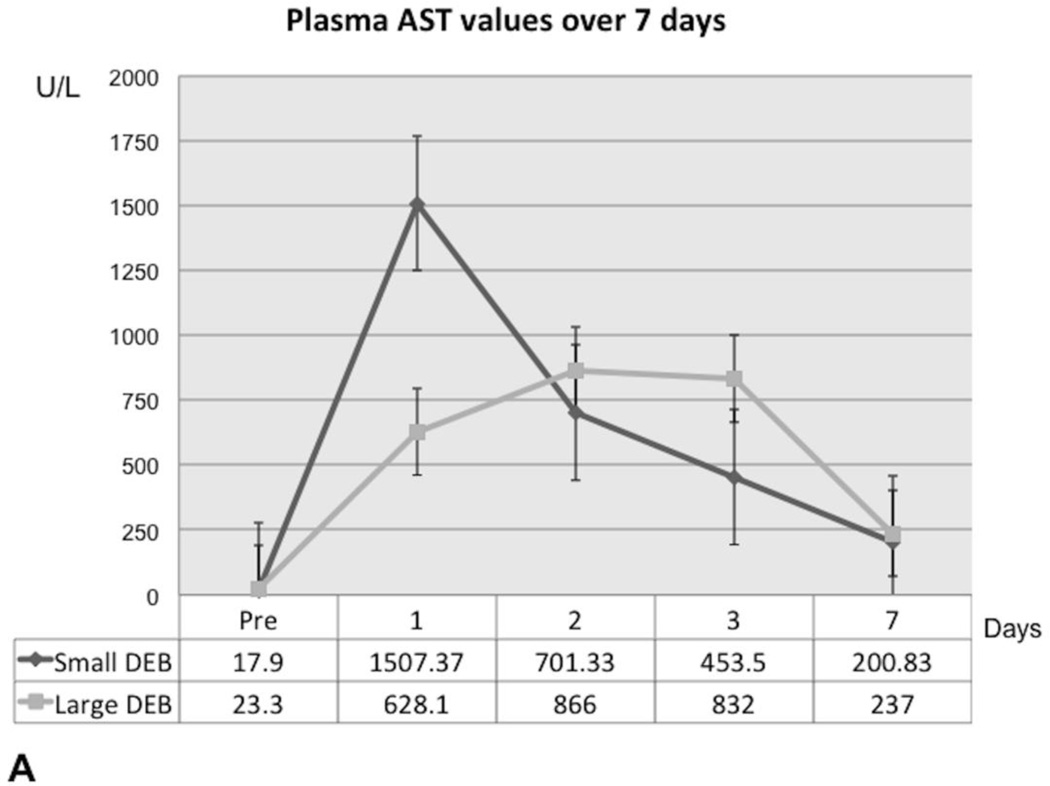
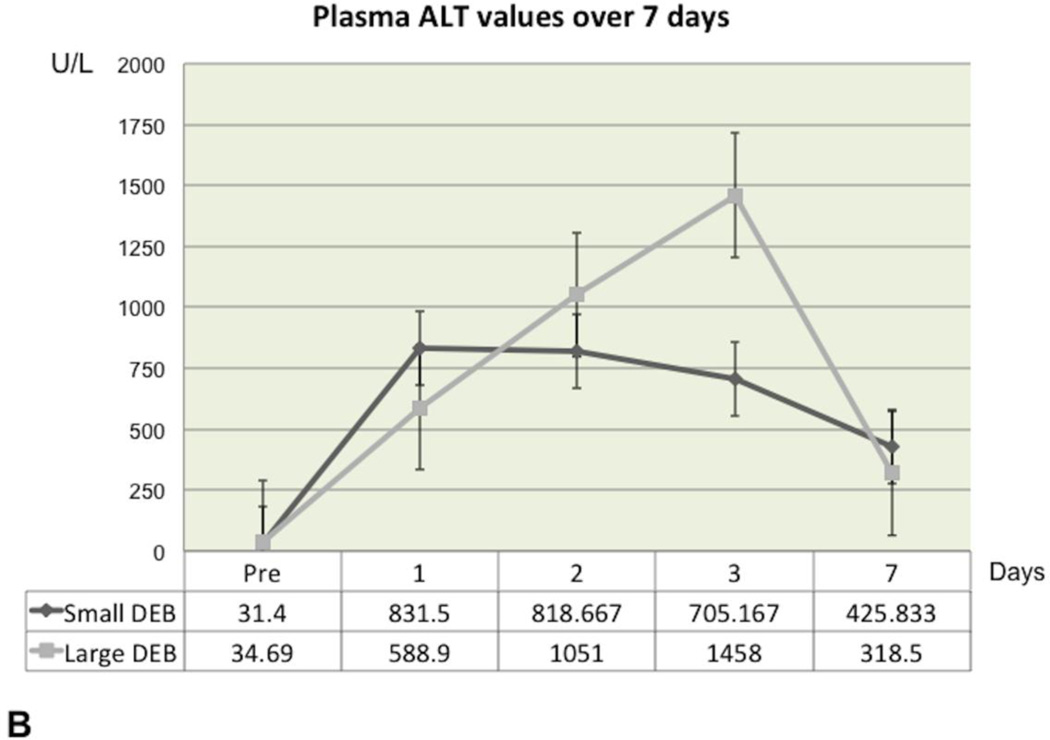
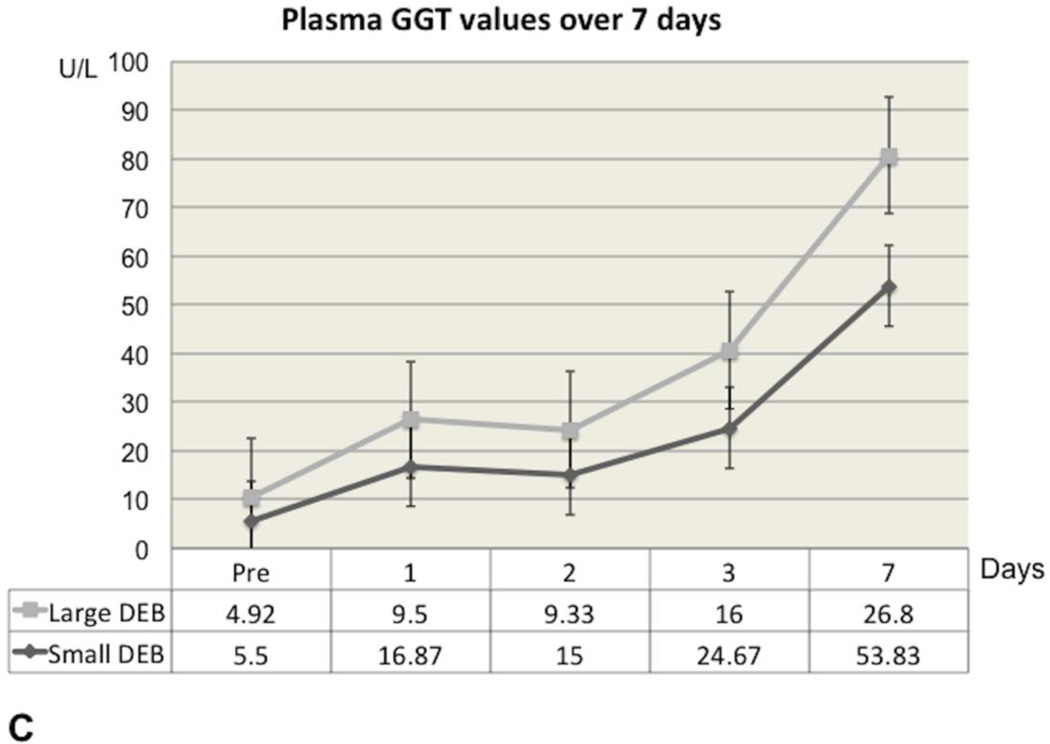
In the Small DEB Group, ALT and AST reached their highest values 24 hours after DEB injection, after which time point they gradually declined, but without returning to baseline values at the end of the observation period (Figure 2A and Figure 2B). In the Small DEB group, average baseline ALT was 31.4 U/L (SD=9.26) and average 7-day ALT was 425.83 U/L (SD=304.17, normal range=48–70 U/L, p=0.01); average baseline AST was 17.9 U/L (SD=5.76) and average 7-day AST was 200.83 U/L (SD=175.54, normal range=33–99 U/L, p=0.03). In the Large DEB group, both AST and ALT peaked at 48 hours, after which time point they gradually declined, but similarly to the small DEB group, without returning to baseline values. In the Large DEB group average baseline ALT was 34.69 U/L (SD=10.57) and average 7-day ALT was 318.5 U/L (SD=273.46, p=0.03). The Large versus Small DEB group ALT comparison did not yield any statistically significant differences at 24 hours, 48 hours and 7 days. At 3 days, the Large DEB group had an average ALT value of 1458 U/L (SD=320.579) and the Small DEB 425.833 U/L (SD=124.179, p=0.03). The Large versus Small DEB group AST comparison yielded statistically significant differences at 24 hours (Large DEB mean=628.1 U/L, SD=80.22; Small DEB mean= 1507.37 U/L, SD=893.21, p=0.04) and 3 days (Large DEB mean= 832 U/L, SD=318.17; Small DEB mean=453.5 U/L, SD=11.98, p= 0.02). The Large versus Small DEB group GGT comparison yielded statistically significant differences at 24 hours (Large DEB mean= 9.5 U/L, SD= 1.05; Small DEB mean= 16.87, SD= 5.1, p= 0.008), 48 hours (Large DEB mean= 9.33, SD=1.38; Small DEB mean= 15, SD=1.5, p=0.0001), 3 days (Large DEB mean=16 U/L, SD=5.38; Small DEB mean= 24.67 U/L, SD= 3.45, p=0.006) and 7 days (Large DEB mean= 26.8, SD=5.22, Small DEB mean= 53.83 U/L, SD= 20.145, p= 0.01, normal range: 50–140 U/L, Figure 2C). Total bilirubin levels remained within normal levels throughout the observation period, for both groups.
Figure 2.
Graphs depicting liver enzyme value (AST, ALT and GGT) changes over the observation time period for the Large and Small DEB Groups.
A. Graph depicting aspartate transaminase (AST) plasma concentration changes over the 7-day observation period, in the Large and Small DEB Groups (expressed in U/L). Note the slightly earlier rise in AST in the Small DEB Group.
B. Graph depicting alanine transaminase (ALT) plasma concentration changes over the 7-day observation period, in the Large and Small DEB Groups (expressed in U/L). Note the slightly earlier rise in ALT in the Small DEB Group).
C. Graph of Gamma-Glutamyl Transpeptidase (GGT) plasma concentrations of liver enzymes over the 7-day time period, for Large and Small DEB Groups (expressed in U/L).
Plasma pharmacokinetics and tissue doxorubicin and doxorubicin concentrations
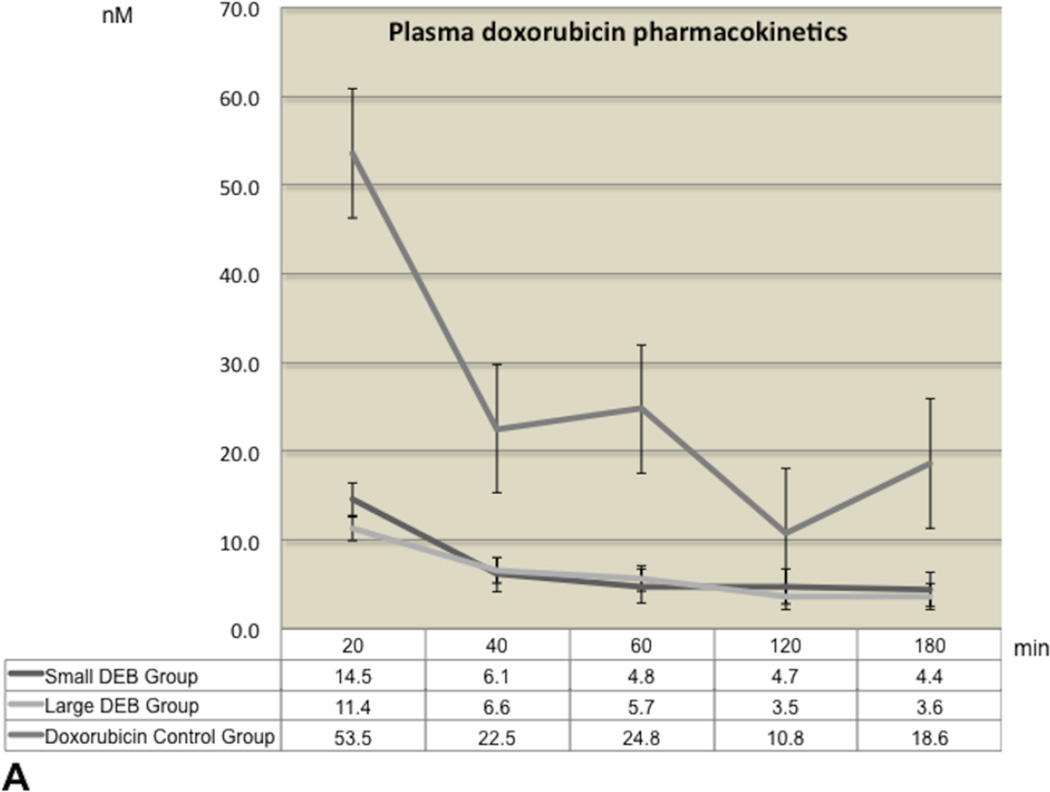
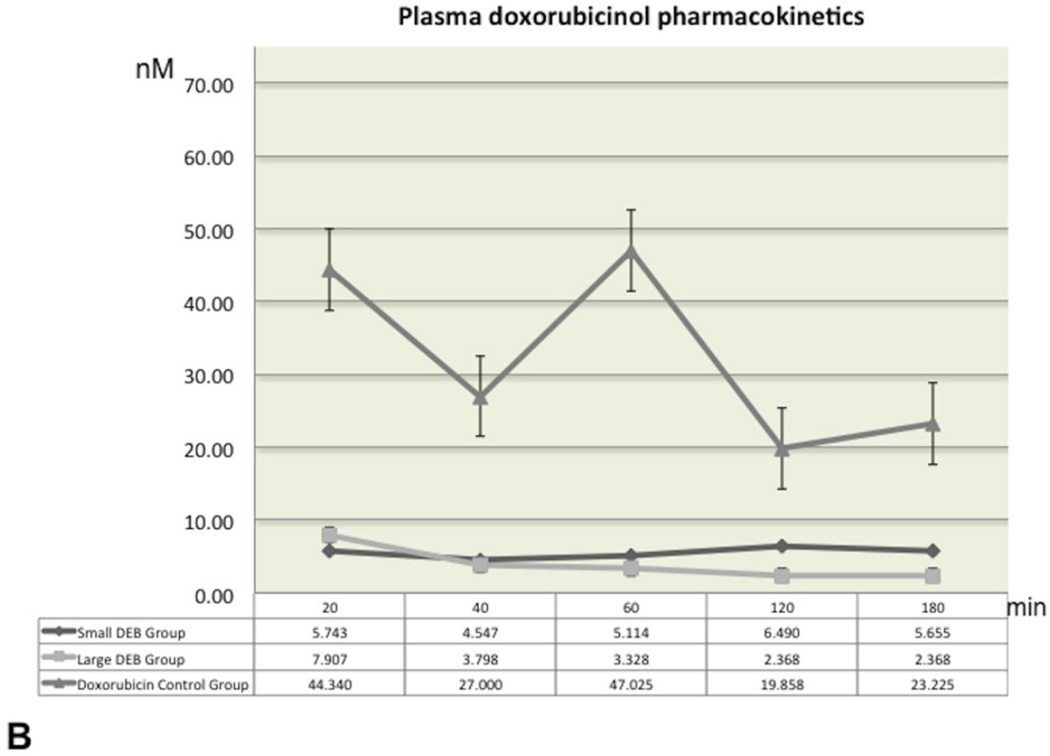
The plasma levels of doxorubicin and doxorubicinol over the entire 180 minutes blood-sampling period are shown in Figure 3 (3A and 3B). The highest doxorubicin plasma concentration levels were recorded at baseline (20 minute post-procedure) in all groups. Mean doxorubicin values over time were quite comparable and without statistically significant differences between the Large and Small DEB groups (p=0.99 for each time point comparison). Similarly, mean doxorubicinol values remained roughly unchanged and at low levels (below 10 nM) throughout the 180 minutes period, in both Large and Small DEB groups. Mean baseline (20 min) doxorubicinol values in the Doxorubicin Control Group (mean=53.53 nM, SD=35.32) were roughly 10 times higher than these of Large (mean=4.08 nM, SD=4.24) or Small (mean=5.74 nM, SD=8.70, p=0.02) DEB Groups. Mean doxorubicinol values in the Doxorubicin Control Group declined over time, but remained significantly higher than the values observed in the other two groups, at each time point (p<0.04, Figure 3B).
Figure 3.
Graphs of mean plasma doxorubicin and doxorubicinol concentrations across time for all groups.
A. Graphs of mean plasma doxorubicin concentration-time profiles, following a single intra-arterial injection, for all groups. Concentrations are expressed in nM. Time is expressed in minutes. Error bars represent standard errors of the mean (SEM).
B. Graphs of mean plasma doxorubicinol concentration-time profiles, following a single intra-arterial injection, for all groups. Concentrations are expressed in nM. Time is expressed in minutes. Error bars represent standard errors of the mean (SEM).
The calculated pharmacokinetic parameters are reported in Table 2. Mean doxorubicin AUC for the Small DEB Group was 1019.96 nM * min (SD: 767.50) and 897.93 nM * min (SD: 575.86) for the Large DEB Group (p=0.65). Mean Doxorubicinol AUC for the Small DEB Group was 969.39 nM* min (SD: 1098.81) and 656.32 nM* min (SD: 754. 25) for the Large DEB Group (p=0.76). Doxorubicin Cmax was 15.14 nM (SD: 21.29) in the Small DEB Group and 11.86 nM (SD: 9.02) in the Large DEB Group (p=0.67). Differences in all measured pharmacokinetic parameters between the Large and Small DEB Groups were not statistically significantly different (P>0.05), whereas pharmacokinetic parameters in the Doxorubicin Control Group were statistically significantly different (p=0.0001 and p=0.0006 for comparisons of AUC Doxorubicin of Small DEB vs. Control Group and of Large DEB versus Control Group, respectively; p=0.99 for other comparisons).
TABLE 2.
Calculated pharmacokinetic parameters for doxorubicin and doxorubicinol in plasma samples following intra-arterial injection in the left hepatic artery.
| Pharmacokinetic Parameters |
Small DEB Group (SD) |
Large DEB Group (SD) |
Control Group (SD) |
|---|---|---|---|
|
AUC Doxorubicin (nM*min) |
1019.96 (767.51) |
897.13 (575.86) |
3713.87 (955.38) |
|
Cmax Doxorubicin (nM) |
15.15 (21.23) |
11.86 (9.02) |
60.65 (24.58) |
|
t1/2 Doxorubicin (min) |
236.72 (173.53) |
378.65 (538.85) |
111.44 (49.36) |
| Ke Doxorubicin | 0.005 (0.005) |
0.005 (0.005) |
0.007 (0.002) |
|
tomc Doxorubicin (min) |
34 (31.34) |
29.09 (16.40) |
60 (80) |
|
AUC Doxorubicinol (nM*min) |
969.39 (1098.81) |
656.33 (754.26) |
6873.54 (3396.30) |
|
Cmax Doxorubicinol (nM) |
7.28 (8.97) |
5.60 (7.27) |
54.02 (34.07) |
|
t1/2 Doxorubicinol (min) |
240.43 (.) |
234.13 (230.51) |
93.49 (11.30) |
| Ke Doxorubicinol | 0.002 (.) |
0.005 (0.004) |
0.001 (0.001) |
|
tomc Doxorubicinol (min) |
136 (65.86) |
132.73 (60.84) |
80 (69.28) |
AUC= Area under the concentration curve, in nM* min; Cmax= maximum concentration, in nM; t1/2 =half life of drug, in min; Ke= elimination rate; tomc=time to maximum concentration, in min.
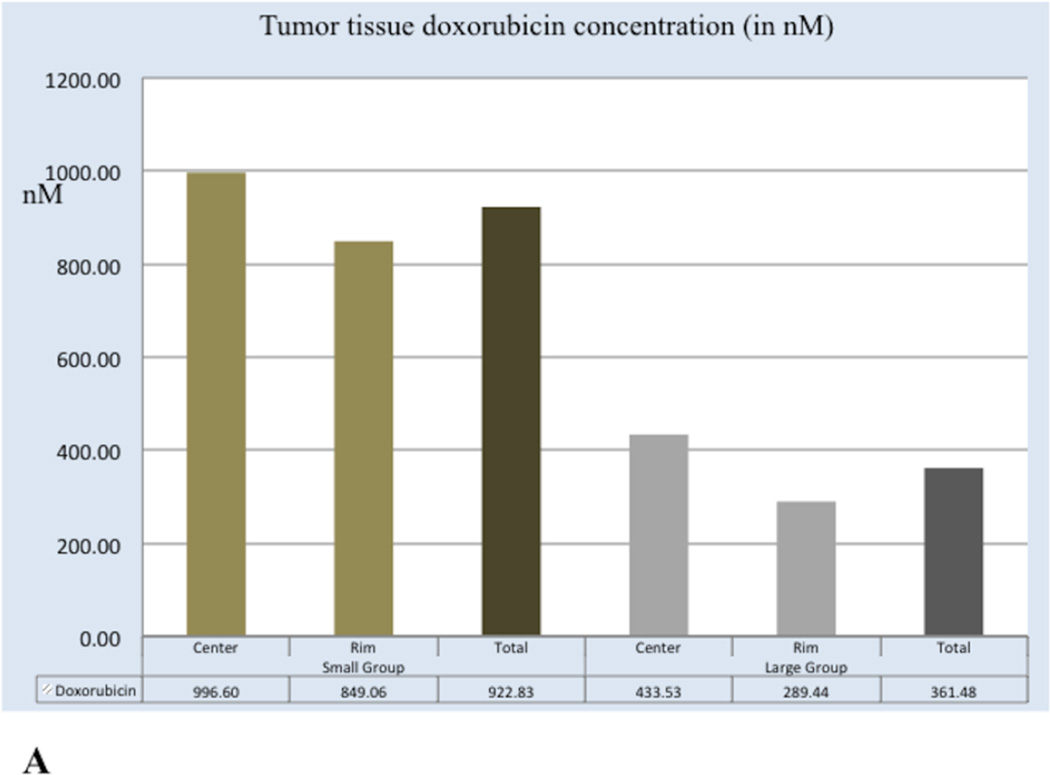
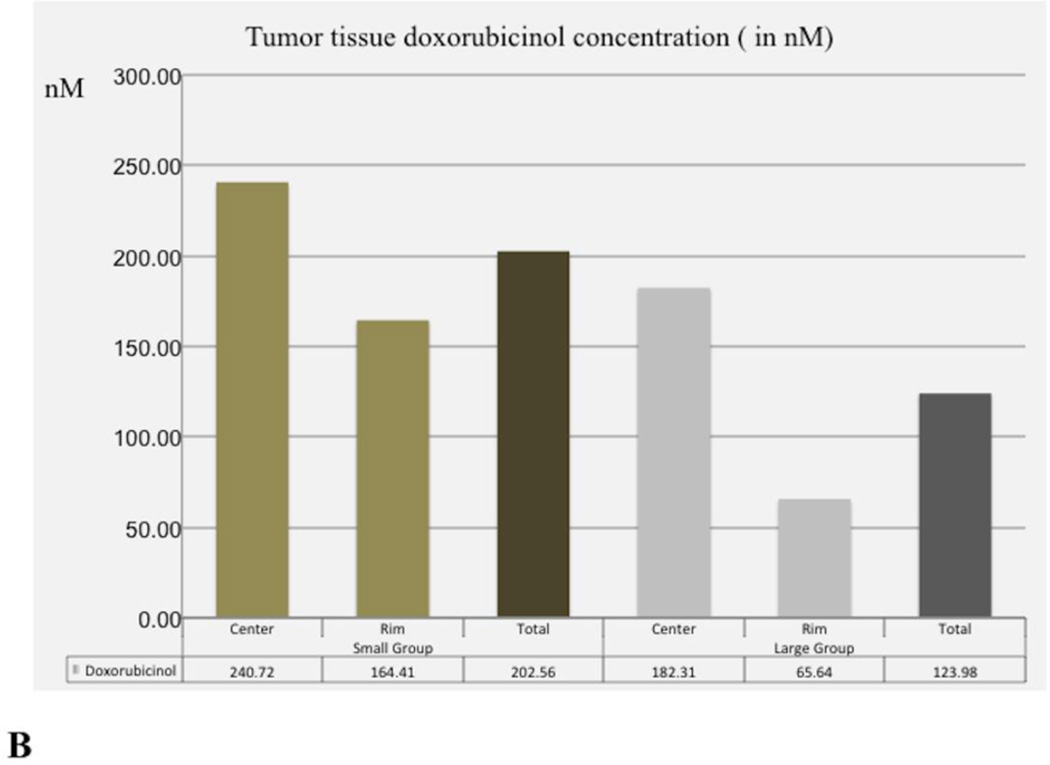
Tumour tissue doxorubicin and doxorubicinol concentrations are shown in Figure 4. Tumour tissue doxorubicin concentration values in Small DEB Group (mean=922.83 nM, SD=722.05) were significantly higher than those of the Large DEB Group (mean=361.48, SD= 473.23, p= 0.005). However, tumour tissue doxorubicinol concentration values in the Small DEB Group (mean=202.56 nM, SD=247.71) were not significantly different than in the Large DEB Group (mean = 123.97 nM, SD=259.43, p=0.31).
Figure 4.
Graphs depicting tumour tissue doxorubicin (A) and doxorubicinol (B) values in the Large and Small DEB groups at 7 days.
A. Mean doxorubicin concentration values in tumour centre, tumour periphery and overall tumour at 7 days following treatment. Mean doxorubicin values are expressed in nM.
B. Mean doxorubicinol concentration in tumour centre, tumour periphery and overall tumour at 7 days following treatment. Doxorubicinol values are expressed in nM.
Tumour response to therapy according to mRECIST
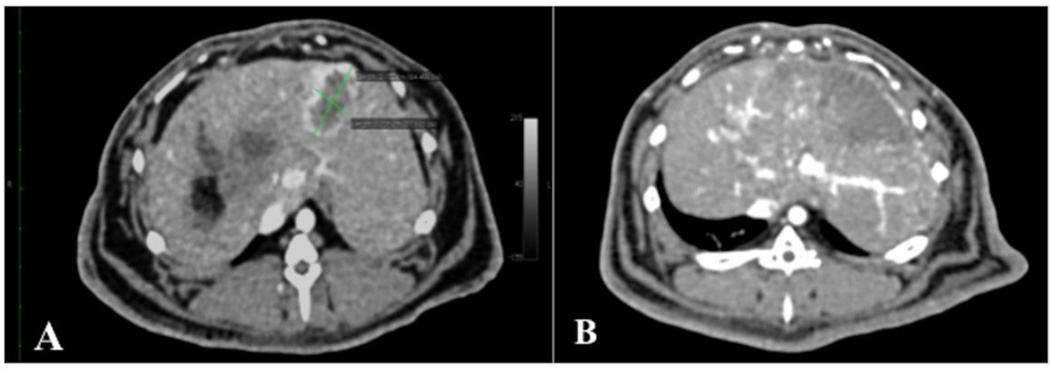
Average axial longest tumour diameter on baseline CT scans was 1.60 cm (SD=0.59) in the Small DEB Group and 1.71 cm (SD=0.54) in the Large DEB Group (p= 0.68). At 7 days and according to mRECIST, 3 LDB rabbits showed objective response (complete or partial response); while 3 showed stable disease and one rabbit progressed. At the same time point, all 7 SDB rabbits showed objective response (Figure 5).
Figure 5.
Axial contrast-enhanced CT images of rabbit liver, demonstrating VX2 liver tumour response to intra-arterial injection of 70–150 µm DEB.
A. Baseline axial contrast-enhanced (late arterial phase) CT images of rabbit liver, demonstrating a VX2 tumour (green calipers), measuring 2.13 × 1.22 cm, at 14 days following liver VX2 tumour implantation and 24 hours before treatment with intra-arterial injection of 70–150 µm DEB. Note the hypovascular necrotic core, already present at 14 days.
B. Axial contrast--enhanced (late arterial phase) CT images of rabbit liver, 7 days after treatment with intra-arterial injection of 70–150 µm DEB. Note there is no visibly enhancing tumour, rather a hypovascular wedge-shaped area corresponding to the area where the VX2 tumour is located. This response was deemed complete response, according to the modified RECIST.
Discussion
Initially introduced almost a decade ago, DEB-TACE involves the injection of DEB, with a size range between100 and 700 µm, attempting to concurrently embolize the tumour feeding arterial supply and deliver cytotoxic doxorubicin that is gradually released inside the tumour (6, 10, 13). In an effort to penetrate further into targeted tumor tissue, and therefore deliver more doxorubicin to the tumour centre, we investigated the pharmacokinetic profile and embolic effects of the smaller size 70–150 µm DEB. In our study, the plasma doxorubicin and doxorubicinol pharmacokinetic profiles of 70–150 µm DEB were comparable to that of 100–300 µm DEB at each time point of blood sampling, indicating that there is minimal doxorubicin release in the systemic circulation with either group especially when compared to intra-arterial control. This result is in accordance with previously published data on the plasma pharmacokinetic profile of 100–300 µm DEB(10). While we clearly demonstrated that a higher number of small 70–150 µm DEB than the larger 100–300 µm reached the tumour core, accompanied by higher doxorubicin levels in tumour tissue, doxorubicinol levels were not significantly different between groups.
One interesting aspect of our study was the apparent greater response rate by imaging (mRECIST) in the Small DEB Group than in the Large DEB Group. Such results can be explained by the fact that more of the small DEB reached the tumour and were deposited within the tumour itself, presumably being responsible for limiting arterial enhancement. However, the histological analysis did not demonstrate any difference in the necrotic fraction. This discrepancy may be explained by both the limitations of mRECIST and the difficulty in calculating percent necrosis in liquefied tumours (14). Nonetheless, the greater bead numbers, drug delivery and imaging response for the smaller DEB is promising requiring additional investigation into the complex interplay between drug delivery, embolization, imaging and cell death.
Statistically significant differences in ALT were observed at 3 days, whereas AST values in the Small DEB Group were significantly higher at all time points following embolization.. The significance of these findings is unclear as the hepatic parenchyma was shown to gradually recover in both groups, as indicated by the subsequent decline in liver enzyme values over time. A longitudinal study is warranted to investigate the prognostic effects of liver enzyme increase in relation to bead size on patient survival.
Our study has several limitations. First, contrary to our study design assumption high percentages of tumour necrosis were observed in all groups, including the untreated control group. The high level of baseline necrosis and liquefaction complicated the histological comparisons. Moreover, we did not include control arms of unloaded bland Small and Large DEB, to further illuminate the effect on tumour necrosis, based solely on microsphere size. Therefore, we postulate that the mRECIST results may overestimate the treatment effect and may serve more as a descriptive method of assessing the embolization effect, rather than a method of accurately assessing VX2 tumour necrosis. A recently published clinical study on radiologic-pathologic correlation of tumour necrosis is in agreement with our discordant findings, suggesting that CT overestimates the extent of tumour necrosis, with presence of viable tumour in almost 30% of cases deemed as complete response(14). The desire to deliver a predetermined dose resulted in retrograde flow in some animals likely causing the observation of non-target embolization. In this traditional large animal preclinical study, survival was not measured, but rather animals were euthanized at predefined stopping points in order to limit unnecessary tumour burden-related stress. Lastly, the doxorubicin and doxorubicinol HPLC method used in our study requires tissue homogenization. This technique, therefore, does not precisely measure drug tissue concentration, since it cannot distinguish bead-bound drug from tissue-bound drug. Fluorescence and autoradiography may be more precise techniques for determining spatial drug delivery(6, 7, 13).
Conclusion
Our preclinical study on the rabbit VX2 liver cancer model suggests that intra-arterial injection of 70–150µm doxorubicin-eluting beads leads to plasma doxorubicin and doxorubicinol pharmacokinetic profiles that are comparable to those of 100–300 µm doxorubicin-eluting beads. A higher number of 70–150µm doxorubicin-eluting beads may be seen in tumour tissue. In addition, tumour tissue doxorubicin concentration values were significantly higher in the 70–150µm DEB Group than in the 100–300 µm DEB Group. Future research should focus on assessing the long-term tumour doxorubicin elution and treatment effects of the 70–150µm DEB.
KEY POINTS.
Key Point 1: Small and large doxorubicin-eluting beads show similar plasma pharmacokinetic profiles.
Key Point 2: Higher tissue doxorubicin levels were observed in the small bead group.
Key Point 3: Liver enzymes were overall significantly higher in the small bead group.
Acknowledgments
The scientific guarantor of this publication is Jean-Francois Geschwind, M.D. The authors of this manuscript declare relationships with the following companies: Biocompatibles, PLC; Guerbet, LLC, Philips Healthcare. This study has received funding by Biocompatibles, PLC. No complex statistical methods were necessary for this paper. Institutional Review Board approval was not required because this is an animal study. Written informed consent was obtained from all subjects (patients) in this study. Written informed consent was waived by the Institutional Review Board. Approval from the institutional animal care committee was obtained. Study subjects or cohorts have not been previously reported. Methodology: prospective, experimental, performed at one institution.
ABBREVIATIONS
- ACUC
Animal Care and Use Committee
- AST
aspartate transaminase
- ALT
alanine transaminase
- AUC
Area Under the Curve
- Cmax
Maximum concentration
- Cm
centimetres
- CR
Complete Response
- CRPV
Shope cottontail rabbit papillomavirus
- C
Celsius
- DEB
doxorubicin eluting beads
- DEB-TACE
doxorubicin -eluting beads chemoembolization
- GGT
gamma-glutamyl transferase
- GI
gastrointestinal
- i.a.
intra-arterial
- in
inches
- IN
Indiana
- Kg
kilogram
- kV
kilovoltage
- LDB
Large DEB group
- MA
Massachusetts
- Mg
milligrams
- Min
minutes
- mRECIST
modified Response Evaluation Criteria in Solid Tumours
- µm
micrometers
- µL
microlitres
- mL
millilitres
- n
number
- NJ
New Jersey
- nM
nanomolar
- NWZ
New Zealand White
- PK
pharmacokinetic
- PR
Partial Response
- SDB
Small DEB group
- SD
Standard Deviation
- SEM
Standard Error of the Mean
- TACE
Transcatheter Arterial Chemoembolization
- TX
Texas
- UK
United Kingdom
- USA
United States of America
- VX2
Shope cottontail rabbit papillomavirus
REFERENCES
- 1.Golfieri R, Giampalma E, Renzulli M, et al. Randomised controlled trial of doxorubicin-eluting beads vs conventional chemoembolisation for hepatocellular carcinoma. British journal of cancer. 2014;111(2):255–264. doi: 10.1038/bjc.2014.199. [DOI] [PMC free article] [PubMed] [Google Scholar]
- 2.Burrel M, Reig M, Forner A, et al. Survival of patients with hepatocellular carcinoma treated by transarterial chemoembolisation (TACE) using Drug Eluting Beads. Implications for clinical practice and trial design. Journal of hepatology. 2012;56(6):1330–1335. doi: 10.1016/j.jhep.2012.01.008. [DOI] [PubMed] [Google Scholar]
- 3.Gonzalez MV, Tang Y, Phillips GJ, et al. Doxorubicin eluting beads-2: methods for evaluating drug elution and in-vitro: in-vivo correlation. J Mater Sci Mater Med. 2008;19(2):767–775. doi: 10.1007/s10856-006-0040-y. [DOI] [PubMed] [Google Scholar]
- 4.Lewis AL, Gonzalez MV, Lloyd AW, et al. DC bead: in vitro characterization of a drug-delivery device for transarterial chemoembolization. Journal of Vascular and Interventional Radiology. 2006;17(2 Pt 1):335–342. doi: 10.1097/01.RVI.0000195323.46152.B3. [DOI] [PubMed] [Google Scholar]
- 5.Lewis AL, Gonzalez MV, Leppard SW, et al. Doxorubicin eluting beads - 1: effects of drug loading on bead characteristics and drug distribution. J Mater Sci Mater Med. 2007;18(9):1691–1699. doi: 10.1007/s10856-007-3068-8. [DOI] [PubMed] [Google Scholar]
- 6.Namur J, Wassef M, Millot JM, Lewis AL, Manfait M, Laurent A. Drug-eluting beads for liver embolization: concentration of doxorubicin in tissue and in beads in a pig model. Journal of Vascular and Interventional Radiology. 2010;21(2):259–267. doi: 10.1016/j.jvir.2009.10.026. [DOI] [PubMed] [Google Scholar]
- 7.Dreher MR, Sharma KV, Woods DL, et al. Radiopaque drug-eluting beads for transcatheter embolotherapy: experimental study of drug penetration and coverage in Swine. Journal of Vascular and Interventional Radiology. 2012;23(2):257–264. e4. doi: 10.1016/j.jvir.2011.10.019. [DOI] [PMC free article] [PubMed] [Google Scholar]
- 8.Lee KH, Liapi E, Buijs M, et al. Percutaneous US-guided implantation of Vx-2 carcinoma into rabbit liver: a comparison with open surgical method. J Surg Res. 2009;155(1):94–99. doi: 10.1016/j.jss.2008.08.036. [DOI] [PMC free article] [PubMed] [Google Scholar]
- 9.Lee KH, Liapi E, Ventura VP, et al. Evaluation of different calibrated spherical polyvinyl alcohol microspheres in transcatheter arterial chemoembolization: VX2 tumor model in rabbit liver. Journal of Vascular and Interventional Radiology. 2008;19(7):1065–1069. doi: 10.1016/j.jvir.2008.02.023. [DOI] [PMC free article] [PubMed] [Google Scholar]
- 10.Hong K, Khwaja A, Liapi E, Torbenson MS, Georgiades CS, Geschwind JF. New intra-arterial drug delivery system for the treatment of liver cancer: preclinical assessment in a rabbit model of liver cancer. Clin Cancer Res. 2006;12(8):2563–2567. doi: 10.1158/1078-0432.CCR-05-2225. [DOI] [PubMed] [Google Scholar]
- 11.Lencioni R, Llovet JM. Modified RECIST (mRECIST) assessment for hepatocellular carcinoma. Semin Liver Dis. 2010;30(1):52–60. doi: 10.1055/s-0030-1247132. [DOI] [PubMed] [Google Scholar]
- 12.Lee KH, Liapi EA, Cornell C, et al. Doxorubicin-loaded QuadraSphere microspheres: plasma pharmacokinetics and intratumoral drug concentration in an animal model of liver cancer. Cardiovasc Intervent Radiol. 2010;33(3):576–582. doi: 10.1007/s00270-010-9794-1. [DOI] [PMC free article] [PubMed] [Google Scholar]
- 13.Namur J, Citron SJ, Sellers MT, et al. Embolization of hepatocellular carcinoma with drug-eluting beads: doxorubicin tissue concentration and distribution in patient liver explants. Journal of hepatology. 2011;55(6):1332–1338. doi: 10.1016/j.jhep.2011.03.024. [DOI] [PubMed] [Google Scholar]
- 14.Bargellini I, Bozzi E, Campani D, et al. Modified RECIST to assess tumor response after transarterial chemoembolization of hepatocellular carcinoma: CT-pathologic correlation in 178 liver explants. European journal of radiology. 2013;82(5):e212–e218. doi: 10.1016/j.ejrad.2012.12.009. [DOI] [PubMed] [Google Scholar]


