Abstract
Purpose:
Noise characteristics of clinical multidetector CT (MDCT) systems can be quantified by the noise power spectrum (NPS). Although the NPS of CT has been extensively studied in the past few decades, the joint impact of the bowtie filter and object position on the NPS has not been systematically investigated. This work studies the interplay of these two factors on the two dimensional (2D) local NPS of a clinical CT system that uses the filtered backprojection algorithm for image reconstruction.
Methods:
A generalized NPS model was developed to account for the impact of the bowtie filter and image object location in the scan field-of-view (SFOV). For a given bowtie filter, image object, and its location in the SFOV, the shape and rotational symmetries of the 2D local NPS were directly computed from the NPS model without going through the image reconstruction process. The obtained NPS was then compared with the measured NPSs from the reconstructed noise-only CT images in both numerical phantom simulation studies and experimental phantom studies using a clinical MDCT scanner. The shape and the associated symmetry of the 2D NPS were classified by borrowing the well-known atomic spectral symbols s, p, and d, which correspond to circular, dumbbell, and cloverleaf symmetries, respectively, of the wave function of electrons in an atom. Finally, simulated bar patterns were embedded into experimentally acquired noise backgrounds to demonstrate the impact of different NPS symmetries on the visual perception of the object.
Results:
(1) For a central region in a centered cylindrical object, an s-wave symmetry was always present in the NPS, no matter whether the bowtie filter was present or not. In contrast, for a peripheral region in a centered object, the symmetry of its NPS was highly dependent on the bowtie filter, and both p-wave symmetry and d-wave symmetry were observed in the NPS. (2) For a centered region-ofinterest (ROI) in an off-centered object, the symmetry of its NPS was found to be different from that of a peripheral ROI in the centered object, even when the physical positions of the two ROIs relative to the isocenter were the same. (3) The potential clinical impact of the highly anisotropic NPS, caused by the interplay of the bowtie filter and position of the image object, was highlighted in images of specific bar patterns oriented at different angles. The visual perception of the bar patterns was found to be strongly dependent on their orientation.
Conclusions:
The NPS of CT depends strongly on the bowtie filter and object position. Even if the location of the ROI with respect to the isocenter is fixed, there can be different symmetries in the NPS, which depend on the object position and the size of the bowtie filter. For an isolated off-centered object, the NPS of its CT images cannot be represented by the NPS measured from a centered object.
Keywords: CT, noise power spectrum, bowtie filter, image quality
1. INTRODUCTION
The noise performance of x-ray CT, including noise magnitude and noise correlation, is often characterized by the noise power spectrum (NPS) in the spatial frequency domain. A thorough understanding of the dependence of the NPS on CT system parameters is indispensable for the development of CT technologies and for the optimization of CT scanning protocols in clinical practice.1–5 The NPS is also frequently used to calculate other important CT performance metrics such as frequency-dependent noise equivalent quanta [NEQ(f)], frequency-dependent detective quantum efficiency [DQE(f)], and task-based detectability index.6–15 Previous works have theoretically modeled and experimentally characterized the NPS of CT as a function of hardware systems, x-ray exposure levels, detector configurations, reconstruction algorithms, x-ray beam divergence, image objects, and imaging tasks.13–30 Early studies often assumed CT noise to be wide-sense stationary (WSS), which enabled conclusions drawn from the NPS of a specific location (usually the isocenter) to be generalizable to the entire scan field of view of the CT system. Recently, it has been demonstrated that CT noise may not necessarily satisfy the WSS condition; therefore, the measurement of the NPS often needs to be restricted to a finite “local” region-of-interest (ROI), and the discussion about the NPS often needs to be performed separately for each individual ROI.13,20–22,28,30 The concept of local NPS has gained increasing popularity, especially for CT systems with imaging components that may strongly violate the WSS condition. The potential sources of noise nonstationarity include nonuniformity or heterogeneity in the image objects, highly nonlinear iterative CT reconstruction algorithms, and the divergent nature of the fan-shaped or cone-shaped x-ray beams.20,21
In the work by Baek and Pelc,20 an analytical model for the NPS of CT systems with direct fan beam filtered backprojection (FBP) reconstruction was derived as a function of ROI location relative to the scanner isocenter. It was demonstrated that for peripheral ROIs the NPS had sharp discontinuities at high frequencies; the phenomenon was attributed to differences in bandwidth and the use of fan beam reconstruction weightings that compensate for variable magnification. As also pointed out in Ref. 20, the discussion about the impact of direct fan beam reconstruction on the NPS was not directly applicable to multidetector CT (MDCT) systems that use fan-to-parallel beam rebinning before image reconstruction. Interestingly, even if fan-to-parallel rebinning is used, strong angular anisotropy can still be observed in the experimental NPS measured from clinical MDCT systems.28 This observation motivated the development of a modified NPS model to understand the observed anisotropic NPS in this paper.
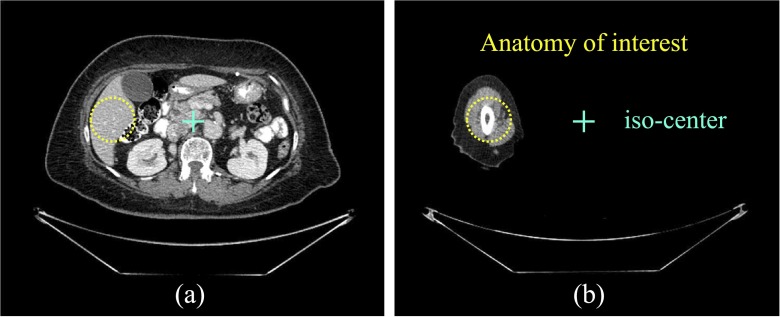
Despite the fact that clinical MDCT systems use beam shaping filters on a daily basis, the impact of this important factor on the NPS had not been systematically studied for clinical MDCT systems. The primary purpose of using the so-called bowtie filters is to reduce unnecessary radiation exposure at the peripheral region of a patient, which is much thinner compared with the central region of the body. For such a peripheral region, fewer incoming x-ray photons are needed to generate a useful signal at the detector. The introduction of the bowtie filter also alleviates the variation of beam hardening effects and inhomogeneity of noise distribution across the entire field-of-view (FOV).31–33 However, to fully achieve the potential benefits of the bowtie filter, several requirements must be satisfied. For example, it was assumed that the center of the patient is always aligned with the center of the bowtie filter. In reality, this condition may be violated, such as in elbow exams as shown in Fig. 1(b). In this kind of clinical setting, the use of the bowtie filter may lead to unexpected consequences such as strong noise nonuniformity.34–36 Therefore, it is highly desirable to investigate the potential effect of the bowtie filter on the NPS of MDCT systems.
FIG. 1.
The same off-centered location (e.g., the dotted circle) may correspond to either a peripheral region inside a centered object in (a) or a region inside an isolated off-centered object in (b).
Several recent studies have also demonstrated the necessity to characterize the local NPS of MDCT as a function of image object and imaging task rather than the location of the ROI relative to the isocenter.13–15,26,28,29 As shown in the CT images from Fig. 1, the same peripheral region in the CT scanner FOV may correspond to either a peripheral region of a centered object or the central region of an off-centered object. Therefore, the NPS measured from a centered object cannot be used to represent the NPS of the ROI of an off-centered object, even if the physical location of the ROI in the scan FOV is the same.
The purpose of this work is to study the joint impact of the bowtie filter and image object position, particularly when the object is off-centered, on the two dimensional (2D) local NPS of clinical MDCT systems using FBP reconstruction. Specifically, modifications to the current NPS theoretical model for parallel beam geometry are proposed. Both numerical simulations and physical phantom experiments have been performed to validate the proposed NPS model.
2. METHODS AND MATERIALS
2.A. Qualitative description of the joint impact of the bowtie filter and image object position on the local NPS
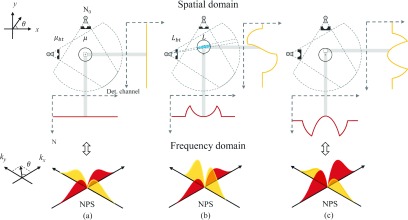
One of the key contributions of this work is to incorporate the bowtie filter into the discussion of the NPS. The impact of the bowtie filter on the NPS can be schematically illustrated as shown in Fig. 2. In Fig. 2(a), the image object is placed at the isocenter of the CT system, the ROI is located in the central region, and an ideal bowtie filter is used to perfectly compensate for the x-ray attenuation from the uniform circular object. In this case, the bowtie filter successfully achieves its goal, and as a consequence the expected photon number is constant across detector pixels and projection view angles, as are the expected noise magnitude and noise correlation. As a result, the NPS of the corresponding CT image would be shift-invariant and circularly symmetric. However, when the object is off-centered, the bowtie filter may not perfectly compensate for the x-ray attenuation from the image object. Figure 2(b) shows that when the projection view angle is along the horizontal direction, the center of the vertically off-centered object is aligned with the thickest portion of the bowtie along the x-rays, while the thin peripheral region of the object is actually aligned with the thinnest segment of the bowtie. In this case, the expected photon number and noise magnitude vary across detector pixels and projection view angles. The NPS of CT images reconstructed from these projections will demonstrate a strong angular anisotropy. Figure 2(c) shows another case in which the bowtie filter does not perfectly compensate for the attenuation of the image object, even when the object is perfectly centered. This scenario often occurs in clinical practice due to variation in body size across patients. As shown in the figure, even when the object is perfectly centered, the expected photon number and noise magnitude may vary across detector pixels. For the central region in the phantom, it always corresponds to the central portion of the bowtie filter no matter what the projection view angle is; therefore, the local NPS of this region in the CT image is circularly symmetric. For any peripheral region in the object, the total attenuation from the bowtie and the object itself may vary across projection view angles, leading to an anisotropic 2D NPS of CT.
FIG. 2.
Demonstration of how the bowtie filter and object position can jointly impact the number of x-ray photons (N) received by each detector channel. (a) A centered object with perfectly matched bowtie filter; (b) an off-centered object with the same bowtie filter; (c) a centered object with a bowtie filter that is designed for a much larger object. N0 represents the expected photon number prior to the bowtie filter and the image object; μbt and μ are the linear attenuation coefficients of the bowtie filter and the image object, while Lbt and L (highlighted in blue) denote their thicknesses, respectively. The “+” symbol marks the isocenter of the scan FOV. The shaded areas highlight detector elements contributing to the local NPS of each ROI when fan-to-parallel beam rebinning is used before reconstruction. (See color online version.)
2.B. Quantitative modeling of the joint impact of the bowtie filter and image object position on the local NPS
2.B.1. A modified local NPS model
In this work, it was assumed that for a given projection view angle, the bowtie filter and image object only impact the magnitude of projection noise and do not change its spatial correlation properties. This assumption will be justified by the experimental results presented later in this paper. The classical relationship between the 2D NPS of CT and the 1D NPS of projection data for parallel beam geometry is given by1,5,20,21
| (1) |
where k and θ are radial frequency and projection view angle, respectively; (k, θ) is the polar coordinates corresponding to a point (kx, ky) in Cartesian coordinates. |k| is the ramp kernel used in FBP reconstruction; G(k) is an additional apodization window function, and NPSp(k, θ) is the 1D NPS of projection data acquired at view angle θ.
One can further decompose NPSp(k, θ) into an angular dependent term, namely, noise variance, , of projection data at view angle θ and an angular-independent term, namely, normalized NPS (NNPS). This decomposition has also been used in a recent study.30 With this decomposition, Eq. (1) takes the following form:
| (2) |
For quantum-limited CT systems, the noise variance of the logarithmic-transformed projection data is inversely proportional to the expected photon number incident on the detector (N), which is related to the image object and the bowtie filter by
| (3) |
In Eq. (3), N0 is the expected photon number prior to the bowtie filter and the image object, μbt and μ are the linear attenuation coefficients of the bowtie filter and the object, while Lbt and L denote the thicknesses of the bowtie filter and the object, respectively. As illustrated in Fig. 2(b), Lbt (or L) is determined by the intersection of the bowtie filter (or the object) with the x-ray going through the ROI along a projection view angle θ. For an off-centered object or a peripheral region in a centered object, both Lbt and L vary across projection view angles. Based on Eq. (3) and the inverse relationship between and N, one has the following generalized local NPS model:
| (4) |
where
| (5) |
and
| (6) |
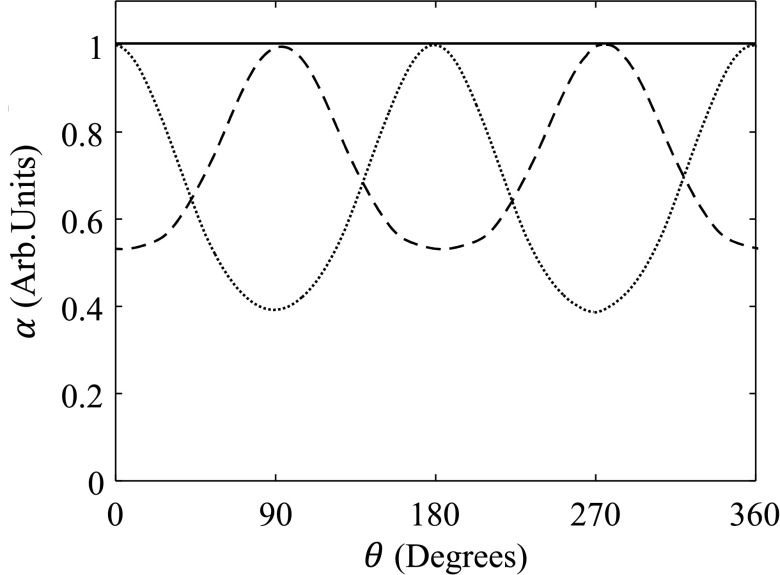
For a given ROI in the CT image, the possible variation of its NPS along the angular direction is introduced by the term α(θ). Figure 3 shows several example plots of a normalized α(θ).
FIG. 3.
Plots of α vs θ for a central region in a centered object (solid line), a vertically off-centered peripheral region inside a centered object (dashed line), and a central region in a vertically off-centered object (dotted line). A large bowtie filter was used, and θ = 0° corresponds to a horizontal projection taken at the 3 o’clock position. Each curve has been normalized by the peak magnitude of α.
2.B.2. Direct computation of the NPS without image reconstruction from the generalized local NPS model
The generalized local NPS model in Eqs. (4)–(6) can be used to directly compute the 2D NPS of CT images from the normalized NPS of projection data. The 2D NPSs obtained from this direct computation approach can then be compared with the measured 2D NPSs of the reconstructed CT images in both numerical simulations and phantom experiments to validate the accuracy of the generalized local NPS model.
Note that the direct computation of the local NPS using the generalized local NPS model is fundamentally different from the numerical simulation-based NPS measurement described in Sec. 2.C where noisy projection data were generated first; then filtered backprojection was performed to reconstruct CT images; then this process was repeated to generate an ensemble of noisy CT images; and finally the 2D local NPS was measured from the noise-only CT image ensemble. To make a fair and reasonable comparison of the NPSs generated from the two different approaches, all the studies were performed under matched experimental conditions. Namely, both approaches used the same set of bowtie filters (Fig. 4), same set of simulated objects (Fig. 5), same mean number of incoming photons (N0), same x-ray spectra, same ramp filter (|k|) and apodization filter [G(k)], and same discrete sampling rate. Specifications of these parameters are detailed in Sec. 2.C. In the direct computation approach, the thicknesses of the bowtie filter (Lbt) and the image object (L) that correspond to a targeting ROI were calculated for each view angle θ, and Eqs. (4)–(6) were used to directly calculate the 2D NPS of CT. The normalized projection NPS (NNPSp) was assumed to be a constant of one, which corresponds to uncorrelated white noise in the detector plane.
FIG. 4.
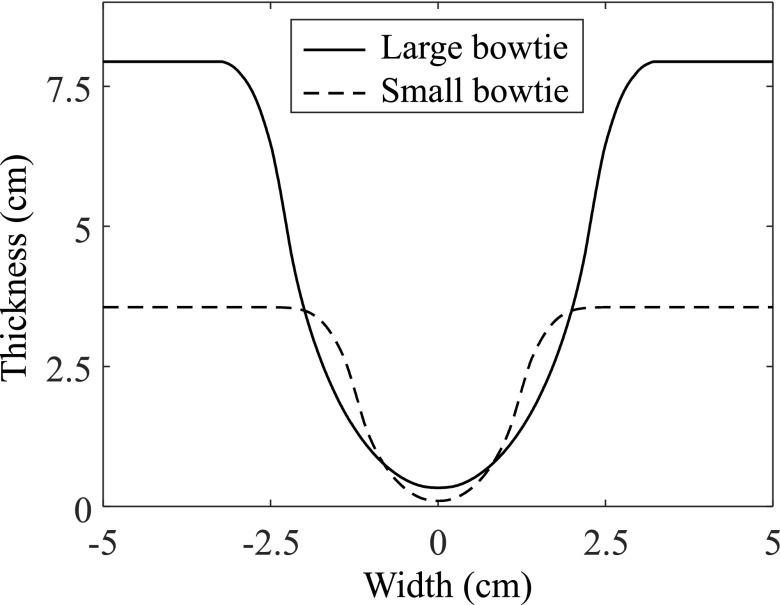
Design of the large and small aluminum bowtie filters used in the direct computation approach and numerical simulations.
FIG. 5.
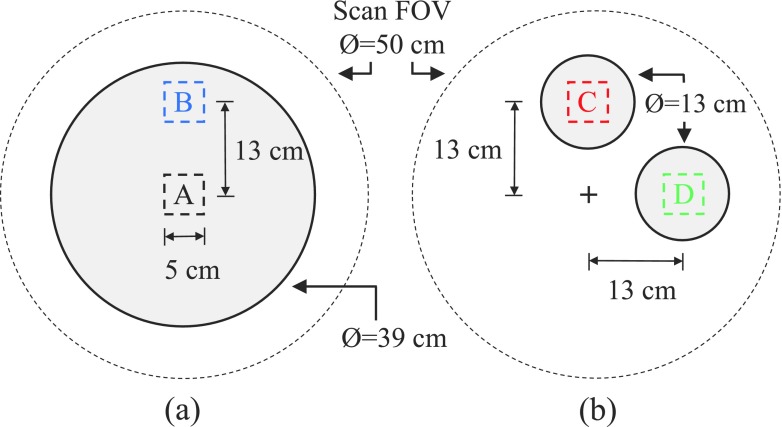
Numerical phantoms used in the direct computation approach and simulation studies. (a) Central region (ROI A) and peripheral region (ROI B) inside a centered object. (b) Central region inside an object that is off-centered in the vertical (ROI C) or horizontal direction (ROI D).
2.C. Validation of the generalized local NPS model in numerical phantom studies
The clinical MDCT system used in experimental phantom studies described in Sec. 2.D does use fan-to-parallel rebinning scheme before image reconstruction. However, the specific data preprocessing steps are the vendor’s proprietary information. It is unclear whether the proprietary data preprocessing steps would confound the NPS study in this paper. To avoid those potential confounding factors, numerical simulation studies were first performed in this section to validate the proposed generalized local NPS model.
The following CT system parameters were used to simulate a 64-slice MDCT scanner (described in Sec. 2.D): 60° fan beam, 888 detector elements, 984 projection views per rotation, a source-to-detector distance of 947 mm, a source-to-isocenter distance of 539 mm, and a source-to-bowtie filter distance of 100 mm. The geometric magnification factor of the bowtie filter relative to the isocenter was therefore 5.39. A monochromatic x-ray beam of 70 keV was used as a surrogate for the polychromatic 120 kV beam used in the experimental CT system. The expected photon number prior to the bowtie filter and image object, N0, was set to 7 × 10⁵ photons per ray; this number was determined by matching the noise variance of ROI A from the simulated CT images with the noise variance of ROI A from the experimental phantom images. Two different bowtie filters that resemble the attenuation profiles of the so-called “large” and “small” bowtie filters found in the clinical CT system were used; their shape, shown in Fig. 4, was estimated based on specific transmission values provided by the vendor and based on the geometric magnification factor from the CT system used in the simulations. These filters were assumed to be made of aluminum.
The numerical phantoms used in the NPS studies (Fig. 5) were designed to maximally match those used in the actual experiments (Fig. 6). The material of the numerical phantoms was therefore polyethylene, and the corresponding x-ray attenuation coefficient was obtained from the NIST database.37 The 2D NPS was characterized in four different 5 × 5 cm2 ROIs, as shown in Fig. 5, which again matched those in the actual phantom experiments.
FIG. 6.
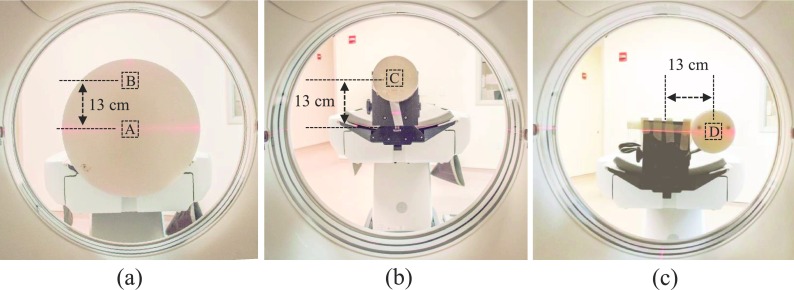
Geometric setup of the physical phantom experiments. A 39 cm diameter polyethylene phantom placed at the isocenter of the scanner (a). A 13 cm polyethylene phantom off-centered vertically (b) and laterally (c) by 13 cm. ROIs A, B, C, and D in this figure and in Fig. 5 have one-to-one correspondence.
The attenuation profiles of the bowtie filters and the numerical phantoms were forward projected using the fan beam geometry of the simulated CT system. Poisson noise was then added based on the transmitted photon number (N) using the matlab function poissrnd (The MathWorks, Inc., Natick, MA), which provided the desired white uncorrelated Poisson noise. Then, a fan-to-parallel beam rebinning step was performed across projection views and along detector channels using a two-step interpolation process.33 Next, parallel beam FBP reconstruction was performed using the ramp kernel and an apodization filter of the form
| (7) |
where kN denotes Nyqvist frequency. The reconstructed images have a matrix size of 512 × 512 and an isotropic pixel size of 0.625 × 0.625 mm2. The simulation process was repeated M = 500 times for each bowtie and phantom size, and the NPS was calculated as
| (8) |
where Nx × Ny is the matrix size of the ROI, Δx = Δy is the CT image pixel size, DFT denotes the 2D discrete Fourier transform, and denotes the mean ROI image averaged across the 500 repetitions.
For both, the direct computation approach described in Sec. 2.B and numerical simulation studies in this section, an additional scaling factor of (1000/μwater)2, based on the definition of CT number and the general rule of error propagation, was multiplied to the 2D NPS to convert its units to [HU2 mm2].
2.D. Validation of the generalized local NPS model in physical phantom studies using a clinical MDCT scanner
To further validate the local NPS model proposed in this paper, a 64-slice diagnostic MDCT system (Discovery CT750 HD, GE Healthcare, Waukesha, WI) was used to acquire CT images of two phantoms shown in Fig. 6. A 5 × 5 cm2 ROI located at the center of the 39 cm phantom was used to represent ROI A, and another peripheral ROI inside this phantom was used to represent ROI B. ROIs C and D were represented by a 5 × 5 cm2 region centered inside the 13 cm diameter phantom which was off-centered vertically or horizontally in each of the cases. Two different bowtie filters (large and small as referenced by the vendor) were used; they were selected by switching the scan field-of-view (SFOV) to “Large Body” and “Pediatric Head,” respectively.
For each phantom setup and bowtie filter size, 50 repeated CT acquisitions were performed with the following protocol: axial scan mode, 20 mm detector collimation, 120 kV, 240 mAs, “Standard” reconstruction kernel, 32 cm display field of view (DFOV), and 0.625 mm slice thickness.
2.E. Qualitative assessment of the impact of anisotropic NPS on image feature conspicuity
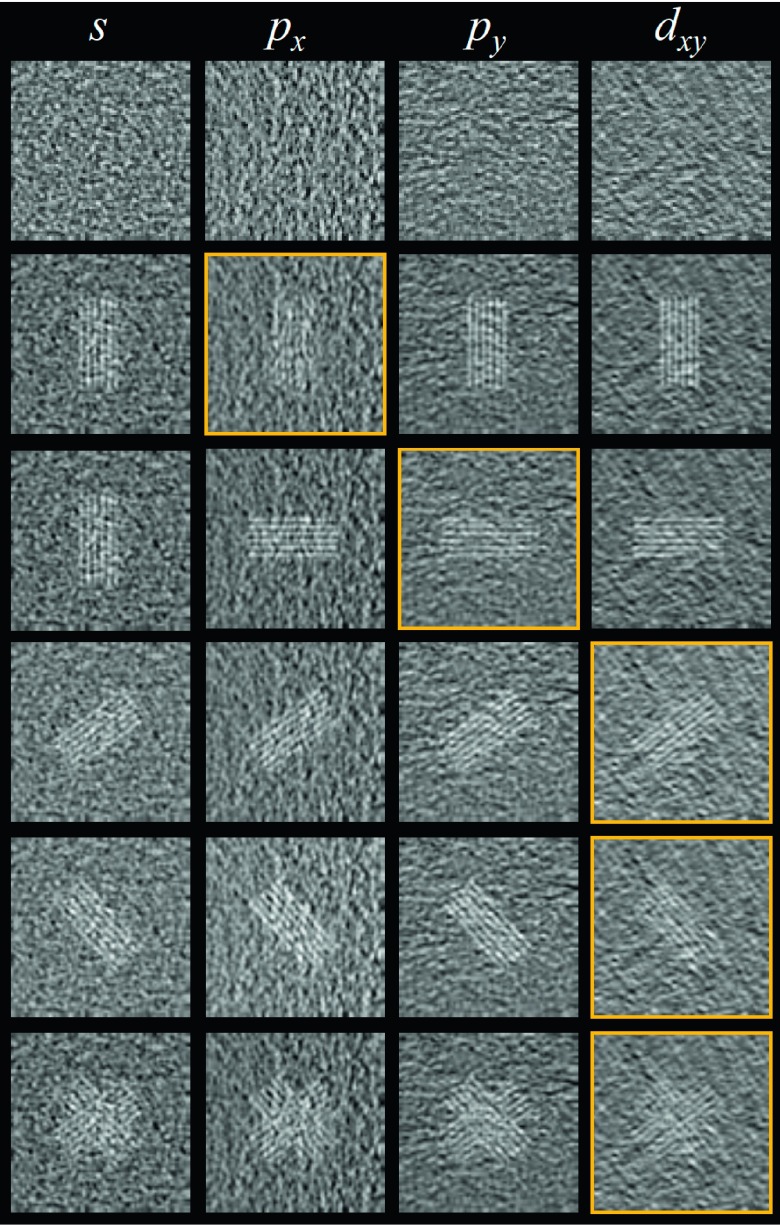
Following the 2D local NPS measurements, a qualitative assessment of the impact of noise texture on feature conspicuity was performed. For each representative NPS symmetry, noise-only images were obtained from the physical phantom experiments. The features considered in this study consisted of individual simulated bar patterns oriented at a variety of angles. Before adding these simulated bar patterns to each type of noise background, the DC value was subtracted from each of the noise-only images so that they had a zero mean; then, each noise-only image was normalized by its own standard deviation to remove the dependence on noise magnitude and assess only the impact of noise texture on the visibility of the simulated bar patterns. The bar patterns were located in the center of each ROI; they were composed of 6 or 12 bars of 2.5 cm length and a pattern frequency of 5 line pairs per cm; their contrast was set to 25% of the maximum values present on the noise backgrounds, and they were blurred by a 2D averaging filter with a neighborhood of 4 × 4 pixels.
3. RESULTS
3.A. Results of local NPS from three approaches: direct computation, numerical simulation studies, and experimental phantom studies
In this section, the local NPSs obtained with three different approaches are compared against one another to validate the proposed generalized local NPS model.
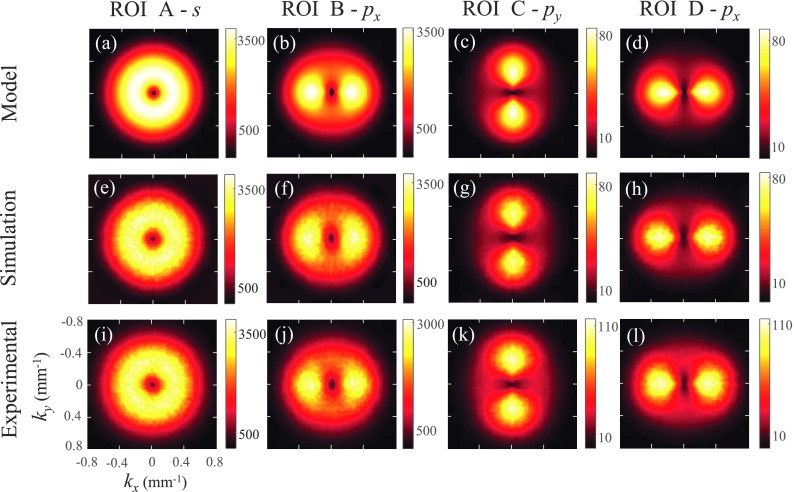
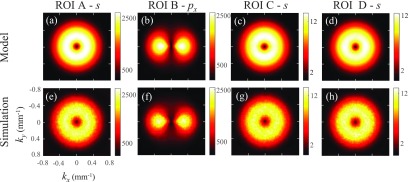
Figure 7 shows the NPS results for all of the four ROIs obtained with the large bowtie filter, with results from the direct computation approach, numerical simulations, and physical phantom experiments displayed side-by-side for comparison. For all four ROIs, the simulation and experimental results matched closely with those obtained with the generalized local NPS model. For convenience, the atomic spectral symbols s, p, and d were used to describe the symmetry of the 2D NPS; therefore, a circularly symmetric NPS would be labeled “s-wave” symmetric, a horizontal or vertical “dumbbell” shaped NPS would be labeled as “px-wave” or “py-wave” symmetric, and a “cloverleaf” shaped NPS would be labeled as “dxy-wave” symmetric.
FIG. 7.
NPS obtained with a large bowtie filter. Top row: model results; middle row: numerical simulation results; bottom row: experimental results. The units of the numbers on the scale bar are [HU2 mm2]. Positions of ROI A, B, C, and D are shown in Figs. 5 and 6.
The NPS of ROI A presents s-wave symmetry as expected. For ROI B, located in the periphery of the 39 cm phantom, its NPS showed px-wave symmetry, which corresponds to a structural noise pattern along the vertical direction. For ROI C, located in an off-centered object, its NPS presented py-wave symmetry, which corresponds to a structural noise pattern along the horizontal direction. As opposed to ROI C, the NPS from ROI D presented px-wave symmetry, corresponding to a strong vertical noise texture.
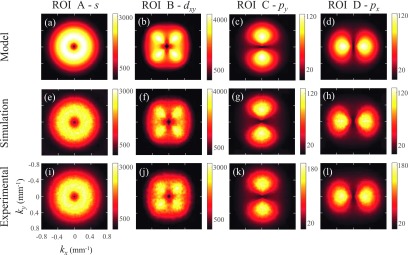
Figure 8 shows the NPS results obtained with the small bowtie filter. The NPS of ROI A continued to have s-wave symmetry, indicating that as long as a uniform cylindrical object is placed at the isocenter, the local NPS of the central region will always be circularly symmetric. In contrast, the NPS of ROI B demonstrated a peculiar dxy-wave symmetry with increased noise power along the two diagonal directions. As explained in Fig. 9, this unusual NPS shape was caused by the mismatch between the bowtie filter and the object, and a large similar attenuation at specific diagonally opposed projection view angles. For ROI C, the NPS was py-wave symmetric with stronger angular anisotropy compared with the results obtained with the large bowtie in Fig. 7. Analogous to the large bowtie scenario, the NPS resulting from ROI D was very similar to that of ROI C but rotated by 90°, therefore corresponding to px-wave symmetry.
FIG. 8.
NPS obtained with a small bowtie filter. Top row: model results; middle row: numerical simulation results; bottom row: experimental results. The units of the numbers on the scale bar are [HU2 mm2].
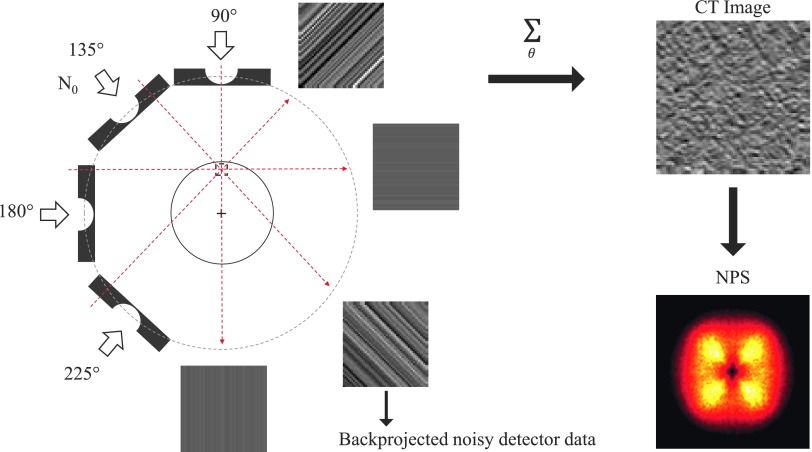
FIG. 9.
Schematic illustration of why a unique dxy-wave symmetry was observed in the NPS of ROI B: when a small bowtie filter was used during the scan of a large object, the amount of x-ray attenuation experienced by x-rays intersecting with ROI B strongly depends on the projection angle θ. When θ = 135∘ or 225∘, the combined attenuation from the bowtie filter and the object reaches its maximum; therefore, when the corresponding noisy detector data are backprojected during the FBP reconstruction, diagonal noise streaks form and dominate the 2D NPS of the final CT image.
Figure 10 shows the NPS results obtained without a bowtie filter. As expected, when performing fan-to-parallel beam rebinning, the NPS of ROI A, ROI C, and ROI D presented s-wave symmetry, indicating that in the absence of a bowtie filter, the NPS of CT measured in the center of a circular uniform phantom is always circularly symmetric. For ROI B, located in the periphery of the 39 cm phantom, however, its px-wave symmetric NPS demonstrated a narrowed horizontal dumbbell shape due to decreased x-ray attenuation through ROI B along the horizontal direction. Since the bowtie filter could not be removed from the clinical MDCT scanner, physical phantom experiments were not included in the comparison in Fig. 10.
FIG. 10.
NPS obtained without a bowtie filter. Top row: model results; bottom row: numerical simulations. The units of the numbers on the scale bar are [HU2 mm2].
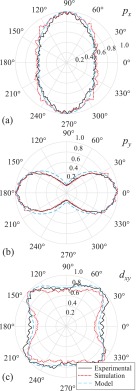
Figures 11 and 12 display the level of agreement between the NPSs obtained with the generalized local NPS model, numerical simulations, and physical phantom experiments. In Fig. 11, the similarity in the shape of the NPSs is highlighted by plotting the normalized magnitude of the 2D NPS at a given frequency of 0.26 mm−1 as a function of θ. Figure 11(a) corresponds to the case of ROI B and large bowtie filter; its polar plot displays a normalized magnitude that oscillates approximately between 0.5 and 1.0 and has a period of 180° with its peak amplitude around the projection view angle of 90°. This makes perfect sense since, for ROI B, the noisiest projections were the ones in the vertical direction, resulting in a px-wave symmetric NPS (Fig. 7). In stark contrast, Fig. 11(b), corresponding to ROI C and small bowtie, has its peak amplitude around projection view angles of 0° and 180° and oscillates between 0.2 and 1.0. This large modulation indicates the stronger NPS angular anisotropy of this scenario and agrees with the py-wave symmetry of the NPS (Fig. 8), obtained due to noisy projections in the horizontal direction. More interestingly, ROI B with small bowtie filter, Fig. 11(c), shows what seems to be a period of nearly 90°, indicating that the largest attenuation seen in the scan came from specific diagonally opposed projection views resulting in a dxy-wave symmetric NPS.
FIG. 11.
Polar plots of the 2D NPS values corresponding to the radial frequency of 0.26 mm−1 as a function of θ. Each plot was normalized by its peak value. (a) ROI B with large bowtie; (b) ROI C with small bowtie; (c) ROI B with small bowtie.
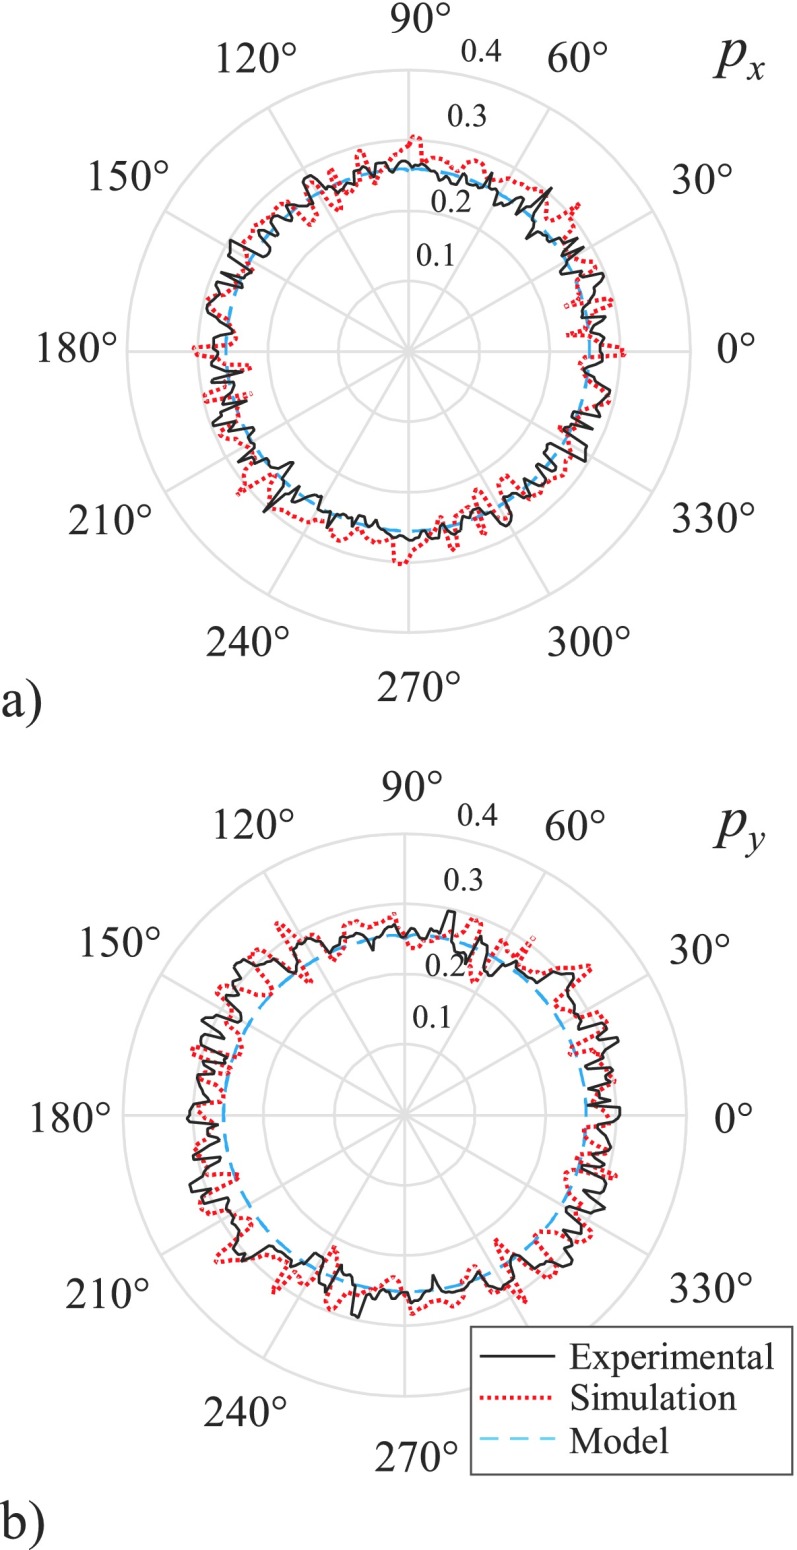
FIG. 12.
Polar plots of the frequency corresponding to the maximum amplitude of each radial profile of the 2D NPS. (a) ROI B with large bowtie; (b) ROI C with small bowtie. The units of the frequency are [mm−1].
The polar plots in Fig. 12 summarize the frequency corresponding to the peak of each radial profile of the 2D NPS; Figs. 12(a) and 12(b) correspond to the case of ROI B with large bowtie and ROI C with small bowtie, respectively. Besides the evident strong agreement between the results obtained from the direct computation approach, numerical simulations, and phantom experiments, these plots support the hypothesis that the bowtie filter, image object, and ROI location do not influence the relative correlation of projection noise. Even though the object and the bowtie filter differ and both cause angular anisotropy on the NPS magnitude, the peak frequency at each angle is constant despite the intrinsic noise from simulated and experimental data, as it is seen in both plots, (a) and (b).
3.B. Qualitative assessment of the impact of anisotropic NPS on image feature conspicuity
Figure 13 shows the representative noise-only images obtained from the physical phantom experiments; these images were acquired using the small bowtie filter and correspond to noise textures of specific NPS symmetries found in Fig. 8. In addition, as described on Sec. 2.E, simulated bar patterns with different orientations were added to these noise-only images to assess the impact of noise texture on feature conspicuity. The first column of Fig. 13 corresponds to ROI A, which generated an isotropic noise texture and NPS with the s-wave symmetry. The second column shows images of ROI D; it demonstrates a structural noise pattern along the vertical direction, which corresponds to the NPS with the px-wave symmetry. The third column shows images of ROI C; it demonstrates a structural noise pattern along the horizontal direction, which corresponds to the NPS with the py-wave symmetry. The fourth column shows images of ROI B; it demonstrates a structural noise pattern along the two diagonal directions, which corresponds to the NPS with dxy-wave symmetry. For a given orientation of the bar pattern, its visibility is strongly dependent on the noise texture. For example, the horizontal bar pattern is less discernible in the horizontal noise background; similarly, the individual and double diagonal bar patterns are less conspicuous under the diagonal noise texture.
FIG. 13.
Impact of noise texture on the conspicuity of bar patterns. From left to right, each column corresponds to images with isotropic, vertical, horizontal, and diagonal noise textures, respectively. These noise textures correspond to NPSs with s, px, py, and dxy-wave symmetry, respectively. The top row shows noise-only images; images in the second, third, fourth, and fifth row contain a bar pattern oriented along the vertical, horizontal, right diagonal, and left diagonal direction, respectively; the bottom row contains two orthogonal diagonal bar patterns. The golden squares highlight the cases in which we believe bar pattern visibility was compromised the most. (See color online version.)
4. DISCUSSION
When the NPS of CT was initially modeled several decades ago, it was assumed to be circularly symmetric. Without taking the image object and the ROI location into account, these classical NPS models have achieved excellent agreement with experimental results. This is because, in practice, the NPS has almost always been measured in the central region of a circularly symmetric phantom placed at the isocenter of the CT scanner (e.g., ROI A). In this case, the magnitude of the 1D NPS for each projection view angle is the same; therefore, the 2D NPS of CT images is circularly symmetric, even if the bowtie filter does not perfectly match the phantom used to measure the NPS. In some studies, the NPS has been measured by shifting the ROI across different regions in the phantom; since the final NPS is calculated from the average of these ROIs, the possible NPS anisotropy introduced by some peripheral ROIs is canceled or averaged out, leading to an overall circularly symmetric NPS.
If the NPS is defined and measured within a specific local region, then the impact of object position, ROI location, and bowtie filter will be reflected in the final NPS results. For a peripheral ROI within a centered object (ROI B), its NPS is generally not circularly symmetric unless the bowtie filter perfectly matches the image object. For an ROI inside an isolated and off-centered object (ROI C), its NPS is not circularly symmetric, as long as a bowtie filter is used. Even when the ROI location is matched, ROI B and C always lead to NPSs with different symmetries, no matter whether the bowtie filter is used or not. Therefore, the NPS of CT should not be characterized purely as a function of the ROI location without taking the object position and the bowtie filter into account. For clinical tasks that have to be performed at off-centered positions, the corresponding NPS should not be represented by the NPS measured using a centered object.
The bowtie filter and object position directly impact the noise magnitude of the projection data (). However, they have negligible impact on the relative spatial correlation condition of the projection noise, namely, the NNPS(k), which is primarily determined by the CT detector and data preprocessing systems. As a result, the change in the 2D NPS symmetry is provoked by the frequency-independent term α(θ), while other frequency-dependent terms in Eq. (1) are preserved for different combinations of bowtie filter and image object. This feature has been confirmed by the plot of NPS peak frequency vs θ in Fig. 12.
The generalized local NPS model developed in this work is based on fan-to-parallel beam rebinning instead of direct fan beam reconstruction. The level of agreement between the model and experimental results supports the validity of this assumption. It suggests that for real MDCT systems, the use of fan-to-parallel beam rebinning decreases the impact of the fan beam effects, particularly the fan beam weighting factor, on the NPS of the reconstructed CT image. The slight differences between the NPSs from the direct computation approach, numerical simulations, and experimental phantom studies were possibly due to lack of scatter simulation and differences between the simulated and actual CT systems, especially the bowtie filter. Another possible cause of discrepancy could be the assumption of a monochromatic beam and perfect detector response, which are not equivalent to the actual beam conditioning and detector response of the real CT system.
The phantoms used in this work were circularly symmetric objects, which enabled a clearer understanding of the interplay between the bowtie filter and image object off-centering. However, the axial cross section of a human body is usually more like an oval than a circle; if a different assumption is made, the symmetry of the NPS will change. For example, if an ellipse with its major axis perpendicular to the vertical direction is used, even if the ROI is placed in the center of a centered object and no bowtie filter is used, the NPS will not be circularly symmetric; instead, it will have a py-wave symmetry due to noisier projection data acquired along the horizontal directions. This effect is fully captured by the proposed generalized local NPS model through Eq. (3), predicting correctly the corresponding 2D NPS. Likewise, in the case of a more realistic inhomogeneous image object, the shape of the NPS could still be predicted by the proposed model, as long as the x-ray attenuation properties of the image object are provided.
One important factor that was not included in this work was tube current modulation, which essentially balances the average noise magnitude of the projection data across different view angles. For a homogeneous cylindrical object, TCM should not have any impact on the NPS, as long as the object is centered. If the object is off-centered, there would be certain mismatch between the bowtie filter and the object, and in this scenario, TCM may come into play to balance the number of transmitted photons. In principle, TCM should promote the 2D NPS of CT to be circularly symmetric by balancing the noise magnitude of the projection data across θ. However, the extent to which TCM could boost the NPS symmetry is worthy of future investigation.
This work studied the local 2D NPS of a clinical MDCT system that uses FBP for CT image reconstruction. This type of CT system is usually linear or quasilinear; therefore, the results should not be directly generalized to nonlinear CT systems, such as those using iterative reconstruction (IR) algorithms. It has been found that the use of the nonlinear IR algorithms may introduce nonconventional effects on noise magnitude, noise correlation, and as a consequence, the NPS.28,38,39 It would be interesting to study the joint impact of IR, bowtie filter, object off-centering, and ROI location on the NPS in the future, although it is out of the scope of this paper which focuses strictly on FBP-based linear CT systems.
Since the main focus of this work is the symmetry of the 2D NPS, only a single reconstruction kernel–the standard kernel provided by the CT system–was used throughout the study. This kernel is relatively low-pass, which reduces most of the high frequency noise power (e.g., the dark outermost regions in the 2D NPS shown in Figs. 7 and 8). Therefore, it would be interesting to investigate how the NPS symmetry is affected by different reconstruction kernels with an off-centered object, especially for those high frequency reconstruction kernels. It would also be important to analyze the corresponding impact on task-based detectability in a quantitative fashion. This is a current subject of research in the authors’ group, and results will be reported in a different paper.
5. CONCLUSION
The 2D NPS of clinical MDCT systems is strongly influenced by the use of the bowtie filter and how well it matches with the image object. For these systems, when the symmetry of the NPS deviates from the classical s-wave symmetry, it is usually caused by the mismatch between the bowtie filter and the image object rather than the divergent nature of the x-ray beam. In particular, when the image object is severely off-centered, the misalignment between the bowtie filter and the image object will create a strongly anisotropic NPS, which corresponds to a highly directional noise texture. Even if the image object is perfectly centered, the possible mismatch between the design of the bowtie filter and the actual image object can create a strong anisotropic local NPS at the peripheral regions of the object. Analysis of NPS and other noise-dependent objective performance metrics such as NEQ and task-based detectability index should take not only the ROI location but also the bowtie filter and object position into account.
ACKNOWLEDGMENTS
This work is partially supported by an NIH Grant No. R01CA169331 and GE Healthcare.
CONFLICT OF INTEREST DISCLOSURE
The authors have no COI to report.
REFERENCES
- 1.Riederer S. J., Pelc N. J., and Chesler D. A., “The noise power spectrum in computed x-ray tomograhy,” Phys. Med. Biol. 23, 446–454 (1978). 10.1088/0031-9155/23/3/008 [DOI] [PubMed] [Google Scholar]
- 2.Wagner R. F., Brown D. G., and Pastel M. S., “Application of information theory to the assessment of computed tomography,” Med. Phys. 6, 83–94 (1979). 10.1118/1.594559 [DOI] [PubMed] [Google Scholar]
- 3.Hanson K., “Detectability in computed tomographic images,” Med. Phys. 6, 441–451 (1979). 10.1118/1.594534 [DOI] [PubMed] [Google Scholar]
- 4.Wagner R. F. and Brown D. G., “Unified SNR analysis of medical imaging systems,” Phys. Med. Biol. 30, 489–518 (1985). 10.1088/0031-9155/30/6/001 [DOI] [PMC free article] [PubMed] [Google Scholar]
- 5.Kijewski M. F. and Judy P. F., “The noise power spectrum of CT images,” Phys. Med. Biol. 32, 565–575 (1987). 10.1088/0031-9155/32/5/003 [DOI] [PubMed] [Google Scholar]
- 6.Tward D. and Siewerdsen J., “Cascaded systems analysis of the 3D noise transfer characteristics of flat-panel cone-beam CT,” Med. Phys. 35, 5510–5529 (2008). 10.1118/1.3002414 [DOI] [PMC free article] [PubMed] [Google Scholar]
- 7.Tward D. J. and Siewerdsen J. H., “Noise aliasing and the 3D NEQ of flat-panel cone-beam CT: Effect of 2D/3D apertures and sampling,” Med. Phys. 36, 3830–3843 (2009). 10.1118/1.3166933 [DOI] [PMC free article] [PubMed] [Google Scholar]
- 8.Gang G. J., Tward D. J., Lee J., and Siewerdsen J. H., “Anatomical background and generalized detectability in tomosynthesis and cone-beam CT,” Med. Phys. 37, 1948–1965 (2010). 10.1118/1.3352586 [DOI] [PMC free article] [PubMed] [Google Scholar]
- 9.Gang G. J., Lee J., Stayman J. W., Tward D. J., Zbijewski W., Prince J. L., and Siewerdsen J. H., “Analysis of Fourier-domain task-based detectability index in tomosynthesis and cone-beam CT in relation to human observer performance,” Med. Phys. 38, 1754–1768 (2011). 10.1118/1.3560428 [DOI] [PMC free article] [PubMed] [Google Scholar]
- 10.Yu L., Shiung M., Jondal D., and McCollough C. H., “Development and validation of a practical lower-dose-simulation tool for optimizing computed tomography scan protocols,” J. Comput. Assisted Tomogr. 36, 477–487 (2012). 10.1097/RCT.0b013e318258e891 [DOI] [PubMed] [Google Scholar]
- 11.Li K., Bevins N., Zambelli J., and Chen G.-H., “Fundamental relationship between the noise properties of grating-based differential phase contrast CT and absorption CT: Theoretical framework using a cascaded system model and experimental validation,” Med. Phys. 40, 021908 (15pp.) (2013). 10.1118/1.4788647 [DOI] [PMC free article] [PubMed] [Google Scholar]
- 12.Li K., Garrett J., and Chen G.-H., “Correlation between human observer performance and model observer performance in differential phase contrast CT,” Med. Phys. 40, 111905 (14pp.) (2013). 10.1118/1.4822576 [DOI] [PubMed] [Google Scholar]
- 13.Gang G. J., Stayman J. W., Zbijewski W., and Siewerdsen J. H., “Task-based detectability in CT image reconstruction by filtered backprojection and penalized likelihood estimation,” Med. Phys. 41, 081902 (19pp.) (2014). 10.1118/1.4883816 [DOI] [PMC free article] [PubMed] [Google Scholar]
- 14.Samei E. and Richard S., “Assessment of the dose reduction potential of a model-based iterative reconstruction algorithm using a task-based performance metrology,” Med. Phys. 42, 314–323 (2015). 10.1118/1.4903899 [DOI] [PubMed] [Google Scholar]
- 15.Solomon J., Wilson J., and Samei E., “Characteristic image quality of a third generation dual-source MDCT scanner: Noise, resolution, and detectability,” Med. Phys. 42, 4941–4953 (2015). 10.1118/1.4923172 [DOI] [PubMed] [Google Scholar]
- 16.Siewerdsen J. H., Cunningham I. A., and Jaffray D. A., “A framework for noise-power spectrum analysis of multidimensional images,” Med. Phys. 29, 2655–2671 (2002). 10.1118/1.1513158 [DOI] [PubMed] [Google Scholar]
- 17.Boedeker K. L. and McNitt-Gray M. F., “Application of the noise power spectrum in modern diagnostic MDCT: Part II. Noise power spectra and signal to noise,” Phys. Med. Biol. 52, 4047–4061 (2007). 10.1088/0031-9155/52/14/003 [DOI] [PubMed] [Google Scholar]
- 18.Yang K., Kwan A. L., Huang S., Packard N. J., and Boone J. M., “Noise power properties of a cone-beam CT system for breast cancer detection,” Med. Phys. 35, 5317–5327 (2008). 10.1118/1.3002411 [DOI] [PMC free article] [PubMed] [Google Scholar]
- 19.Wunderlich A. and Noo F., “Image covariance and lesion detectability in direct fan-beam x-ray computed tomography,” Phys. Med. Biol. 53, 2471–2493 (2008). 10.1088/0031-9155/53/10/002 [DOI] [PMC free article] [PubMed] [Google Scholar]
- 20.Baek J. and Pelc N. J., “The noise power spectrum in CT with direct fan beam reconstruction,” Med. Phys. 37, 2074–2081 (2010). 10.1118/1.3378673 [DOI] [PMC free article] [PubMed] [Google Scholar]
- 21.Baek J. and Pelc N. J., “Local and global 3D noise power spectrum in cone-beam CT system with FDK reconstruction,” Med. Phys. 38, 2122–2131 (2011). 10.1118/1.3556590 [DOI] [PMC free article] [PubMed] [Google Scholar]
- 22.Baek J. and Pelc N. J., “Effect of detector lag on CT noise power spectra,” Med. Phys. 38, 2995–3005 (2011). 10.1118/1.3589135 [DOI] [PMC free article] [PubMed] [Google Scholar]
- 23.Köhler T., Engel K. J., and Roessl E., “Noise properties of grating-based x-ray phase contrast computed tomography,” Med. Phys. 38, S106–S116 (2011). 10.1118/1.3532396 [DOI] [PubMed] [Google Scholar]
- 24.Tang X., Yang Y., and Tang S., “Characterization of imaging performance in differential phase contrast CT compared with the conventional CT-noise power spectrum NPS(k),” Med. Phys. 38, 4386–4395 (2011). 10.1118/1.3602071 [DOI] [PMC free article] [PubMed] [Google Scholar]
- 25.Yu L., Vrieze T., Leng S., and McCollough C. H., “Measurement and analysis of 3D noise power spectrum of an iterative reconstruction method in CT,” in Scientific Assembly and Annual Meeting (Radiological Society of North America, Chicago, IL, 2012). [Google Scholar]
- 26.Chen B., Richard S., and Samei E., “Relevance of MTF and NPS in quantitative CT: Towards developing a predictable model of quantitative performance,” Proc. SPIE 8313, 83132O (2012). 10.1117/12.913219 [DOI] [Google Scholar]
- 27.Li Z., Yu L., Trzasko J. D., Lake D. S., Blezek D. J., Fletcher J. G., McCollough C. H., and Manduca A., “Adaptive nonlocal means filtering based on local noise level for CT denoising,” Med. Phys. 41, 011908 (16pp.) (2014). 10.1118/1.4851635 [DOI] [PubMed] [Google Scholar]
- 28.Li K., Tang J., and Chen G.-H., “Statistical model based iterative reconstruction (MBIR) in clinical CT systems: Experimental assessment of noise performance,” Med. Phys. 41, 041906 (15pp.) (2014). 10.1118/1.4867863 [DOI] [PMC free article] [PubMed] [Google Scholar]
- 29.Chen B., Christianson O., Wilson J. M., and Samei E., “Assessment of volumetric noise and resolution performance for linear and nonlinear CT reconstruction methods,” Med. Phys. 41, 071909 (12pp.) (2014). 10.1118/1.4881519 [DOI] [PubMed] [Google Scholar]
- 30.Zeng R., Gavrielides M. A., Petrick N., Sahiner B., Li Q., and Myers K. J., “Estimating local noise power spectrum from a few FBP-reconstructed CT scans,” Med. Phys. 43, 568–582 (2016). 10.1118/1.4939061 [DOI] [PubMed] [Google Scholar]
- 31.Walters R. and Carlson R., “Computerized tomographic scanner with shaped radiation filter,” U.S. patent 4,288,695 (September 8, 1981).
- 32.Seeram E., Computed Tomography: Physical Principles, Clinical Applications, and Quality Control (Saunders, Philadelphia, PA, 1994). [Google Scholar]
- 33.Hsieh J., Computed Tomography: Principles, Design, Artifacts, and Recent Advances (SPIE, Bellingham, 2003). [Google Scholar]
- 34.Toth T., Ge Z., and Daly M. P., “The influence of patient centering on CT dose and image noise,” Med. Phys. 34, 3093–3101 (2007). 10.1118/1.2748113 [DOI] [PubMed] [Google Scholar]
- 35.Funama Y., Taguchi K., Awai K., Sakabe D., Shimamura M., and Yasuyuki Y., “Image noise and radiation dose using an automatic tube current modulation technique at 64-detector computed tomography: Effect of off-center patient position, bowtie filter type and scan projection radiograph,” J. Comput. Assisted Tomogr. 33, 973–977 (2009). 10.1097/RCT.0b013e31819d6f6f [DOI] [PubMed] [Google Scholar]
- 36.Perisinakis K., Seimenis I., Tzedakis A., Papadakis A. E., and Damilakis J., “The effect of head size/shape, miscentering, and bowtie filter on peak patient tissue doses from modern brain perfusion 256-slice CT: How can we minimize the risk for deterministic effects?,” Med. Phys. 40, 011911 (8pp.) (2013). 10.1118/1.4773042 [DOI] [PubMed] [Google Scholar]
- 37.Hubell J. and Seltzer S., “Tables of x-ray mass attenuation coefficients and mass energy-absorption coefficients 1 keV to 20 MeV for elements z = 1 to 92 and 48 additional substances of dosimetric interest,” NIST Technical Report No. 51812148 (Ionizing Radiation Division, National Institute of Standards and Technology, Gaithersburg, MD,1995). [Google Scholar]
- 38.Gomez-Cardona D., Li K., Lubner M. G., Pickhardt P. J., and Chen G.-H., “Noise performance studies of model-based iterative reconstruction (MBIR) as a function of kV, mA and exposure level: Impact on radiation dose reduction and image quality,” Proc. SPIE 9412, 941238 (2015). 10.1117/12.2082334 [DOI] [Google Scholar]
- 39.Gomez-Cardona D., Li K., Hsieh J., Lubner M. G., Pickhardt P. J., and Chen G.-H., “Can conclusions drawn from phantom-based image noise assessments be generalized to in vivo studies for the nonlinear model-based iterative reconstruction method?,” Med. Phys. 43, 687–695 (2016). 10.1118/1.4939257 [DOI] [PMC free article] [PubMed] [Google Scholar]


