Abstract
Brain imaging methods allow a non-invasive assessment of both structural and functional connectivity. However, the mechanism of how functional connectivity arises in a structured network of interacting neural populations is as yet poorly understood. Here we use a modeling approach to explore the way in which functional correlations arise from underlying structural connections taking into account inhomogeneities in the interactions between the brain regions of interest. The local dynamics of a neural population is assumed to be of phase-oscillator type. The considered structural connectivity patterns describe long-range anatomical connections between interacting neural elements. We find a dependence of the simulated functional connectivity patterns on the parameters governing the dynamics. We calculate graph-theoretic measures of the functional network topology obtained from numerical simulations. The effect of structural inhomogeneities in the coupling term on the observed network state is quantified by examining the relation between simulated and empirical functional connectivity. Importantly, we show that simulated and empirical functional connectivity agree for a narrow range of coupling strengths. We conclude that identification of functional connectivity during rest requires an analysis of the network dynamics.
Keywords: Functional connectivity, Brain dynamics model, Graph theory, Structural connectivity
Introduction
Complex but highly structured patterns of correlated fluctuations have been observed in spontaneous/task-free brain activity measured by brain imaging techniques in healthy (Biswal et al. 1995; Damoiseaux et al. 2006) and diseased brain (Zhou et al. 2010). It has been shown that dynamical patterns of these correlations are shaped by a complex interplay between underlying anatomical connections and ongoing activity of the interacting regions (Deco et al. 2011; Ghosh et al. 2008). Thus, allowing for long-distance co-activity of functionally segregated brain areas and forming the basis of cognitive functions (Werner 2009). However, the exact mechanisms contributing to the long-range cortical interactions still remain largely unknown. It has been suggested that, together with the collective effects governed by the network properties, inter-regional distances and indirect connections may also play significant roles. Recent studies on large-scale functional connectivity have begun to demonstrate the role of dynamic reconfiguration of resting-state functional connections over multiple time scales (Hansen et al. 2015; Hutchison et al. 2013) and of such reconfiguration when brain moves between task-free and task-dependent state (Dimitriadis et al. 2015).
Theoretical models of the resting-brain dynamics allow for exploration of these mechanisms, with the focus on the relationship between large-scale anatomical connectivity and either local or global dynamics (see Cabral et al. (2014) for a recent review). The common approach of these models is to consider the brain as a complex dynamical system operating in so called metastable regime (Shanahan 2010; Tognoli and Kelso 2014). The key properties of the brain metastability is flexible network dynamics, which allow for synchronization patterns that change over time.
In this paper, we utilize these approaches and additionally introduce anatomical inhomogeneities into cortical interactions. Thus, making our model physiologically more plausible, we explore conditions that allow long-distance functional correlations.
Modeling functional connectivity
We use structural connectivity derived from diffusion weighted Magnetic Resonance Imaging (dMRI) data (Iturria-Medina et al. 2008) to numerically simulate resting-state functional correlations between brain areas. To closely match empirical findings, a blood-oxygen-level-dependent (BOLD) fMRI signal is inferred from the simulated activity of the node corresponding to the respective brain region (Cabral et al. 2011, 2014; Deco et al. 2009; Ghosh et al. 2008). This is done using a Balloon-Windkessel hemodynamic model (Friston et al. 2000; Seth et al. 2013), which is a widely used model of neurovascular coupling, and has been implemented in existing models of large-scale brain functional connectivity (Cabral et al. 2011; Ghosh et al. 2008; Honey et al. 2009). We extend this modeling approach by utilizing the following Kuramoto-type equation, whose neurobiological implications are well established (Breakspear et al. 2010; Cabral et al. 2011), to simulate the dynamics of brain regions:
| 1 |
where describes the state of the brain region (network node) i over time, N is the number of regions considered (), and c is a sufficiently strong global coupling chosen from a range of values to (i) engage phase interactions (Izhikevich and Kuramoto 2006; Nicosia et al. 2013; Strogatz 2000)) and (ii) influence correlated amplitude fluctuations at lower frequencies (Cabral et al. 2014; Vuksanović and Hövel 2014). The parameter is the natural frequency of the ith oscillator, set in the frequency range (drawn randomly from a Gaussian distribution with the mean ) to facilitate the emergence of the desired dynamical network state (Cabral et al. 2014, 2011; Vuksanović and Hövel 2014) and relate local node dynamics to the neurophysiology (Leopold et al. 2003; Logothetis et al. 2001).
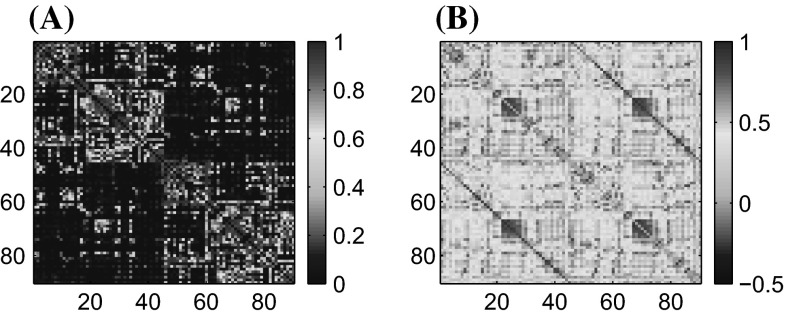
The connectivity matrix, , determining the coupling topology, represents a structural connectivity matrix estimated from dMRI data, according to the procedure described in Iturria-Medina et al. (2008). The procedure maps out probabilities for the presence of the direct neural connections between all pairs of the 90 considered anatomical regions of interest. We will therefore refer to this map as the anatomical connectivity (AC) map or matrix (Iturria-Medina et al. 2008), whose weighted entries ranges from 0 to 1 (Fig. 1A). Structural inhomogeneities are introduced in the coupling term by distance-dependent phase offsets . The element makes network interactions biologically more plausible translating neural signal transmission delays into corresponding phase offsets (Breakspear et al. 2010), thus preventing full synchronization of the network (Keane et al. 2012; Nicosia et al. 2013). Heterogeneous phase-offsets are scaled into interval according to the distances between the brain regions of interests. We aim to explore synchrony between neural populations that arises as a result of these inhomogeneities in the coupling term1.
Fig. 1.
A Anatomical and B functional connectivity obtained from DTI and fMRI data, respectively. The connectivity analysis is performed on the 90 brain regions according to the list in Table 1
We quantify the degree of network synchrony using order parameter R, defined in the following way:
| 2 |
Extreme values of the order parameter, and , indicate the network’s complete synchrony or asynchrony, respectively. Values between 0 and 1 represent network’s transition from less to more synchronized state, i.e. network metastable regime (Shanahan 2010).
Table 1.
Cortical and sub-cortical regions as defined in the automated anatomic labeling (AAL) template image
| Index R/L | Anatomical description | Label |
|---|---|---|
| 1/46 | Precentral | PRE |
| 2/47 | Frontal Sup | F1 |
| 3/48 | Frontal Sup Orb | F10 |
| 4/49 | Frontal Mid | F2 |
| 5/50 | Frontal Mid Orb | F20 |
| 6/51 | Frontal Inf Oper | F30P |
| 7/52 | Frontal Inf Tri | F3T |
| 8/53 | Frontal Inf Orb | F30 |
| 9/54 | Rolandic Oper | RO |
| 10/55 | Supp Motor Area | SMA |
| 11/56 | Olflactory | OC |
| 12/57 | Frontal Sup Medial | F1M |
| 13/58 | Frontal Mid Orb | SMG |
| 14/59 | Gyrus Rectus | GR |
| 15/60 | Insula | IN |
| 16/61 | Cingulum Ant | ACIN |
| 17/62 | Cingulum Mid | MCIN |
| 18/63 | Cingulum Post | PCIN |
| 19/64 | Hippocampus | HIP |
| 20/65 | ParaHippocampal | PHIP |
| 21/66 | Amygdala | AMYG |
| 22/67 | Calcarine | V1 |
| 23/68 | Cuneus | Q |
| 24/69 | Lingual | LING |
| 25/70 | Occipital Sup | O1 |
| 26/71 | Occipital Mid | O2 |
| 27/72 | Occipital Inf | O3 |
| 28/73 | Fusiform | FUSI |
| 29/74 | Postcentral | POST |
| 30/75 | Parietal Sup | P1 |
| 31/76 | Parietal Inf | P2 |
| 32/77 | Supra Marginal Gyrus | SMG |
| 33/78 | Angular | AG |
| 34/79 | Precuneus | PQ |
| 35/80 | Paracentral Lobule | PCL |
| 36/81 | Caudate | CAM |
| 37/82 | Putamen | PUT |
| 38/83 | Pallidum | PAL |
| 39/84 | Thalamus | THA |
| 40/85 | Heschi | HES |
| 41/86 | Temporal Sup | T1 |
| 42/87 | Temporal Pole sup | T1P |
| 43/88 | Temporal Mid | T2 |
| 44/89 | Temporal Pole Mid | T2P |
| 45/90 | Temporal Inf | T3 |
Indexes from 1–45 indicate right (R) and 46–90 left (L) hemisphere regions
Characterization of brain networks
Simulated functional connectivity
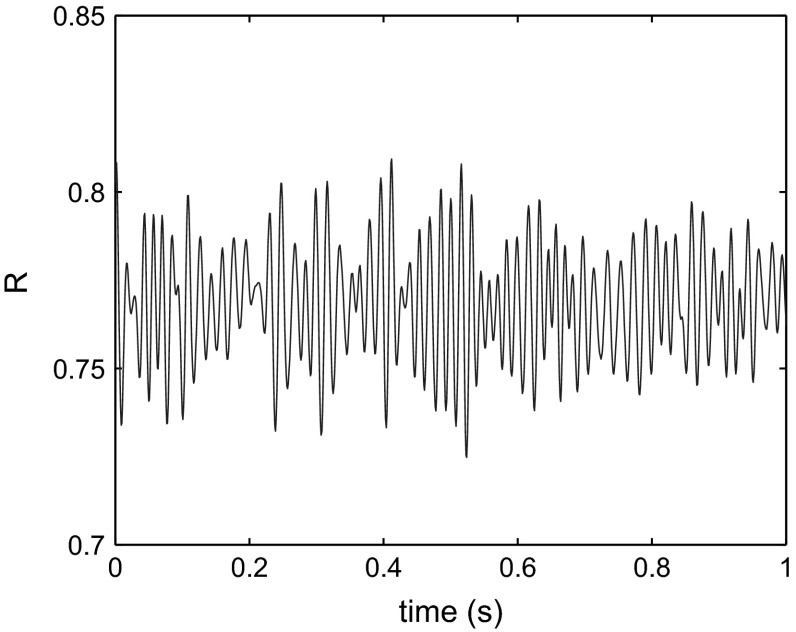
For assessment of the simulated functional connectivity (FC) we employed the simple linear (Pearson) coefficient of correlation of the simulated BOLD time series. The representative examples of simulated FCs for different values of the coupling strength c are given in Fig. 2. We find that scaling the global coupling strength within the range from 23.3 to 23.4, in steps of 0.01, affects functional correlations between simulated time series and therefore FCs so as to agree with the empirical FC. Visually, patterns of correlated activity between empirical and simulated FC matrices agree best for with a correlation coefficient and mean squared error of 0.12 [compare Figs. 1B and 2]. At the same time, global network synchrony, measured via Eq. (2), displays a considerable amount of variation over time (Fig. 3). Variations in level of network synchrony represent an important property of the resting-state brain dynamics, that allow flexible network interactions. This is, again, the range of global coupling strength values where simulated FCs show best agreement with experiment.
Fig. 2.
Simulated functional connectivity according to Eq. (1) obtained for five different values of the coupling strength c
Fig. 3.
Global synchrony R given by Eq. (2) as a function of time for a coupling strength
Anatomical and functional connectivity
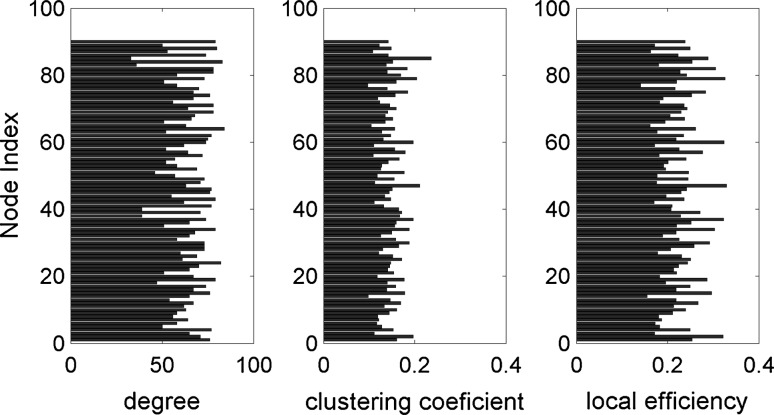
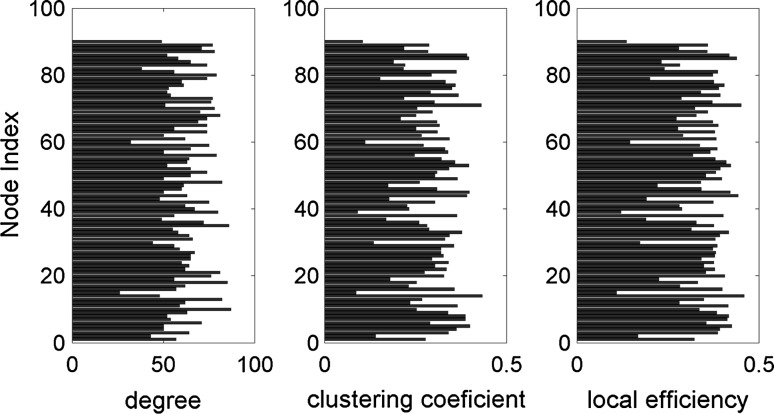
For exploration of the relation between structural connectivity and simulated functional connectivity, we consider a graph-theoretic approach (Bullmore and Sporns 2009). Here, we used standard methods to compute some of the most commonly used network characteristics: node degree, clustering coefficient and local efficiency. (See Rubinov and Sporns 2010 for details of these measures). All calculations are performed on weighted matrices – empirical AC and simulated FC – for . Figure 4 represents the above mentioned network measures obtained on the AC network. The same network measures calculated on simulated FC are represented in Fig. 5. Our analysis shows that calculated network measures for simulated FC are on average higher than those for the empirical AC. Furthermore, the degrees based on the simulated FC exhibit a larger variability demonstrating self-organizing dynamics in the network. These results suggest that an anatomical connectivity analysis requires also an analysis of network dynamics in order to provide insight into large-scale brain connectivity.
Fig. 4.
Characterization of the weighted anatomical connectivity matrix: node degree, clustering coefficient and local efficiency
Fig. 5.
Characterization of the weighted simulated functional connectivity matrix (coupling strength ): node degree, clustering coefficient and local efficiency
Conclusion
In this study we have shown that functional connectivity within a network of neural oscillators depends on the parameters of the populations: coupling strength and structural inhomogeneities. Moreover, the dependence for the agreement between empirical and simulated FCs, as well as for the global functional network properties, has been investigated. In particular, in the parameter regions where the simulated FC resembles the empirical FC, relation with the underlying structural connectivity is examined. The functional network shows a rich pattern of activity, dependent on the underlying topology and connections strength.
Acknowledgments
This work was supported by BMBF (grant no. 01Q1001B) in the framework of BCCN Berlin (Project B7). We thank John-Dylan Haynes and his group for helpful discussions concerning the fMRI data processing and Yasser Iturria-Medina for sharing the dMRI data used in the study.
Footnotes
Technical details on the numerical analysis. The simulations are carried out using the PYTHON module SCIPY. The algorithm used is based on the Bogacki-Shampine method (Boggio et al. 2009) with an adaptive step size for the numerical integration of Eq. (1). This is similar to the ODE23 routine implemented also in MATLAB (Shampine and Reichelt 1997). Initially, at , all phases , are randomly chosen from a uniform distribution.
References
- Biswal B, Yetkin FZ, Haughton VM, Hyde JS. Functional connectivity in the motor cortex of resting human brain using echo-planar MRI. Magn Reson Med. 1995;34(4):537–541. doi: 10.1002/mrm.1910340409. [DOI] [PubMed] [Google Scholar]
- Boggio PS, Amancio EJ, Correa CF, Cecilio S, Valasek C, Bajwa Z, Freedman SD, Pascual-Leone A, Edwards DJ, Fregni F. Transcranial DC stimulation coupled with TENS for the treatment of chronic pain: a preliminary study. Clin J Pain. 2009;25(8):691–695. doi: 10.1097/AJP.0b013e3181af1414. [DOI] [PubMed] [Google Scholar]
- Breakspear M, Heitmann S, Daffertshofer A. Generative models of cortical oscillations: neurobiological implications of the Kuramoto model. Front Hum Neurosci. 2010;4(190):1–14. doi: 10.3389/fnhum.2010.00190. [DOI] [PMC free article] [PubMed] [Google Scholar]
- Bullmore ET, Sporns O. Complex brain networks: graph theoretical analysis of structural and functional systems. Nat Rev Neurosci. 2009;10(3):186–198. doi: 10.1038/nrn2575. [DOI] [PubMed] [Google Scholar]
- Cabral J, Hugues E, Sporns O, Deco G. Role of local network oscillations in resting-state functional connectivity. NeuroImage. 2011;57(1):130–139. doi: 10.1016/j.neuroimage.2011.04.010. [DOI] [PubMed] [Google Scholar]
- Cabral J, Kringelbach ML, Deco G. Exploring the network dynamics underlying brain activity during rest. Prog Neurobiol. 2014;114:102–131. doi: 10.1016/j.pneurobio.2013.12.005. [DOI] [PubMed] [Google Scholar]
- Damoiseaux JS, Rombouts SARB, Barkhof F, Scheltens P, Stam CJ, Smith SM, Beckmann CF. Consistent resting-state networks across healthy subjects. Proc Natl Acad Sci USA. 2006;103(37):13848–13853. doi: 10.1073/pnas.0601417103. [DOI] [PMC free article] [PubMed] [Google Scholar]
- Deco G, Jirsa VK, McIntosh AR. Emerging concepts for the dynamical organization of resting-state activity in the brain. Nat Rev Neurosci. 2011;12(1):43–56. doi: 10.1038/nrn2961. [DOI] [PubMed] [Google Scholar]
- Deco G, Jirsa VK, McIntosh AR, Sporns O, Kötter R. Key role of coupling, delay, and noise in resting brain fluctuations. Proc Natl Acad Sci USA. 2009;106(25):10302–10307. doi: 10.1073/pnas.0901831106. [DOI] [PMC free article] [PubMed] [Google Scholar]
- Dimitriadis S, Laskaris N, Micheloyannis S. Transition dynamics of eeg-based network microstates during mental arithmetic and resting wakefulness reflects task-related modulations and developmental changes. Cogn Neurodyn. 2015;9:371–387. doi: 10.1007/s11571-015-9330-8. [DOI] [PMC free article] [PubMed] [Google Scholar]
- Friston K, Mechelli A, Turner R, Price CJ. Nonlinear responses in fMRI: the balloon model, Volterra kernels, and other hemodynamics. NeuroImage. 2000;12(4):466–477. doi: 10.1006/nimg.2000.0630. [DOI] [PubMed] [Google Scholar]
- Ghosh A, Rho Y, McIntosh AR, Kötter R, Jirsa VK. Cortical network dynamics with time delays reveals functional connectivity in the resting brain. Cogn Neurodyn. 2008;2(2):115–120. doi: 10.1007/s11571-008-9044-2. [DOI] [PMC free article] [PubMed] [Google Scholar]
- Ghosh A, Rho Y, McIntosh AR, Kötter R, Jirsa VK. Noise during rest enables the exploration of the brain’s dynamic repertoire. PLoS Comput Biol. 2008;4(10):e1000,196. doi: 10.1371/journal.pcbi.1000196. [DOI] [PMC free article] [PubMed] [Google Scholar]
- Hansen EC, Battaglia D, Spiegler A, Deco G, Jirsa VK. Functional connectivity dynamics: modeling the switching behavior of the resting state. NeuroImage. 2015;105:525–535. doi: 10.1016/j.neuroimage.2014.11.001. [DOI] [PubMed] [Google Scholar]
- Honey CJ, Sporns O, Cammoun L, Gigandet X, Thiran JP, Meuli R, Hagmann P. Predicting human resting-state functional connectivity from structural connectivity. Proc Natl Acad Sci USA. 2009;106(6):2035–2040. doi: 10.1073/pnas.0811168106. [DOI] [PMC free article] [PubMed] [Google Scholar]
- Hutchison RM, Womelsdorf T, Allen EA, Bandettini PA, Calhoun VD. Dynamic functional connectivity: promise, issues, and interpretations. NeuroImage. 2013;80:360–378. doi: 10.1016/j.neuroimage.2013.05.079. [DOI] [PMC free article] [PubMed] [Google Scholar]
- Iturria-Medina Y, Sotero RC, Canales-Rodríguez EJ, Alemán-Gómez Y, Melie-García L. Studying the human brain anatomical network via diffusion-weighted MRI and graph theory. NeuroImage. 2008;40(3):1064–1076. doi: 10.1016/j.neuroimage.2007.10.060. [DOI] [PubMed] [Google Scholar]
- Izhikevich EM, Kuramoto Y. Weakly coupled oscillators. Encycl Math Phys. 2006;5:448. [Google Scholar]
- Keane A, Dahms T, Lehnert J, Suryanarayana SA, Hövel P, Schöll E. Synchronisation in networks of delay-coupled type-I excitable systems. Eur Phys J B. 2012;85(12):407. doi: 10.1140/epjb/e2012-30810-x. [DOI] [Google Scholar]
- Leopold DA, Murayama Y, Logothetis NK. Very slow activity fluctuations in monkey visual cortex: implications for functional brain imaging. Cereb Cortex. 2003;13(4):422–433. doi: 10.1093/cercor/13.4.422. [DOI] [PubMed] [Google Scholar]
- Logothetis NK, Pauls J, Augath M, Trinath T, Oeltermann A. Neurophysiological investigation of the basis of the fMRI signal. Nature. 2001;412(6843):150–157. doi: 10.1038/35084005. [DOI] [PubMed] [Google Scholar]
- Nicosia V, Valencia M, Chavez M, Díaz-Guilera A, Latora V. Remote synchronization reveals network symmetries and functional modules. Phys Rev Lett. 2013;110:174,102. doi: 10.1103/PhysRevLett.110.174102. [DOI] [PubMed] [Google Scholar]
- Rubinov M, Sporns O. Complex network measures of brain connectivity: uses and interpretations. NeuroImage. 2010;52(3):1059–1069. doi: 10.1016/j.neuroimage.2009.10.003. [DOI] [PubMed] [Google Scholar]
- Seth AK, Chorley P, Barnett LC. Granger causality analysis of fmri bold signals is invariant to hemodynamic convolution but not downsampling. Neuroimage. 2013;65:540–555. doi: 10.1016/j.neuroimage.2012.09.049. [DOI] [PubMed] [Google Scholar]
- Shampine LF, Reichelt MW. The Matlab ODE suite. SIAM J Sci Comput. 1997;18(1):1–22. doi: 10.1137/S1064827594276424. [DOI] [Google Scholar]
- Shanahan M. Metastable chimera states in community-structured oscillator networks. Chaos. 2010;20(1):013,108. doi: 10.1063/1.3305451. [DOI] [PubMed] [Google Scholar]
- Strogatz SH. From Kuramoto to Crawford: exploring the onset of synchronization in populations of coupled oscillators. Phys D. 2000;143:1–20. doi: 10.1016/S0167-2789(00)00094-4. [DOI] [Google Scholar]
- Tognoli E, Kelso JS. The metastable brain. Neuron. 2014;81(1):35–48. doi: 10.1016/j.neuron.2013.12.022. [DOI] [PMC free article] [PubMed] [Google Scholar]
- Vuksanović V, Hövel P. Functional connectivity of distant cortical regions: role of remote synchronization and symmetry in interactions. NeuroImage. 2014;97:1–8. doi: 10.1016/j.neuroimage.2014.04.039. [DOI] [PubMed] [Google Scholar]
- Werner G. Consciousness related neural events viewed as brain state space transitions. Cogn Neurodyn. 2009;3(1):83–95. doi: 10.1007/s11571-008-9040-6. [DOI] [PMC free article] [PubMed] [Google Scholar]
- Zhou Y, Wang K, Liu Y, Song M, Song S, Jiang T. Spontaneous brain activity observed with functional magnetic resonance imaging as a potential biomarker in neuropsychiatric disorders. Cogn Neurodyn. 2010;4(4):275–294. doi: 10.1007/s11571-010-9126-9. [DOI] [PMC free article] [PubMed] [Google Scholar]


