Abstract
A novel enzyme-induced metallization colorimetric assay was developed to monitor and measure beta-galactosidase (β-gal) activity, and was further employed for colorimetric bacteriophage (phage)-enabled detection of Escherichia coli (E. coli). This assay relies on enzymatic reaction-induced silver deposition on the surface of gold nanorods (AuNRs). In the presence of β-gal, the substrate p-aminophenyl β-D-galactopyranoside (PAPG) is hydrolyzed to produce p-aminophenol (PAP). Reduction of silver ions by PAP generates a silver shell on the surface of AuNRs, resulting in the blue shift of the longitudinal localized surface plasmon resonance (LSPR) peak and multi-color changes of the detection solution from light green to orange-red. Under optimized conditions, the detection limit for β-gal was 128 pM, which was lower than the conventional colorimetric assay. Additionally, the assay had a broader dynamic range for β-gal detection. The specificity of this assay for the detection of β-gal was demonstrated against several protein competitors. Additionally, this technique was successfully applied to detect E. coli bacteria cells in combination with bacteriophage infection. Due to the simplicity and short incubation time of this enzyme-induced metallization colorimetric method, the assay is well suited for the detection of bacteria in low-resource settings.
Keywords: gold nanorod, enzyme-induced metallization, bacteria detection, bacteriophage, colorimetric detection
1. Introduction
Bacterial infectious diseases cause approximately one third of all global deaths.1–3 Accurate and early detection of bacterial pathogens can lead to immediate and effective actions to prevent or curtail foodborne and waterborne pathogen outbreaks.4 However, many of the current gold-standard methods to identify pathogenic bacteria require at least 18 hours from sampling to results.5 This slow time to answers creates an urgent need to develop rapid and reliable methods to detect bacteria in environmental, food, and water matrices. Compounding the challenge is the desirability for these methods to be useful in in resource-limited settings.6–10 A colorimetric assay that does not rely upon advanced instrumention and skilled operators would be a promising method for rapid detection of bacterial pathogens. Furthermore, colorimetric methods linked to enzymatic reactions have been widely accepted for their practicality and simplicity.4, 11, 12 Enzyme-induced colorimetric detection of bacteria is based on monitoring and measuring a color change resulting from enzymatic activity via a biochemical reaction of corresponding substrates.11–13 Unfortunately, current enzyme-induced colorimetric detection strategies do not have sensitive color changes, and are therefor semiquantitative.14 Hence, a novel enzyme-induced multi-colorimetric assay with high-sensitive color change is of great significance.
Plasmonic noble metal (gold and silver) nanomaterial-enabled colorimetric detection strategies provide rapid, sensitive sensing based on their unique optical properties.15–17 Interparticle crosslinking or destabilized aggregation of plasmonic metal nanoparticles has been used to detect DNA, cancer cells, heavy metal ions, and bacterial cells.15, 17 Compared with the similarly sized gold spherical nanoparticles, gold nanorods (AuNRs) have been reported to perform better due to an inherently higher sensitivity to local dielectric environment.18, 19 AuNRs have two localized surface plasmon resonance (LSPR) peaks: the transverse LSPR peak and the longitudinal LSPR peak. The transverse LSPR band locates around 520 nm, and the longitudinal absorption band locates from visible to near-infrared (NIR) absorption band depending on the aspect ratio (AR, length divided by width) of AuNRs.12, 20–23 The longitudinal LSRP peak shifts to shorter wavelength (blue shift) with the decreasing of AR.24 It has been demonstrated that depositing silver shell on the surface of AuNRs can change the AR of AuNRs, resulting in distinctive multicolor change.21, 25 The changes in color have been successfully utilized in an investigation into the affects of time and temperature on food freshness.21 While previous publications have reported to detect alkaline phosphatase and aminophenol, this technique has not been applied to the monitoring and measurement of beta-galactosidase (β-gal) activity, which can be served as an indicator for the detection of E. coli cells in clinical or food samples.26, 27
In this work, we utilized enzyme-induced silver metallization on the surface of AuNRs for both high-resolution colorimetric monitoring and measurement of β-gal activity. Our sensing strategy incorporates β-gal for hydrolyzation of substrates into weak reduction agents, which can reduce silver ions to generate a silver shell on the surface of AuNRs. The decrease of AR resulted in the blue shift of the longitudinal LSPR peak of AuNRs and an obvious color change from light green to orange-red. This method was employed to detect Escherichia coli (E. coli) in aqueous solutions using β-gal activity as a direct readout for E. coli concentrations. The bacterial cells were infected with T7 bacteriophages (phages) to release β-gal for enzyme-induced colorimetric detection. This phage-based system is advantageous compared to an antibody-based platform because of their specificity for target bacterial cells, their ability to distinguish between live and dead cells, and their low cost.28–31 Once released, the β-gal induces a metallic silver deposition on the surface of AuNRs. β-Gal activity and the blue shift of the longitudinal LSPR peak were directly related to the concentration of target E. coli cells. This enzyme-induced metallization colorimetric assay has the potential to be integrated into point-of-care devices for detection of bacterial concentration in low-resource settings.
2. Results and Discussion
2.1. Sensing Mechanism of Enzyme-Induced Colorimetric Assay
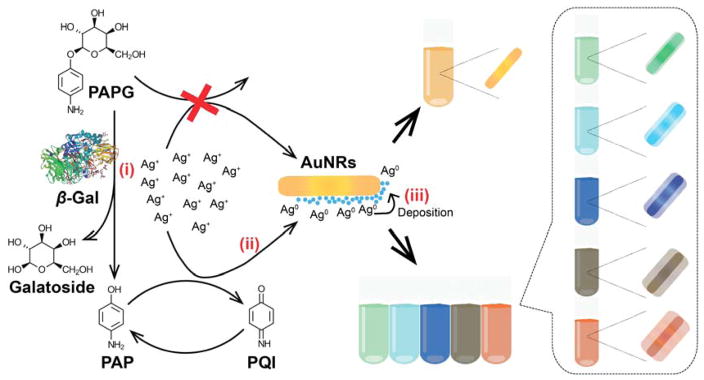
The principle of the AuNR-based multi-colorimetric assay using enzyme-induced metallization is shown in Scheme 1. In the absence of β-gal, the unhydrolyzed PAPG cannot reduce the silver ions to metallic silver. In this case, the color of the solution remains the initial color of AuNRs (light pink color). When β-gal is present, it cleaves PAPG into galactoside and a reducing agent PAP, which in turn reduces silver ions. In the presence of AuNRs, the reduced metallic silver coats the surface of AuNRs, resulting in a multi-color shift of the sample solution. The color of the solution varies from light green to orange-red corresponding to the β-gal concentration.
Scheme 1.
Sensing mechanism of enzyme-induced AuNR-based colorimetric assay for the monitoring and measuring of β-gal concentration. Three steps are involved: (i) β-gal converts PAPG into PAP serving as weak reducing agent, (ii) PAP reduces silver ions to metallic silver, and (iii) the AuNRs are coated with metallic silver, resulting in various colorful detection solutions.
2.2. Characteristics and Control Experiments for Enzyme-Induced Colorimetric Assay
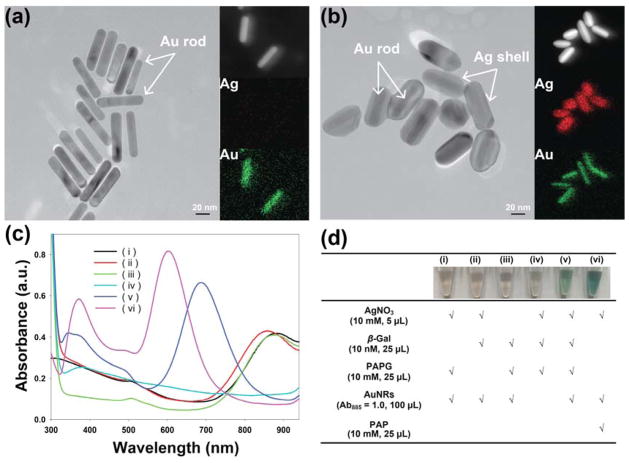
AuNR synthesis with different ARs generated using seed-mediated growth has been reported previously. 20, 32 In this study, AuNRs with an AR of appropriately 5.1 were used for colorimetric detection. Based on the sensing mechanism, nanorods with higher aspect ratio should work better. Upon deposition of metallic silver on the surface of nanorods, the aspect ratio decreased and finally became zero. Thus, the larger aspect ratio has more room to decrease, providing broader detectable linear range. In Figure 1a, the transmission electron microscopy (TEM) image shows the synthesized AuNRs with a length of 59 ± 8 nm and a width of 11 ± 1 nm. The AuNRs were coated with poly (4-styrenesulfonic acid) (PSS), resulting in a negative surface charge. The negative charges of the nanorods allowed colloidal stability and prevented aggregation, allowing them to be dispersed in phosphate buffer (PB) solution. The absorbance spectrum of AuNRs-PSS shows transverse and longitudinal plasmon bands at 510 and 885 nm, respectively (Figure S1). Compared with AuNRs-CTAB in Mill-Q water, slight shifts were observed in the transverse and longitudinal plasmon bands.
Figure 1.
TEM images of AuNRs (a) before and (b) after silver deposition (their corresponding EDX elemental mapping images of silver and gold were displayed on the right of their TEM images). Control experiments of the enzyme-inducted metallization colorimetric detection. (c) UV-vis absorption spectra and (d) table of reagents added to each tube of (i) AgNO3 + PAPG + AuNRs, (ii) AgNO3 + β-gal + AuNRs, (iii) β-gal + PAPG + AuNRs, (iv) AgNO3 + β-gal + PAPG, (v) AgNO3 + β-gal + PAPG + AuNRs, and (vi) AgNO3 + AuNRs + PAP.
This sensing procedure was validated with the following control experiments, with the absorbance spectra of these experiments shown in Figure 1c. The blue shift of the longitudinal LSPR peak occurred in the presence of AgNO3, β-gal, PAPG, and AuNRs. In the absence of β-gal and PAPG, enzymatic hydrolysis (PAP) caused a similar blue shift of the longitudinal LSPR peak, indicating that β-gal and PAPG solutions were key for the reduction of silver ions to form silver shell on the surface of AuNRs. Meanwhile, the color changes of AuNR solutions were measured (Figure 1d). These results demonstrated that our design has the ability to specifically detect β-gal concentration.
After adding β-gal into the PAPG, AgNO3, and AuNRs solution, the color change of solution was triggered by the deposition of metallic silver on the surface of AuNRs. To confirm the presence of a silver shell on the surface of AuNRs, the morphology of the AuNRs before and after enzyme-induced metallization were characterized using transmission electron microscopy (TEM). The resulting TEM images and energy-dispersive X-ray (EDX) elemental mapping images of AuNRs are shown in Figure 1a, b. Previous studies have reported that the metallic silver was preferably deposited on the transverse direction (body side) of AuNRs.21, 33 In our study, the silver shell on the body sides of AuNRs was observed in Figure 1b. The deposition of Ag shell on the surface of AuNRs was further investigated using HRTEM-EDX. In Figure 1a,b, the corresponding EDX Ag (red color) and Au (green color) mapping images confirmed also the coating of metallic silver on the surface of AuNRs. The Ag peaks in the EDX spectrum were observed after the enzyme-induced metallization (Figure S2).
Because the silver preferably deposited on the transverse direction of the AuNRs rather than the longitudinal direction, the reaction resulted in the decrease of the AR of the nanorod structure. Lower ARs generate greater blue shift of the longitudinal LSPR peak in the absorbance spectrum. Moreover, compared with Au nanocrystals of the same shape and size, Ag nanocrystals showed a shorter plasmon resonance.14, 21 Therefore, both enhanced absorbance intensity and blue shift of the longitudinal LSPR peak were observed after enzyme-induced Ag metallization on the surface of AuNRs (Figure 1c).
2.3. Analytical Performance for Colorimetric Detection of β-Gal Concentration
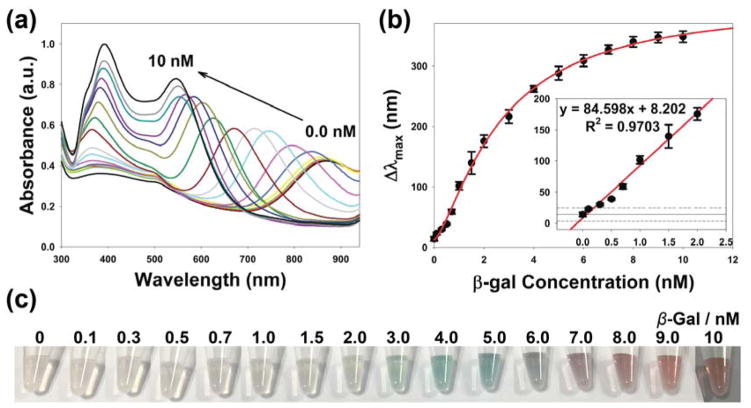
Before analytical performance, experimental parameters were optimized (Figure S3). Using the aforementioned optimized conditions, varying concentrations of β-gal were used to evaluate the sensitivity and dynamic range of the enzyme-induced metallization colorimetric assay. First, the β-gal solutions were incubated with PAPG solution to produce the reducing reagent PAP. After incubation for 30 minutes, the hydrolyzed PAP was added into the detection solution to reduce silver ions. We used the absorbance spectra to monitor the change of AuNRs in varying β-gal concentrations (Figure 2a). The longitudinal LSPR peak shifted from 885 nm to 520 nm, and the absorbance intensity of longitudinal LSPR peak likewise increased with the increasing of β-gal concentrations. The blue shift of the longitudinal LSPR peak (Δλmax) was plotted against the β-gal concentration. As shown in Figure 2b, the Δλmax increased with the increasing of β-gal concentration, and a dynamic relationship between Δλmax and β-gal concentration in a range from 0.1 nM to 10 nM was observed. The limit of detection (LOD) of 0.128 nM was calculated using 3σcontrol/slope, where σcontrol was the standard deviation of control samples, and the slope was from the linear range. As shown in Figure 2c, the detection solutions exhibited a color shift from light green to orange-red as compared to the control. The distinct multicolor changes at the concentration of 2.0 nM can be easily identified visually.34, 35
Figure 2.
The colorimetric detection of β-gal concentration using enzyme-induced metallization of gold nanorods. (a) UV-vis absorption spectra, (b) the blue shift in the longitudinal LSPR peak (insert: linear range, the solid and dash lines indicates the average and ± 3 standard deviation of Δλmax of control samples), and (c) photographs of multi-colorimetric assay toward various concentrations of β-gal.
For comparison, a conventional colorimetric assay for the detection of β-gal concentration using ONPG as enzymatic substrate was performed. As shown in Figure S4a, the absorbance spectra of detection solutions indicated the absorbance wavelength at 405 nm had the maximum absorbance intensity (A405 nm). The absorbance intensity at the wavelength of 405 nm versus β-gal concentration with ONPG as enzymatic substrate was plotted in Figure S4b. It was clearly observed that the absorbance intensity increased with the increasing of β-gal concentration and leveled off after the β-gal concentration of 2 nM. The dynamic range of conventional colorimetric method was from 0.1 nM to 2 nM, far narrower than that of our proposed colorimetric assay. For the ONPG method, the color shift of the detection solution went from colorless to yellow (Figure S4c). This shift is therefore difficult to identify visually. The results indicated that the ability to monitor and measure β-gal activity was improved in limit of detection, dynamic range, and colorimetric output using our proposed assay.
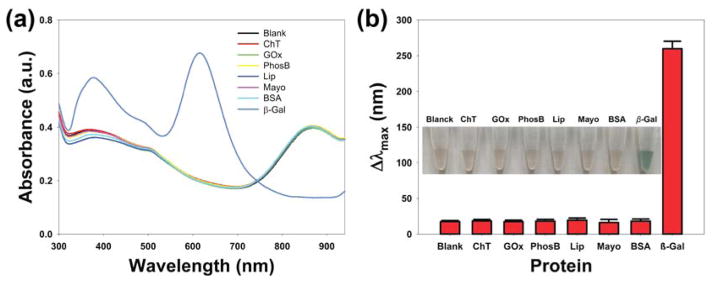
To evaluate the specificity of our present AuNR-based colorimetric assay for β-gal detection, control experiments were conducted using competing proteins (5 nM), including, α-chymotrypsin (ChT), glucose oxidase (GOx), alkaline phosphatase (PhosB), lipase (Lip), myoglobin (Mayo), and bovine serum albumin (BSA). As shown in Figure 3a, an obvious blue shift of the longitudinal LSPR peak in the absorbance spectra was observed only in the presence of β-gal; the Δλmax of competing proteins are plotted in Figure 3b. In contrast to solutions with β-gal, we did not observe a change in color in the control experiments, (Figure 3b). Thus, these results revealed that our present enzyme-induced silver metallization on the surface of AuNRs assay had specifically detects β-gal activity.
Figure 3.
The specificity of this proposed method for β-gal against common competing proteins (5 nM): ChT, GOx, PhosB, Lip, Mayo, and BSA. (a) UV-vis absorption spectra of the colorimetric assay toward various protein competitors. (b) The blue shift in the longitudinal LSPR peak of the specificity of β-gal against various protein competitors (insert: the corresponding photographs). Error bars represent the standard deviation of three replicates.
2.4. Application for AuNR-Based Colorimetric Detection of E. coli
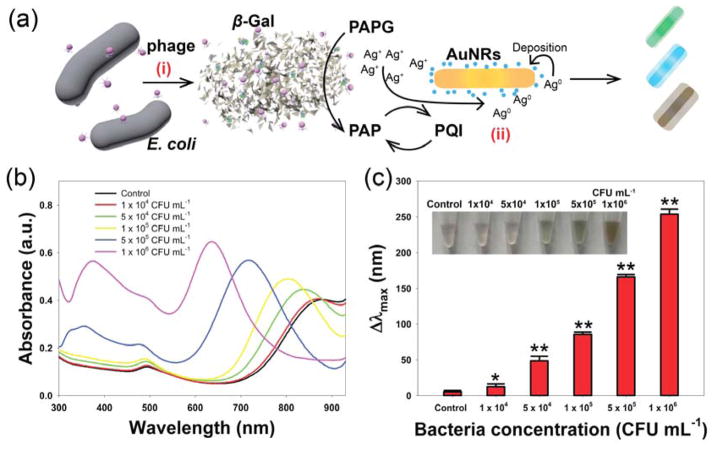
We next used our enzyme-induced metallization colorimetric assay to detect E. coli cells. β-gal is an essential enzyme in the inducible lactose transport and metabolism system of E. coli, and can be used as an indicator for their presence.36–40 Because phages can distinguish between live and inactive bacteria, their use as detection probes reduces the possibility of false-positive results.28 As shown in Figure 4a, the detection process can be divided into two steps: (i) phage infects and lyses the target bacterial cells, resulting in the release of β-gal into the sample solution, and (ii) determination of the released β-gal concentration from bacterial cells was determined using our present colorimetric assays. As a result, the bacterial concentration can be determined using UV-vis absorbance spectra, or conveniently by the naked eyes.
Figure 4.
(a) Schematic illustration of the enzyme-induced metallization colorimetric assay for the detection of E. coli cells: (i) phage infection of E. coli cells to release β-gal, and (ii) the signal generation based on enzyme-induced silver metallization on the surface of AuNRs. (b) UV-vis absorption spectra of the colorimetric assay toward various E. coli BL21 concentrations. (c) The blue shift in the longitudinal LSPR peak towards various E. coli BL21 concentrations (insert: the corresponding photographs). Error bars represent the standard deviation of three replicates. Significant values (t-test) were marked by an asterisk (*, 0.01 < p < 0.05) and two asterisks (**, p < 0.01), respectively.
E. coli BL21 was selected as model analyst, and bacteriophage T7 as the infecting phage were published previously.30, 31 This AuNR-based colorimetric assay combined the advantage of phage-based detection can specifically detection viable E. coli cells. As shown in Figure 4b, the different blue shifts of the longitudinal LSPR peak were observed. The Δλmax of different bacterial concentrations were also plotted in Figure 4c, revealing that we could reproducibly detect 1 × 10⁴ colony forming units (CFU) mL−1 (p < 0.05). Compared with previously reported methods to detect E. coli, at least one log decrease of detection limit was obtained using our developed method.37, 41 The images show the color of the detection solution shifting from light red to green to pale (Figure 6c, insert). As shown, the LOD based on the visual results was 1 × 10⁵ CFU·mL−1. In our previous publication, we have demonstrated that incorporating a pre-enrichment step can help us detect E. coli cells at low concentrations by monitoring β-gal activity.30 Thus, these results demonstrated that our present colorimetric assay could successfully detect bacterial concentrations.
3. Conclusion
In summary, a simple and rapid enzyme-induced metallization colorimetric assay has been successfully employed to monitor and measure β-gal activity. Compared with conventional ONPG-based colorimetric assay, our proposed method has a much broader dynamic range (0.1–10 nM) for the detection of β-gal concentration. This system also provided a rapid and distinctive colorimetric readout for visual detection of the β-gal concentration. Furthermore, we combined this assay with phage lysis to improve the detection of E. coli cells. The proposed technology has the ability to be fabricated into inexpensive, portable, friendly-to-user, and disposable devices, providing a benefit to their respective industries, especially if used in resource-limited settings.
4. Experimental Section
Chemicals and Materials
Experimental Details. Cetyltrimethylammonium bromide (CTAB), chlroauric acid trihydrate (HAuCl4), L-ascorbic acid (AA), poly (4-styrenesulfonic acid) (PSS), β-galactosidase (β-gal), p-aminophenyl β-D-galactopyranoside (PAPG), α-chymotrypsin (ChT), glucose oxidase (GOx), alkaline phosphatase (PhosB), lipase (Lip), myoglobin (Mayo), and bovine serum albumin (BSA) were purchased Sigma Aldrich (Saint Louis, MO). Silver nitrate (AgNO3) was purchased from Acros Organics (Morris Plains, NJ). Sodium borohydride (NaBH4), hydrochloric acid (HCl), O-nitrophenyl-β-galactoside (ONPG) sodium chloride (NaCl), potassium phosphate monobasic, sodium phosphate dibasic, agar, tryptone, and yeast extract were purchased from Fisher Scientific (Fair Lawn, NJ). All chemical were used as received. Mill-Q (MQ) water with 18.2 MΩ ·cm at 25 °C was used throughout the all experiments.
Synthesis and coating of AuNRs
The AuNRs stabilized with CTAB were synthesized using the seed-mediated growth method.12, 21, 22 For seed solution, HAuCl4 solution (0.25 ml, 0.01 M) was added into CTAB solution (9.75 mL, 0.1 M) under magnetic stirring. The freshly prepared ice-cold NaBH4 solution (0.6 mL, 0.01 M) was then added quickly. The solution was aged for 2 hours at 30 °C before use. The growth solution was prepared by mixing HAuCl4 solution (2.0 mL, 0.01 M), AgNO3 solution (0.4 mL, 0.01 M), HCl solution (0.8 mL, 0.1 M), and CTAB solution (40 mL, 0.1 M). AA solution (0.32 mL, 0.1M) was then added to reduce the gold salt. The seed solution (200 μL) was added until the growth solution became colorless. To grow the AuNRs, the mixture solution was kept at 30 °C overnight. The AuNRs were collected and washed by centrifugation (1000 ×g, 20 minutes) and redispersion in Mill-Q water twice. PSS (0.5 mL, 10 mg mL−1) in NaCl solution (5 mL, 10 mM) was added and incubated for 30 minutes in room temperature. Excess CTAB and PSS were removed by centrifuging twice at 1000 ×g for 20 minutes. Finally, the AuNRs with transverse and longitudinal plasmon bands at 510 and 885 nm were suspended into Mill-Q water. The AuNRs solution was diluted with an expected absorbance intensity of approriately1.000 at 858 nm.
AuNRs-based colorimetric monitoring of β-gal Concentration
Different concentrations of β-gal solution (25 μL) were added into PAPG solution (25 μL, 1.2 mM) in centrifuge tubes, respectively. The mixture solutions were gently agitated and incubated at 37 °C for 30 minutes. The enzymatic hydrolyses (50 μL) were added into detection solutions, which consisted of AuNRs solution (100 μL, Ab885 nm = 1.0), AgNO3 solution (10 μL, 10 mM), and PB (100 μL, 10 mM, pH 7.4). The absorbance spectra of the resulting solutions (200 μL) were recorded using UV-vis spectrophotometry with a wavelength range of 300–940 nm. The specificity to detect β-gal was investigated using competing proteins (ChT, GOx, PhosB, Lip, Mayo, and BSA).
Bacterial culture and bacteriophage
The E. coli BL21 and T7 phage were used in this study. A single colony of E. coli was selected and added into lysogeny broth (LB) and grown overnight at 37 °C under 200 rpm agitation. The E. coli stock was prepared by centrifugation at 6000 ×g for 2 minutes and resuspended in PB (10 mM, pH 7.4). The process was repeated for a total of three times. The concentration of E. coli cells was enumerated on a LB agar plate to confirm the visible counts (CFU·mL−1). The preparation and tittering of T7 phages were reported by our previous publications.30, 42
Detection of E. coli using AuNR-based colorimetric assay
The E. coli stock was serially diluted into varying concentrations using PB. Each concentration (25 μL) was added into sterile centrifuge tube containing PAPG solution (25 μL, 12 mM), phage solution (50 μL, appropriately 4.4 × 10⁷ PFU·mL−1), and PB (150 μL, 10 mM). In order to allow the phage infection and enzymatic reaction, the mixtures were gently agitated and incubated at 37 °C for 2 hours. The enzymatic hydrolyses (50 μL) were added into detection solutions consisting of AuNRs solution (100 μL, Ab885 nm = 1.0), AgNO3 solution (10 μL, 10 mM), and PB (100 μL, 10 mM). Finally, each produced color solution (200 μL) was measured using UV-vis spectrophotometry from 300 to 940 nm.
Supplementary Material
Acknowledgments
This work was supported by Center for Hierarchical Manufacturing, a National Science Foundation Nanoscale Science and Engineering Center at the University of Massachusetts supported under the NSF Award Number CMMI-1025020. The authors would also like to acknowledge National Institute of Food and Agriculture 2013-02037 and NIH grant GM077173 (VR) for their support.
Footnotes
Supporting Information is available from the Wiley Online Library or from the author.
Contributor Information
Juhong Chen, Department of Food Science, University of Massachusetts, Amherst, 102 Holdsworth Way, Amherst, Massachusetts, 01003, USA.
Dr. Angelyca A. Jackson, Department of Food Science, University of Massachusetts, Amherst, 102 Holdsworth Way, Amherst, Massachusetts, 01003, USA
Prof. Vincent M. Rotello, Email: rotello@chem.umass.edu, Department of Chemistry, University of Massachusetts, Amherst, 710 North Pleasant Street, Amherst, Massachusetts, 01003, USA
Prof. Sam R. Nugen, Email: snugen@foodsci.umass.edu, Department of Food Science, University of Massachusetts, Amherst, 102 Holdsworth Way, Amherst, Massachusetts, 01003, USA
References
- 1.Jones KE, Patel NG, Levy MA, Storeygard A, Balk D, Gittleman JL, Daszak P. Nature. 2008;451:990–993. doi: 10.1038/nature06536. [DOI] [PMC free article] [PubMed] [Google Scholar]
- 2.Chen J, Jiang Z, Ackerman JD, Yazdani M, Hou S, Nugen SR, Rotello VM. Analyst. 2015;140:4991–4996. doi: 10.1039/c5an00637f. [DOI] [PMC free article] [PubMed] [Google Scholar]
- 3.Zhang M, Yang F, Pasupuleti S, Oh JK, Kohli N, Lee IS, Perez K, Verkhoturov SV, Schweikert EA, Jayaraman A, Cisneros-Zevallos L, Akbulut M. Int J Food Microbiol. 2014;185:73–81. doi: 10.1016/j.ijfoodmicro.2014.05.019. [DOI] [PubMed] [Google Scholar]
- 4.Ray PC, Khan SA, Singh AK, Senapati D, Fan Z. Chem Soc Rev. 2012;41:3193–3209. doi: 10.1039/c2cs15340h. [DOI] [PubMed] [Google Scholar]
- 5.Rompré A, Servais P, Baudart J, de-Roubin M-R, Laurent P. J Microbiol Methods. 2002;49:31–54. doi: 10.1016/s0167-7012(01)00351-7. [DOI] [PubMed] [Google Scholar]
- 6.Whitesides GM. Nature. 2006;442:368–373. doi: 10.1038/nature05058. [DOI] [PubMed] [Google Scholar]
- 7.Varmus H, Klausner R, Zerhouni E, Acharya T. Science. 2003;302:398. doi: 10.1126/science.1091769. [DOI] [PMC free article] [PubMed] [Google Scholar]
- 8.Fu E, Liang T, Spicar-Mihalic P, Houghtaling J, Ramachandran S, Yager P. Anal Chem. 2012;84:4574–4579. doi: 10.1021/ac300689s. [DOI] [PMC free article] [PubMed] [Google Scholar]
- 9.Chen J, Zhou Y, Wang D, He F, Rotello VM, Carter KR, Watkins JJ, Nugen SR. Lab Chip. 2015;15:3086–3094. doi: 10.1039/c5lc00515a. [DOI] [PubMed] [Google Scholar]
- 10.Wang D, Wang Z, Chen J, Kinchla AJ, Nugen SR. Food Control. 2016;62:81–88. [Google Scholar]
- 11.Miranda OR, Li X, Garcia-Gonzalez L, Zhu ZJ, Yan B, Bunz UH, Rotello VM. J Am Chem Soc. 2011;133:9650–9653. doi: 10.1021/ja2021729. [DOI] [PMC free article] [PubMed] [Google Scholar]
- 12.Gole A, Murphy CJ. Chem Mater. 2004;16:3633–3640. [Google Scholar]
- 13.Jang H, Lee J, Min DH. J Mater Chem B. 2014;2:2452–2460. doi: 10.1039/c4tb00199k. [DOI] [PubMed] [Google Scholar]
- 14.Gao Z, Deng K, Wang XD, Miro M, Tang D. ACS Appl Mater Interfaces. 2014;6:18243–18250. doi: 10.1021/am505342r. [DOI] [PubMed] [Google Scholar]
- 15.Saha K, Agasti SS, Kim C, Li X, Rotello VM. Chem Rev. 2012;112:2739–2779. doi: 10.1021/cr2001178. [DOI] [PMC free article] [PubMed] [Google Scholar]
- 16.Lee JS, Lytton-Jean AK, Hurst SJ, Mirkin CA. Nano Lett. 2007;7:2112–2115. doi: 10.1021/nl071108g. [DOI] [PMC free article] [PubMed] [Google Scholar]
- 17.Song Y, Wei W, Qu X. Adv Mater. 2011;23:4215–4236. doi: 10.1002/adma.201101853. [DOI] [PubMed] [Google Scholar]
- 18.Wang C, Irudayaraj J. Small. 2008;4:2204–2208. doi: 10.1002/smll.200800309. [DOI] [PubMed] [Google Scholar]
- 19.Jana NR, Gearheart L, Murphy CJ. J Phys Chem B. 2001;105:4065–4067. [Google Scholar]
- 20.Link S, Mohamed M, El-Sayed M. J Phys Chem B. 1999;103:3073–3077. [Google Scholar]
- 21.Zhang C, Yin AX, Jiang R, Rong J, Dong L, Zhao T, Sun LD, Wang J, Chen X, Yan CH. Acs Nano. 2013;7:4561–4568. doi: 10.1021/nn401266u. [DOI] [PubMed] [Google Scholar]
- 22.Busbee BD, Obare SO, Murphy CJ. Adv Mater. 2003;15:414–416. [Google Scholar]
- 23.Zhou X, Zhou Y, Ku JC, Zhang C, Mirkin CA. ACS Nano. 2014;8:1511–1516. doi: 10.1021/nn405627s. [DOI] [PubMed] [Google Scholar]
- 24.Huang X, El-Sayed IH, Qian W, El-Sayed MA. Nano Lett. 2007;7:1591–1597. doi: 10.1021/nl070472c. [DOI] [PubMed] [Google Scholar]
- 25.Jiang R, Chen H, Shao L, Li Q, Wang J. Adv Mater. 2012;24:OP200–OP207. doi: 10.1002/adma.201201896. [DOI] [PubMed] [Google Scholar]
- 26.Yang X, Gao Z. Chem Commun. 2015;51:6928–6931. doi: 10.1039/c5cc01286d. [DOI] [PubMed] [Google Scholar]
- 27.Lin T, Li Z, Song Z, Chen H, Guo L, Fu F, Wu Z. Talanta. 2016;148:62–68. doi: 10.1016/j.talanta.2015.10.056. [DOI] [PubMed] [Google Scholar]
- 28.Wu L, Luan T, Yang X, Wang S, Zheng Y, Huang T, Zhu S, Yan X. Anal Chem. 2013;86:907–912. doi: 10.1021/ac403572z. [DOI] [PubMed] [Google Scholar]
- 29.van der Merwe RG, van Helden PD, Warren RM, Sampson SL, Gey van Pittius NC. Analyst. 2014;139:2617–2626. doi: 10.1039/c4an00208c. [DOI] [PubMed] [Google Scholar]
- 30.Chen J, Alcaine SD, Jiang Z, Rotello VM, Nugen SR. Anal Chem. 2015;87:8977–8984. doi: 10.1021/acs.analchem.5b02175. [DOI] [PubMed] [Google Scholar]
- 31.Chen J, Li Y, Huang K, Wang P, He L, Carter KR, Nugen SR. ACS Appl Mater Interfaces. 2015;7:22106–22113. doi: 10.1021/acsami.5b07879. [DOI] [PubMed] [Google Scholar]
- 32.Nikoobakht B, El-Sayed MA. Chem Mater. 2003;15:1957–1962. [Google Scholar]
- 33.Jiang R, Chen H, Shao L, Li Q, Wang J. Adv Mater. 2012;24:OP200–OP207. doi: 10.1002/adma.201201896. [DOI] [PubMed] [Google Scholar]
- 34.Martinez AW, Phillips ST, Carrilho E, Thomas SW, III, Sindi H, Whitesides GM. Anal Chem. 2008;80:3699–3707. doi: 10.1021/ac800112r. [DOI] [PMC free article] [PubMed] [Google Scholar]
- 35.Chen GH, Chen WY, Yen YC, Wang CW, Chang HT, Chen CF. Anal Chem. 2014;86:6843–6849. doi: 10.1021/ac5008688. [DOI] [PubMed] [Google Scholar]
- 36.Derda R, Lockett MR, Tang SKY, Fuller RC, Maxwell EJ, Breiten B, Cuddemi CA, Ozdogan A, Whitesides GM. Anal Chem. 2013;85:7213–7220. doi: 10.1021/ac400961b. [DOI] [PubMed] [Google Scholar]
- 37.Laczka O, Garcia-Aljaro C, del Campo FJ, Pascual FXM, Mas-Gordi J, Baldrich E. Anal Chim Acta. 2010;677:156–161. doi: 10.1016/j.aca.2010.08.001. [DOI] [PubMed] [Google Scholar]
- 38.Burnham S, Hu J, Anany H, Brovko L, Deiss F, Derda R, Griffiths M. Anal Bioanal Chem. 2014;406:5685–5693. doi: 10.1007/s00216-014-7985-3. [DOI] [PubMed] [Google Scholar]
- 39.Neufeld T, Schwartz-Mittelmann A, Biran D, Ron EZ, Rishpon J. Anal Chem. 2003;75:580–585. doi: 10.1021/ac026083e. [DOI] [PubMed] [Google Scholar]
- 40.Funes-Huacca M, Wu A, Szepesvari E, Rajendran P, Kwan-Wong N, Razgulin A, Shen Y, Kagira J, Campbell R, Derda R. Lab Chip. 2012;12:4269–4278. doi: 10.1039/c2lc40391a. [DOI] [PubMed] [Google Scholar]
- 41.Boyaci IH, Aguilar ZP, Hossain M, Halsall HB, Seliskar CJ, Heineman WR. Anal Bioanal Chem. 2005;382:1234–1241. doi: 10.1007/s00216-005-3263-8. [DOI] [PubMed] [Google Scholar]
- 42.Chen J, Duncan B, Wang Z, Wang LS, Rotello VM, Nugen SR. Nanoscale. 2015;7:16230–16236. doi: 10.1039/c5nr03779d. [DOI] [PubMed] [Google Scholar]
Associated Data
This section collects any data citations, data availability statements, or supplementary materials included in this article.


