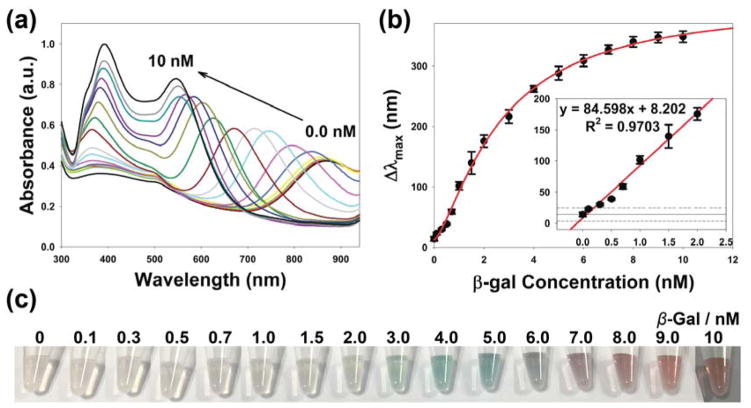
Figure 2.
The colorimetric detection of β-gal concentration using enzyme-induced metallization of gold nanorods. (a) UV-vis absorption spectra, (b) the blue shift in the longitudinal LSPR peak (insert: linear range, the solid and dash lines indicates the average and ± 3 standard deviation of Δλmax of control samples), and (c) photographs of multi-colorimetric assay toward various concentrations of β-gal.

