

Abstract
Background
Decisions on orthopedic interventions on upper body posture and its control have usually resulted from comparisons with the healthy state. Therefore, practitioners as well as scientists in human movement science or orthopedics need access to such kind of data which are patient-centered and well measured. Until now, these data have been missing concerning upper body posture as well as postural control and their control. That is why the aim of the current project is to measure these data with healthy participants across the lifespan.
Results
For standard value determination tolerance range and confidence intervals will be calculated. In addition, Pearson- or Spearman-Rank correlations will be used as well as two-sample-t-tests or Mann-Whitney-U-tests for specific group differences. All tests will be two-sided with the level of significance of 5 %.
Discussion
This project aims at improving classifications in adaptations of upper body posture and postural control. Measured standard values have not been determined before to this extent. Therefore, interventional effects may become better quantifiable and justiciable.
Keywords: Study protocol, Upper body posture, Postural control, Standard value, Confidence interval
Background
Postural control has to be regarded as a complex feedback-dependent system using various sensory inputs from visual, vestibular and somatosensory receptors [1–3]. Depending on what perception is being considered most important in any given task, the sensory information is rated and tested against each other. A common assumption is that the postural control system uses internal models of the body’s configuration and its dynamics, which are controlled by the central nervous system (= CNS). This control mechanism has to be highly adaptable at all times to be able to adjust to changing postural challenges. Those challenges, themselves, are highly variable, as they include short-term (e.g. surface changes) and long-term adaptations (e.g. physiological changes across the life span) [4–9].
Neuromuscular activity controls the position of all body segments in consideration of the external forces to produce a functional equilibrium. As all biological systems always try to minimize energetic costs for a given task, an optimal (in this sense) upright posture in humans is present if body weight is evenly distributed on both feet, as in this case the centre of mass (COM) is only vertically displaced from the centre of pressure (COP). Therefore, this body position may be maintained with the least possible muscular activity, as only weight load has to be supported while torques are minimized. Furthermore, the skeleton is minimally stressed [3, 10–12]. However, bipedal upright posture is an ‘unstable’ equilibrium, as has been shown by numerous studies using COP movement in static postural control: Even healthy individuals exhibit body sway. Further, the fluctuations are altered (mostly increased in spatial terms) if sensory perception is negatively influenced. Moreover, body constitution [13–15], age [5, 16], sex [16, 17] and maybe many more factors influence COP movement.
Measurement of postural control via COP tracking is an outcome measure analysis which is absolutely necessary and vital, but it is not able to give distinct information about alterations in upper body posture. It has repeatedly been shown that humans compensate for vertebral asymmetries which in case of a successful compensation cannot be detected via COP measurements anymore [18]. As wrong habitual posture may lead to adaptations/compensations of the trunk, the same applies vice versa. In consideration of the increasing number of back pain patients especially in industrialized nations, it is necessary to improve the quality of therapeutic and preventive interventions.
The decision which type of intervention is used for treatment is highly dependent on the experience of treating physician, physiotherapist, etc. and/or the patient him-/herself. Therefore, we are of the opinion that standard values of healthy persons of all age groups (>20 years) may and should help to improve the quality of current interventions.
From a scientific point of view, only if there are standard values guaranteeing objective classifications reliable and valid evaluations of adaptations can be made.
In the context of upper body posture and postural control, there has not been any documentation about time-synchronized measurements which could be used as standard values. If establishing standard values is the aim of any project, participant selection is crucial. In our case, participants will be from different social strata, and hence from different professions, while age and gender shall be distributed equally. Furthermore, a questionnaire evaluating risk factors, as for example, obesity, smoking, sedentary life style is used in search for further associations/correlations.
Aims
In this project non-invasive measurement techniques shall be used to determine upper body posture synchronously to static postural control. Upper body posture will be analysed through videorasterstereography, which has been used for this purpose before [19–24]. Further, postural control data will be collected using posturography [25–28]. A time-synchronized measurement of upper body posture through three-dimensional back scan and posturography has never been done before, but is expected to offer new insights to their interdependence. Recent papers have proven the need for standard values in this setting [29–31]. Therefore, the main aim of this study project is to register a wide ranging database of 1000 healthy subjects to record upper body posture and postural control values. These data enable a general description of the upper body posture and the postural control during habitual standing by defining standard values and confidence intervals using all evaluation parameters.
As secondary aim besides the collection of personal data like age, height, weight (BMI) or gender additional information concerning sport related activities or rather doing sport, smoking behavior or the livelihood and duration of backache and other common complaints are collected by a questionnaire. Having these additional data the calculation of correlations and regressions, respectively, can be conducted.
Therefore, the following parameters will be analyzed in terms of age, gender, social strata and profession:
Determination of a general range of tolerance and confidence intervals for upper body posture and postural control.
Determination of range of tolerance and confidence intervals for upper body posture and postural control depending on age.
Determination of range of tolerance and confidence intervals for upper body posture and postural control depending on gender.
Correlations between height, weight or body-mass-index and upper body posture and postural control.
Correlations between hours of work and upper body posture and postural control.
Correlations between work activities (basically sitting, standing or a mixture of both) and upper body posture and postural control.
Correlations between hours of work and work activities (basically sitting, standing or a mixture of both).
Correlations between physical activity, age and upper body posture and postural control.
Methods
Study population
In the course of this project 1000 participants >20 years will be tested, whereby age and gender will be divided equally. Therefore, each age group (20–30, 31–40, 41–50, 51–60, >60 years) will consist of a group of 200 persons, from whom 100 will be female. Body height and weight will be measured, while foot size, laterality and existing physical complaints (migraine headache, rheumatism, joint aches, back pain and the prevalence, smoking habits, wearing orthopedic insoles) will be assessed. Further, occupational activity, e.g. type of professional practice (mainly seated or standing) or hours of daily physical activity, hours of work, years working this job, physical activity and playing an instrument will be asked for.
Exclusion criteria are any kind of previous treatment, such as surgery or accidents, of the musculoskeletal system as well as the temporomandibular system should date back at least 2 years.
This study was approved by the ethics board for research involving human subjects of the Goethe University (219/14) in Frankfurt am Main, Germany.
Recruitment
Participants will be recruited at different places in Germany. This is why dental and medical practices have been chosen to ask patients being there for medical check-ups. Furthermore, contacting companies directly via mail and telephone and using notice boards at universities are methods for recruitment. Participation is voluntary.
Measurement systems
Three dimensional back scan
The 3D back measurement device “MiniRot Kombi” (ABW GmbH, Germany) is able to record changes in the upper back posture while standing using the videorasterstereography (Fig. 1). The sampling frequency is 50 Hz with a spatial resolution of 1/100 mm.
Fig. 1.
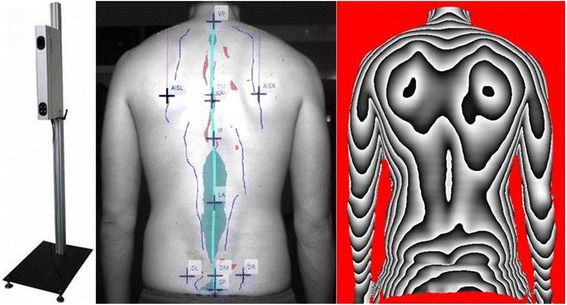
Back scanner MiniRot Combi (ABW GmbH, Frickenhausen/Germany) (left picture), marker placement on the bare back (central picture) and three-dimensional phase picture of the back (right picture)
An LCD camera captures this pattern from a defined angle.1 Therefore, the exposure of the back surface can be demonstrated as a phase picture in the software program (Fig. 1). For this phase picture all participants are marked with six markers on the skin which are defined anatomically (Fig. 1).
The measurement system needs approximately 2 s for the admission and data production of the six surface markers including the calculation and representation of the three-dimensional coordinates in a phase picture. During one sequence 15 photos are shot.
The measurement error is specified by the manufacturer with <1 mm. In reliability measurements the reproducibility is about <0.5 mm. This results from the fact that the calculations of the upper body posture are directly made by the marker on the object. This decreases artifacts that might be caused due to different placement of the patient in front of the scanner.
Force measuring platform
Postural control will be detected using a force platform (GP MultiSens, GeBioM, Münster, Germany) with an array of 2304 pressure sensors on a 1.444 cm2 surface. The sensor is 8 mm2 with a high sensor resolution due to two sensors per square millimeter. The sensors are arranged in a 48 row and 48 line matrix with a sampling frequency of 200 Hz. Therefore, sensor density is 0,64 per cm2. After amplification by a high ohm-resistance multiplier, the signals will be analyzed with the software “GP Fussdruck” (GeBioM, Münster, Germany). The results will be displayed as color-coded mesh.
Evaluation criteria
Upper body posture
The three-dimensional phase picture of the back will be divided into three components: spine (marker on C7 and L3), shoulder (marker at the highest place of the scapula) and pelvis (marker on left and right Spina iliaca posterior superior [SIPS]). All evaluation parameters are listed in Table 1. The illustration of the marker setup is shown in Fig. 2.
Table 1.
Detailed list and explanation of all back scan parameters
| Spine parameter | |
Trunk length D (mm)
|
Spatial distance between the markers VP and DM |
Trunk length S (mm)
|
Spatial distance between the markers VP and SP |
Sagittal trunk decline (°)
|
Inclination of the trunk length D marked line from the perpendicular to the sagittal plane. Tilt anteriorly (negative values) = possible lordosis Tilt dorsally (positive values) = possible kyphosis |
Frontal trunk decline (°)
|
Inclination of the trunk length D marked line from the perpendicular to the frontal plane. Tilt anteriorly (negative values) = possible lordosis Tilt dorsally (positive values) = possible kyphosis |
Axis decline (°)
|
Deviation of the line of the area marked by the trunk length D line of the 90 ° rotated distance DL-DR →decline between upper body and pelvis |
Thoracic bending angle (°)
|
Deviation of the distance VP - KA from the perpendicular |
Lumbar bending angle (°)
|
Deviation of the distance KA - LA from the perpendicular |
Standard deviation lateral deviation (mm)
|
Root mean squared deviation of the median line of the distance VP - DM |
Maximal lateral deviation (mm)
|
Maximum deviation of the median line of the distance VP - DM Negative values = deviation to the left Positive values = deviation to the right |
Standard deviation rotation (°)
|
Root mean square deviation of surface rotation of the median line (torsion of the spinous processes of the spine) |
Maximal rotation (°)
|
Maximum positive or negative surface rotation on the median line |
Kyphosis angle (°)
|
In the sagittal plane measured angle between the upper inflection point of the spine at the thoracolumbar and VP inflection point IP; point of greatest negative surface decline |
Lordosis angle (°)
|
Angle between the inflection point at DM and the thoracolumbar inflection point IP |
| Pelvis parameter | |
Pelvis distance (mm)
|
Spatial distance between SIPS L and SIPS R. |
Pelvis height (°) and (mm)
|
Decline of the connecting line between SIPS L and SIPS R to the horizontal in the frontal plane in degrees and millimeter |
Pelvis torsion (°)
|
Angle between the surface normal on the two dimples SIPS L and SIPS R Negative differential angle = Normal at point SIPS L is stronger upward as at point SIPS R Positive difference angle = Normal at point SIPS L is stronger downward as at point SIPS R. |
Pelvis rotation (°)
|
Rotation of the distance SIPS L – SIPS R in the transversal plane |
| Shoulder parameter | |
Scapular distance (mm)
|
Distance between the left (AISL) and the lower right scapular angle (AISR). |
Scapular height (°)
|
Height difference between the points AISL and AISR Positive value = AISR higher than AISL Negative value = AISR deeper than AISL |
Scapular rotation (°)
|
Rotation of the distance DL-DR in the transversal plane |
Scapular angle left (°)/Scapula angle right (°)
|
Best fit straight line on the shoulders to the horizontal. The center point of the regression line is set vertically above AISL / AISR. The greater the angle, the more caudally located the shoulder. |
Fig. 2.
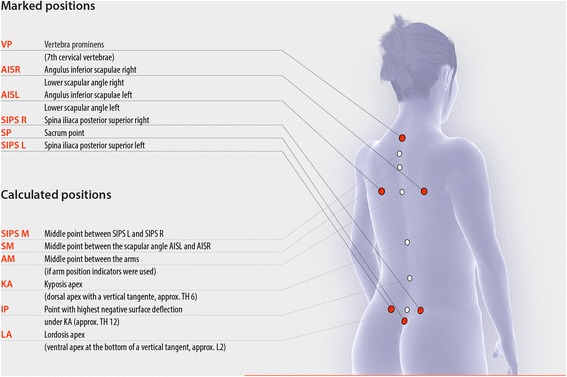
Marked and calculated positions of the back scan
Postural control
To assess postural control, balance (% of weight distribution) is determined. Average balance is therefore the average weight distribution during the measurement period for each foot. Same will be performed for front and back foot as well as for the left and right foot.
Furthermore, the body sway area of frontal and sagittal excursion (mm) will be determined.
Measurement protocol
All measurements will be performed in dimmed, quite rooms with comfortable room temperature.
Participants will be asked to stand barefoot with upper body undressed in habitual posture. Heels will be parallel to back scanner (distance: approximately 135 cm). Arms will hang down loosely with the view fixed at a point on the opposite wall on eye level. One measurement lasts for 5 s and will be repeated five times with short periods of rest in between.
Statistical data analysis
Sample size
The aim of the study is the determination of ranges of tolerance and 95 %-confidence intervals for upper body posture and postural control depending on age and gender. Using a sample size of N = 100 per decade and gender the precision of the corresponding 95 %-tolerance interval will be 3.7 % with a 95 % probability [32].
The determination of general ranges of tolerance intervals and confidence intervals for upper body posture and postural control parameter will be based on models adjusting for age and gender and will result in a higher precision:
Aiming at a sample size of N = 1000, we can assure that that the coverage of the tolerance interval is no more than 96.8 % with 95 % confidence [32].
Data analysis
Data will be tested for normal distribution using Kolmogorov-Smirnoff-Lilliefors-Test. Depending on the distribution, 95 %-confidence intervals for the mean or (in case of non-normality) for the median and normal or non-parametric 95 %-tolerance intervals with 99 % confidence (this is the confidence with which a tolerance interval based on sample mean and sample standard deviation actually includes the specified proportion of the population) will be constructed. The analysis comprises the evaluation parameters of the back scan and the force plate described above.
In addition the correlation between the upper body and the postural control parameters will be analyzed by Pearson- or Spearman-Rank-correlation. For this explorative analysis we will provide single test p –values and a correlation matrix heat map.
Furthermore, all parameters will be tested for specific group differences using the Two-sample-T-test or the Mann-Whitney-U-test. Hereby, p-values will be adjusted via Bonferroni-Holm.
All tests will be two-sided with a significance level of 5 %.
Statistical analyses will be performed using BiAS 11.0 (Epsilon Verlag, Norderstedt/Germany). The correlation matrix heat map will be constructed using R (R Core Team (2013). R Foundation for Statistical Computing, Vienna, Austria).
Discussion
Up to now, no standard values and confidence intervals of upper body posture and postural control have been reported, in which both parameters were evaluated synchronously, for different age, gender and occupational groups. Concerning posture and postural control, there have been many trials for classification in the past.
One of the earliest attempts to define normal values was conducted by Staffel in 1889 [33]. Based on the attempt to describe a perfect posture, German orthopaedics have established different procedures, e.g. postural index by Fröhner [34, 35] or Matthiass-Test [36, 37]. Flügel et al. [38] have measured the population of the German Democratic Republic to obtain standard values. The aim was to assess growth and development, partly also the health and resilience and controlling the success of therapeutic interventions. Another possibility for diagnostics is to measure the distance from the plump line to a wall which the person is leaning on. Every deviation from this functional equilibrium leads to a shift and therefore increases stress on active and passive structures [39–41].
The standard values will help decision making for therapeutic or clinic interventions as well as in the evaluation of therapeutic interventions.
Limitations
Having the expected difficulties of these planned investigations in mind, the Hawthorne effect should be considered as potential factor which may have an impact on the results. It is a possible explanation for the distortion of results in non-blind intervention studies since it involves behavioral changes due to awareness of being observed. Here, the active compliance of the test person and the presumed wishes of researchers are combined [42]. In contrast, a distortion of the results by the investigator is not likely to have an influence on this analysis of the restricted results due to pure numbers and defined evaluation criteria [43].
Videorasterstereography has been shown to be a valuable tool to determine back geometry in several studies. In comparison with other methods Asamoah et al. [44] found it to be effective to diagnose scoliosis and certain deformations. Values for sensitivity and specificity were 98 and 84 %. Other authors reported good correlations of angle measurements using videorasterstereography and X-ray [45] (r >.8 to .93). Restrictions were found with overweight people and people with extremely asymmetric back musculature. Asamoah et al. [44] postulated obesity becoming a problem for the measurements. Marker points have also been shown to be reproducible [46], but differences for parameters have been reported: angel measures are more prone to errors than distances. Drerup and Hierholzer [47] reported localization errors in a range of approximately 1 mm concerning Spina iliaca anterior superior. Fixation of markers is more complicated if participants are hairy and/or obese. Manual marker placement after the measurement may be helpful in this case.
Conclusions
This project aims at improving classifications in adaptations of upper body posture and postural control. Measured standard values have not been determined before to this extent. Therefore, interventional effects may become better quantifiable and justiciable.
Abbreviations
BMI, Body Mass Index; CNS, central nervous system; COP, centre of pressure; SIPS, Spina iliaca posterior superior
Acknowledgement
The authors would like to thank Prof. Johannes Schulze who made substantial contributions to the conception of the project and revised the manuscript critically for important intellectual content.
Funding
There is no funding.
Availability of data and materials
The dataset supporting the conclusions of this article is included within the article.
Authors’ contributions
DO, CM, NF, EW and DAG made substantial contributions to the conception and design of the manuscript, DO and CM made substantial contributions to the construction of the measurement protocol and NF has been involved in the statistical data analysis. All authors have read and approved the final manuscript.
Competing interest
The authors declare that they have no competing interests.
Consent for publication
Not applicable.
Ethics approval and consent to participate
This study was approved by the ethics board for research involving human subjects of the Goethe University (219/14) in Frankfurt am Main, Germany.
All participants will sign an informed consent to take part in the study in advance.
Footnotes
This angle is determined by the permanent installation of the camera and projector in the unit.
Contributor Information
Daniela Ohlendorf, Email: occup-med@uni-frankfurt.de.
Christoph Mickel, Email: c.mickel@sport.uni-frankfurt.de.
Natalie Filmann, Email: filmann@med.uni-frankfurt.de.
Eileen M. Wanke, Email: occup-med@uni-frankfurt.de
David A. Groneberg, Email: occup-med@uni-frankfurt.de
References
- 1.Diener HC, Dichgans J. On the role of vestibular, visual and somatosensory information for dynamic postural control in humans. Prog Brain Res. 1988;76:253–262. doi: 10.1016/S0079-6123(08)64512-4. [DOI] [PubMed] [Google Scholar]
- 2.Johansson R, Magnusson M. Human postural dynamics. Crit Rev Biomed Eng. 1991;18:413–437. [PubMed] [Google Scholar]
- 3.Peterka RJ. Sensorimotor integration in human postural control. J Neurophysiol. 2002;88:1097–1118. doi: 10.1152/jn.2002.88.3.1097. [DOI] [PubMed] [Google Scholar]
- 4.Assaiante C. Development of locomotor balance control in healthy children. Neurosci Biobehav Rev. 1998;22:527–532. doi: 10.1016/S0149-7634(97)00040-7. [DOI] [PubMed] [Google Scholar]
- 5.Baloh RW, Fife TD, Zwerling L, Socotch T, Jacobson K, Bell T, Beykirch K. Comparison of static and dynamic posturography in young and older normal people. J Am Geriatr Soc. 1994;42:405–412. doi: 10.1111/j.1532-5415.1994.tb07489.x. [DOI] [PubMed] [Google Scholar]
- 6.Breniere Y, Bril B. Development of postural control of gravity forces in children during the first 5 years of walking. Exp Brain Res. 1998;121:255–262. doi: 10.1007/s002210050458. [DOI] [PubMed] [Google Scholar]
- 7.Judge JO, King MB, Whipple R, Clive J, Wolfson LI. Dynamic balance in older persons: effects of reduced visual and proprioceptive input. J Gerontol A Biol Sci Med Sci. 1995;50:M263–270. doi: 10.1093/gerona/50A.5.M263. [DOI] [PubMed] [Google Scholar]
- 8.Perrin PP, Jeandel C, Perrin CA, Bene MC. Influence of visual control, conduction, and central integration on static and dynamic balance in healthy older adults. Gerontology. 1997;43:223–231. doi: 10.1159/000213854. [DOI] [PubMed] [Google Scholar]
- 9.Prieto TE, Myklebust JB, Hoffmann RG, Lovett EG, Myklebust BM. Measures of postural steadiness: differences between healthy young and elderly adults. IEEE Trans Biomed Eng. 1996;43:956–966. doi: 10.1109/10.532130. [DOI] [PubMed] [Google Scholar]
- 10.Breithecker D. Der Rücken im Kontext der Gesamtkörperstatik. Haltung und Bewegung. 1992;2:23–29. [Google Scholar]
- 11.Peterka RJ, Loughlin PJ. Dynamic regulation of sensorimotor integration in human postural control. J Neurophysiol. 2004;91:410–423. doi: 10.1152/jn.00516.2003. [DOI] [PubMed] [Google Scholar]
- 12.Zajac FE, Neptune RR, Kautz SA. Biomechanics and muscle coordination of human walking. Part I: introduction to concepts, power transfer, dynamics and simulations. Gait Posture. 2002;16:215–232. doi: 10.1016/S0966-6362(02)00068-1. [DOI] [PubMed] [Google Scholar]
- 13.Blaszczyk JW, Cieslinska-Swider J, Plewa M, Zahorska-Markiewicz B, Markiewicz A. Effects of excessive body weight on postural control. J Biomech. 2009;42:1295–1300. doi: 10.1016/j.jbiomech.2009.03.006. [DOI] [PubMed] [Google Scholar]
- 14.Cruz-Gomez NS, Plascencia G, Villanueva-Padron LA, Jauregui-Renaud K. Influence of obesity and gender on the postural stability during upright stance. Obes Facts. 2011;4:212–217. doi: 10.1159/000329408. [DOI] [PMC free article] [PubMed] [Google Scholar]
- 15.Herrera-Rangel A, Aranda-Moreno C, Mantilla-Ochoa T, Zainos-Saucedo L, Jauregui-Renaud K. The influence of peripheral neuropathy, gender, and obesity on the postural stability of patients with type 2 diabetes mellitus. J Diabetes Res. 2014;2014:787202. doi: 10.1155/2014/787202. [DOI] [PMC free article] [PubMed] [Google Scholar]
- 16.Kim JW, Kwon Y, Ho Y, Jeon HM, Bang MJ, Jun JH, Eom GM, Park BK, Cho YB. Age-gender differences in the postural sway during squat and stand-up movement. Biomed Mater Eng. 2014;24:2707–2713. doi: 10.3233/BME-141088. [DOI] [PubMed] [Google Scholar]
- 17.Kim JW, Eom GM, Kim CS, Kim DH, Lee JH, Park BK, Hong J. Sex differences in the postural sway characteristics of young and elderly subjects during quiet natural standing. Geriatr Gerontol Int. 2010;10:191–198. doi: 10.1111/j.1447-0594.2010.00614.x. [DOI] [PubMed] [Google Scholar]
- 18.Oullier O, Marin L, Stoffregen TA, Boostma RJ, Bardy BG. Variability in postural coordination dynamics. In: Davids K, Bennett S, Newell K, editors. Movement system variability. Champaign: Human Kinetics; 2006. [Google Scholar]
- 19.Betsch M, Wild M, Grosse B, Rapp W, Horstmann T. The effect of simulating leg length inequality on spinal posture and pelvic position: a dynamic rasterstereographic analysis. Eur Spine J. 2012;21:691–697. doi: 10.1007/s00586-011-1912-5. [DOI] [PMC free article] [PubMed] [Google Scholar]
- 20.Betsch M, Wild M, Jungbluth P, Thelen S, Hakimi M, Windolf J, Horstmann T, Rapp W. The rasterstereographic-dynamic analysis of posture in adolescents using a modified Matthiass test. Eur Spine J. 2010;19:1735–1739. doi: 10.1007/s00586-010-1450-6. [DOI] [PMC free article] [PubMed] [Google Scholar]
- 21.Dankerl P, Keller AK, Haberle L, Stumptner T, Pfaff G, Uder M, Forst R. Effects on posture by different neuromuscular afferent stimulations and proprioceptive insoles: rasterstereographic evaluation. Prosthetics Orthot Int. 2014;40:369–376. doi: 10.1177/0309364614554031. [DOI] [PubMed] [Google Scholar]
- 22.Drerup B. Rasterstereographic measurement of scoliotic deformity. Scoliosis. 2014;9:22. doi: 10.1186/s13013-014-0022-7. [DOI] [PMC free article] [PubMed] [Google Scholar]
- 23.Kwon YJ, Song M, Baek IH, Lee T. The effect of simulating a leg-length discrepancy on pelvic position and spinal posture. J Phys Ther Sci. 2015;27:689–691. doi: 10.1589/jpts.27.689. [DOI] [PMC free article] [PubMed] [Google Scholar]
- 24.Castellano M, Lilli C, Barbato E, Santilli V, Galluccio G. Craniofacial asymmetry in non-syndromic orthodontic subjects: clinical and postural evaluation. Cranio. 2016;34(3):144–54. doi: 10.1179/2151090315Y.0000000009. [DOI] [PubMed] [Google Scholar]
- 25.Ko DY, Lee HS. The changes of COP and foot pressure after one hour’s walking wearing high-heeled and flat shoes. J Phys Ther Sci. 2013;25:1309–1312. doi: 10.1589/jpts.25.1309. [DOI] [PMC free article] [PubMed] [Google Scholar]
- 26.Meshkati Z, Namazizadeh M, Salavati M, Mazaheri M. Reliability of force-platform measures of postural sway and expertise-related differences. J Sport Rehabil. 2011;20:442–456. doi: 10.1123/jsr.20.4.442. [DOI] [PubMed] [Google Scholar]
- 27.Moghadam M, Ashayeri H, Salavati M, Sarafzadeh J, Taghipoor KD, Saeedi A, Salehi R. Reliability of center of pressure measures of postural stability in healthy older adults: effects of postural task difficulty and cognitive load. Gait Posture. 2011;33:651–655. doi: 10.1016/j.gaitpost.2011.02.016. [DOI] [PubMed] [Google Scholar]
- 28.Pomarino D, Nawrath A, Beyer J. Altersabhängige Messungen zur posturalen Stabilität gesunder Probanden. OUP. 2013;2:420–425. [Google Scholar]
- 29.Assassi S, Weisman MH, Lee M, Savage L, Diekman L, Graham TA, Rahbar MH, Schall JI, Gensler LS, Deodhar AA, et al. New population-based reference values for spinal mobility measures based on the 2009–2010 National Health and Nutrition Examination Survey. Arthritis Rheum (Hoboken, NJ) 2014;66:2628–2637. doi: 10.1002/art.38692. [DOI] [PMC free article] [PubMed] [Google Scholar]
- 30.McKay MJ, Baldwin JN, Ferreira P, Simic M, Vanicek N, Hiller CE, Nightingale EJ, Moloney NA, Quinlan KG, Pourkazemi F, et al. 1000 Norms Project: protocol of a cross-sectional study cataloging human variation. Physiotherapy. 2016;102(1):50–6. doi: 10.1016/j.physio.2014.12.002. [DOI] [PubMed] [Google Scholar]
- 31.Bennell K, Coburn S, Wee E, Green S, Harris A, Forbes A, Buchbinder R. Efficacy and cost-effectiveness of a physiotherapy program for chronic rotator cuff pathology: a protocol for a randomised, double-blind, placebo-controlled trial. BMC Musculoskelet Disord. 2007;8:86. doi: 10.1186/1471-2474-8-86. [DOI] [PMC free article] [PubMed] [Google Scholar]
- 32.Odeh RE, Younchou M, Owen DB. The precision for coverages and sample size requirements for normal tolerance intervals. Commun Stat Simul C. 1987;16:969–985. doi: 10.1080/03610918708812631. [DOI] [Google Scholar]
- 33.Staffel F. Die menschlichen Haltungstypen und ihre Beziehungen zu den Rückgratverkrümmungen. Wiesbaden: Bergmann; 1889. [Google Scholar]
- 34.Fröhner G. Objektivierung der Haltung und Beweglichkeit des Rumpfes bei Kindern und Jugendlichen. Haltung und Bewegung. 1998;2:5–13. [Google Scholar]
- 35.Fröhner G, Wagner K. Die Analyse von Rumpffunktionen. Leistungssport. 2002;6:46–53. [Google Scholar]
- 36.Matthiass H. Measuring methods of the spine in the diagnostic of spine disease. Stuttgart: Gustav Fischer; 1961. [Google Scholar]
- 37.Matthiass H. Maturation, growth and disturbances of growth of the posture and the musculoskeletal system of adolescents. Basel: Karger; 1966. [Google Scholar]
- 38.Flügel B, Greil H, Sommer K. Anthropologischer Atlas. Berlin: Tribüne Verlag; 1986. [Google Scholar]
- 39.Benninghoff A, Drenckhahn D. Taschenbuch Anatomie. München: Elsevier, Urban & Fischer Verlag; 2008. [Google Scholar]
- 40.Götz-Neumann K. Gehen verstehen. Ganganalyse in der Physiotherapie. Stuttgart: Thieme Verlag; 2006. [Google Scholar]
- 41.Perry J, Burnfield JM. Gait analysis: normal and pathological function. Thorofare: Slack Incorporated; 2010. [Google Scholar]
- 42.Wickstrom G, Bendix T. The “Hawthorne effect”--what did the original Hawthorne studies actually show? Scand J Work Environ Health. 2000;26:363–367. doi: 10.5271/sjweh.555. [DOI] [PubMed] [Google Scholar]
- 43.Livingston JS. Pygmalion in management. 1969. Harv Bus Rev. 2003;81(1):97-106. [PubMed]
- 44.Asamoah V, Mellerowicz H, Venus J, Klockner C. [Measuring the surface of the back. Value in diagnosis of spinal diseases] Orthopade. 2000;29:480–489. doi: 10.1007/s001320050486. [DOI] [PubMed] [Google Scholar]
- 45.Drerup B. Die Bestimmung der Wirbelkörperrotation aus der Projektion der Bogenwurzeln. Med Phys. 1983;31:663–667. [Google Scholar]
- 46.Drerup B, Hierholzer E. Movement of the human pelvis and displacement of related anatomical landmarks on the body surface. J Biomech. 1987;20:971–977. doi: 10.1016/0021-9290(87)90326-5. [DOI] [PubMed] [Google Scholar]
- 47.Drerup B, Hierholzer E. Automatic localization of anatomical landmarks on the back surface and construction of a body-fixed coordinate system. J Biomech. 1987;20:961–970. doi: 10.1016/0021-9290(87)90325-3. [DOI] [PubMed] [Google Scholar]
Associated Data
This section collects any data citations, data availability statements, or supplementary materials included in this article.
Data Availability Statement
The dataset supporting the conclusions of this article is included within the article.