Abstract
Ebola viruses (EBOVs) are responsible for repeated outbreaks of fatal infections, including the recent deadly epidemic in West Africa. There are currently no approved therapeutic drugs or vaccines for the disease. EBOV has a membrane envelope decorated by trimers of a glycoprotein (GP, cleaved by furin to form GP1 and GP2 subunits) which is solely responsible for host cell attachment, endosomal entry and membrane fusion1–7. GP is thus a primary target for the development of antiviral drugs. Here we report the first unliganded structure of EBOV GP, and complexes with an anticancer drug toremifene and the painkiller ibuprofen. The high-resolution apo structure gives a more complete and accurate picture of the molecule, and allows conformational changes introduced by antibody and receptor binding to be deciphered8–10. Unexpectedly both toremifene and ibuprofen bind in a cavity between the attachment (GP1) and fusion (GP2) subunits at the entrance to a large tunnel that links with equivalent tunnels from the other monomers of the trimer at the 3-fold axis. Protein-drug interactions, with both GP1 and GP2, are predominately hydrophobic. Residues lining the binding site are highly conserved amongst filoviruses except Marburg virus (MARV), suggesting that MARV may not bind these drugs. Thermal shift assays show up to a 14 °C decrease in protein melting temperature upon toremifene binding, while ibuprofen has only a marginal effect and is a less potent inhibitor. The results suggest that inhibitor binding destabilizes GP and triggers premature release of GP2, therefore preventing fusion between the viral and endosome membranes. Thus these complex structures reveal the mechanism of inhibition and may guide the development of more powerful anti-EBOV drugs.
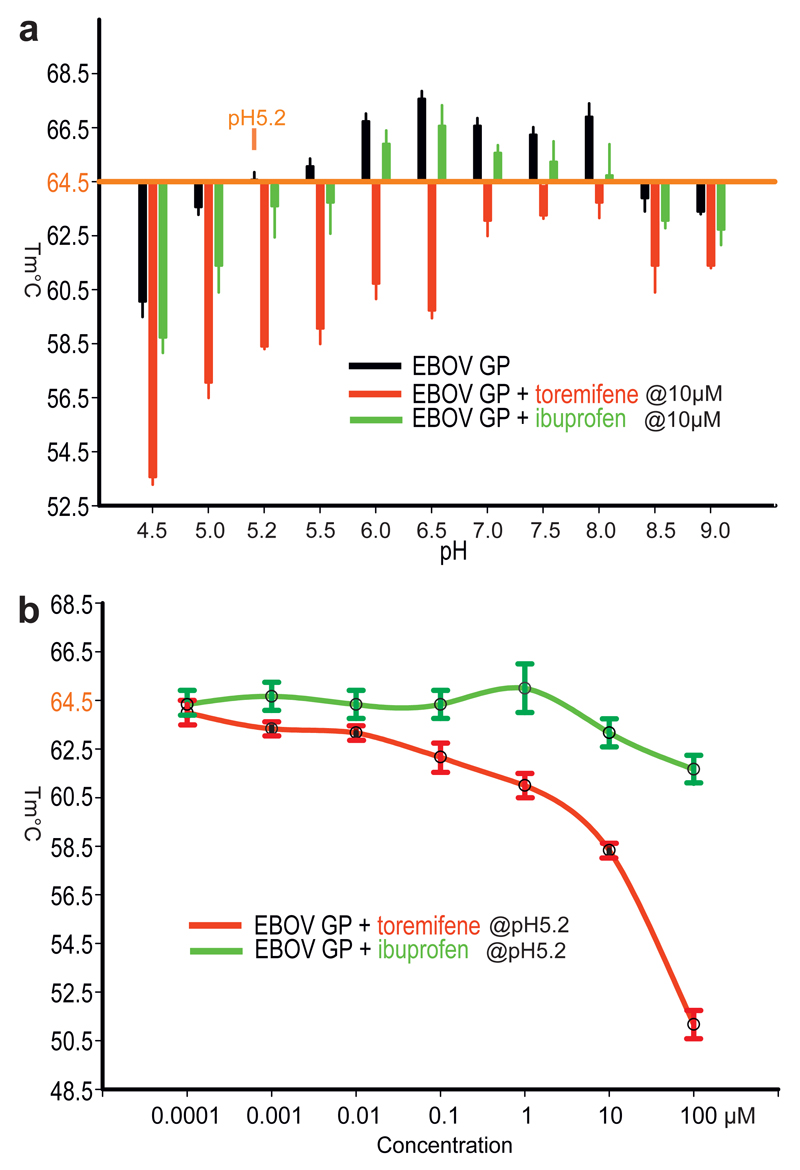
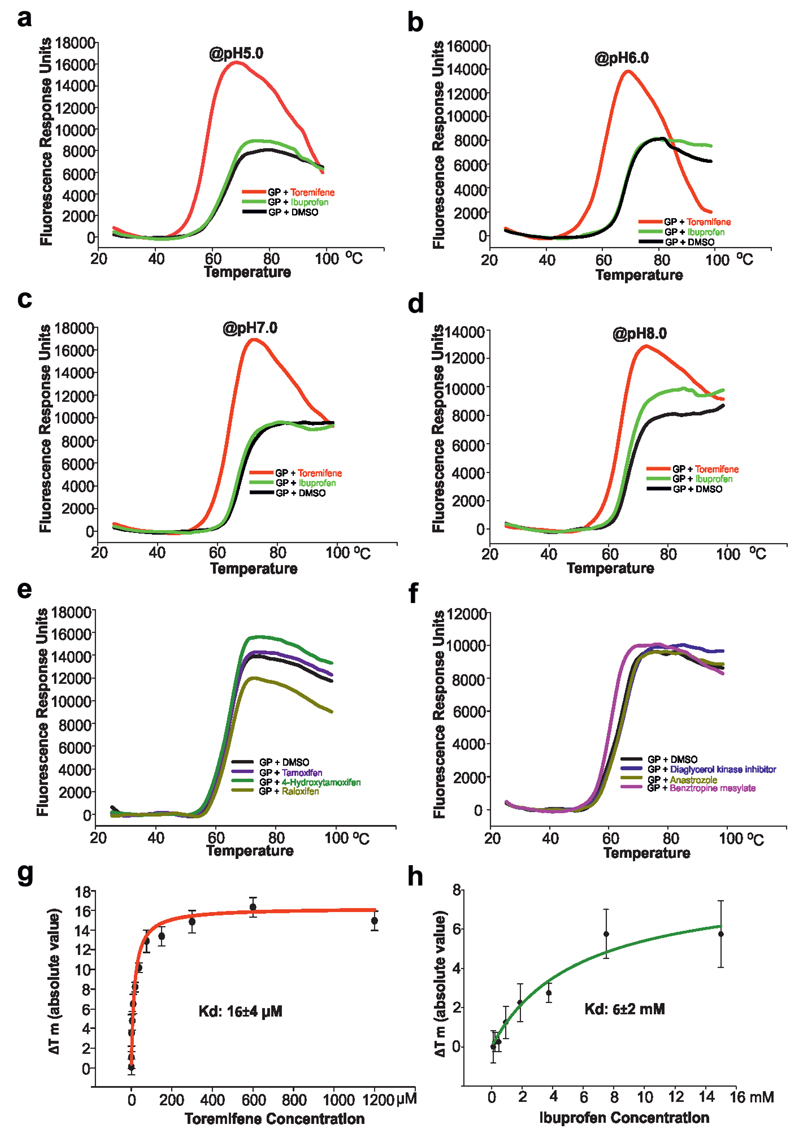
The recent outbreak of EBOV in West Africa, the worst of more than 30 in the last 40 years, comprised more than 28,000 cases and over 11,000 deaths11. In the urgent need to find therapeutics, many small compounds and existing FDA approved drugs have been screened in vitro or in silico (eg ibuprofen was suggested by docking experiments12) to find lead compounds for drug development or repurpose drugs for the treatment of EBOV disease13–16. Among these, a set of selective estrogen receptor modulators (SERMs) stand out as potential inhibitors from in vitro and in vivo studies14, however, their mechanism of action remains largely unknown. Using recombinant EBOV glycoprotein we tested whether 9 such compounds could directly bind by a thermal shift assay (Methods). The results show that toremifene in particular drastically decreases the melting temperature (Tm) of EBOV GP, by up to 14 °C at 100 µM (Fig. 1). This contrasts with the action of inhibitors on most protein targets, which tend to increase stability17, although destabilisation has been reported before18. Benztropine19, the G protein-coupled receptor (GPCR) antagonist, also decreases the Tm of GP by 4°C, whilst other compounds, including ibuprofen, showed Tm shifts <2 °C (Fig. 1, Extended Data Fig. 1). The destabilization effect of toremifene and ibuprofen is both pH and concentration dependent (Fig. 1). The binding constants (Kd) determined by this assay are 16 µM for toremifene and 4 mM for ibuprofen (Extended Data Fig. 1). In a mouse model14 toremifene appears to be even more potent (IC50, ~1 µM).
Figure 1. Summary of thermal shift assays.
a, The effects of toremifene and ibuprofen on the melting temperature of EBOV GP at different pHs. The raw fluorescence traces are shown in Extended Data Fig. 1. Protein melting temperature at pH 5.2 at which crystals were grown is taken as the reference point. b, The melting temperatures of EBOV GP at different concentrations of toremifene or ibuprofen, at pH 5.2. Data are mean±s.d. (n=3).
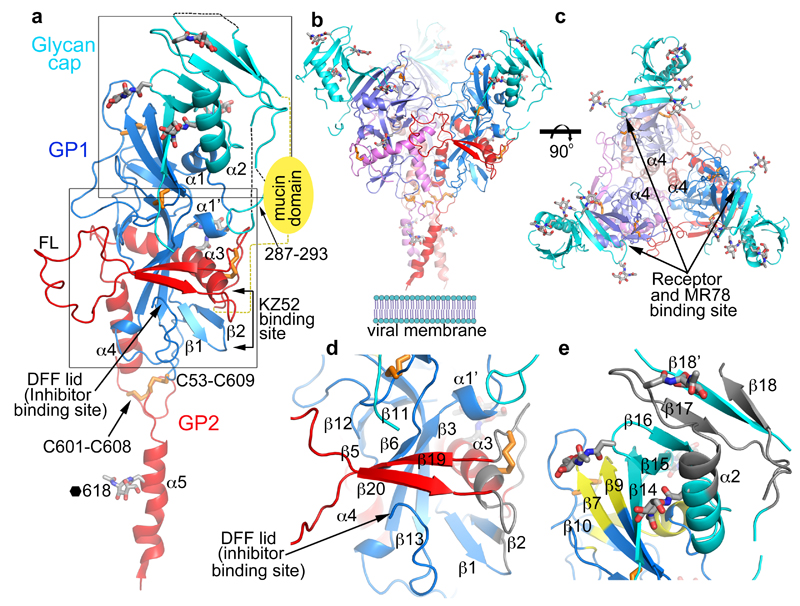
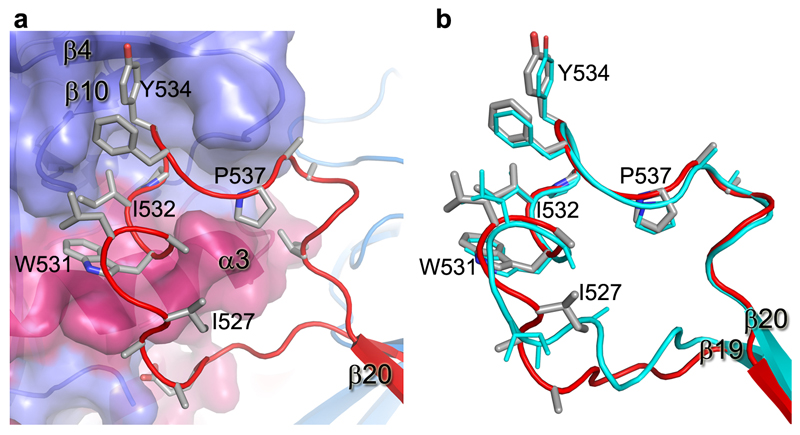
The crystal structure of unliganded EBOV GP was determined at 2.2 Å resolution, with good R-factors and stereochemistry (Extended Data Table 1). Three copies each of the GP1 and GP2 subunits (Fig. 2a), form the biological trimer around the crystallographic 3-fold axis (Fig. 2b,c). This structure, although crystallised at pH5.2, represents the prefusion state of the molecule, with the GP1 receptor-binding site blocked by a glycan cap (Fig. 2e). GP1 is composed of predominantly β-strands, forming a large semi-circular groove at the centre of the subunit that clamps α3 helix and β19-β20 strands of GP2 (Fig. 2d). The glycan cap is removed in the late endosome by cathepsin B/L to expose the receptor Niemann-Pick disease type C1 (NPC1) binding site9,20,21. GP2 catalyses membrane fusion and contains N-terminal (α3 and α4) and C-terminal (α5) heptad repeats (NHR and CHR, respectively) linked by a CX6CC motif (residues 601-609, Fig. 2a). The CHR, disordered in all previously published GP structures8–10, contributes to the trimer interface in our structure (Fig. 2b,c) and harbours N618, which is glycosylated as predicted. The well ordered CX6CC motif forms intrasubunit (C601-C608), and intersubunit (C53-C609) disulphide bonds (Fig. 3). Mutation of any of these cysteines renders the virus incapable of entering host cells22. In the fusion process, GP2 undergoes conformational changes whereby the α5 refolds onto a helix coalesced from α3 and α4 to form a six-helix bundle23 (Extended Data Fig. 2). In our prefusion structure, the hydrophobic GP2 fusion loop (residues 511-554) (Fig 2a) projects into a neighbouring monomer and is stabilized in a shallow depression surrounded by loops β4-β5 and β10-β11, and α3. Apart from residues 521-526, which have very loose interactions with the rest of the protein, the fusion loop in this pH 5.2 apo GP is very similar to that in the KZ52 Fab complex crystallized at pH 8.3 (Extended Data Fig. 3), in contrast to the large conformational changes reported for the isolated fusion loop at different pHs (ref24), suggesting that GP1 maintains GP2 in the pre-fusion state until receptor binds.
Figure 2. Overall structure.
a, Cartoon diagram of EBOV GP monomer, GP1 blue, GP2 red and the glycan cap cyan. Secondary structural elements named as previously8. Disulphide bonds shown as orange sticks, glycans in grey. The mucin domain omitted in our construct is shown as a yellow oval. FL, fusion loop. The C-terminal inserted foldon trimerization domain is disordered. b, The biological trimer viewed perpendicular to the 3-fold axis with one monomer coloured as in a and the second and third faded for clarity. c, The trimer viewed along the 3-fold, towards the viral membrane. d, Close up of the inhibitor binding site. e, Close up of the glycan cap and receptor binding site. Areas shown in d and e are indicated in panel a. In d and e antigenic sites are coloured grey and the receptor binding site yellow.
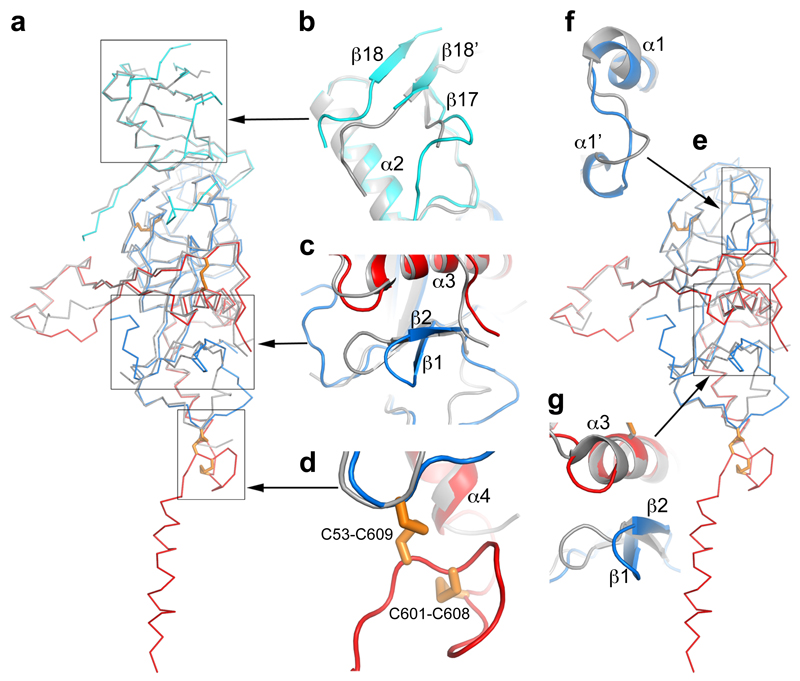
Figure 3. Structure comparisons.
a, Structure of the apo GP monomer compared with the GP of the KZ52 Fab complex. b-d, Details of the structural differences at the glycan cap (b), β1-β2 hairpin (c) and the CX6CC motif (d). The apo GP is coloured as in Fig. 1a, the GP in complex with Fab grey. e, Comparison of apo GP with GP from the GP-receptor complex shown in same style as a. f-g, close up views of the major structural differences at α1’ and α1 helices (f), and β1-β2 hairpin (g).
319 out of 394 Cαs in our apo GP structure match with the GP–Fab complex8 with an rmsd of 1.1 Å (Fig. 3a-d), however there are significant differences, beyond the CHR and CX6CC motif. The β1-β2 hairpin interacts directly with the KZ52 Fab and is pushed 6 Å inwards in the Fab complex (Fig. 3c). The glycan cap is better ordered in the apo structure, revealing an extra strand, β18', inserted between β17 and β18, overlapping β18 in the Fab complex but running in the opposite direction (Fig. 3b). Several cross-reactive neutralizing mAbs from EBOV survivors bind to the cap25, suggesting that this conserved epitope is important for antibody-mediated clearance of the virus. Our structure defines this conformational epitope.
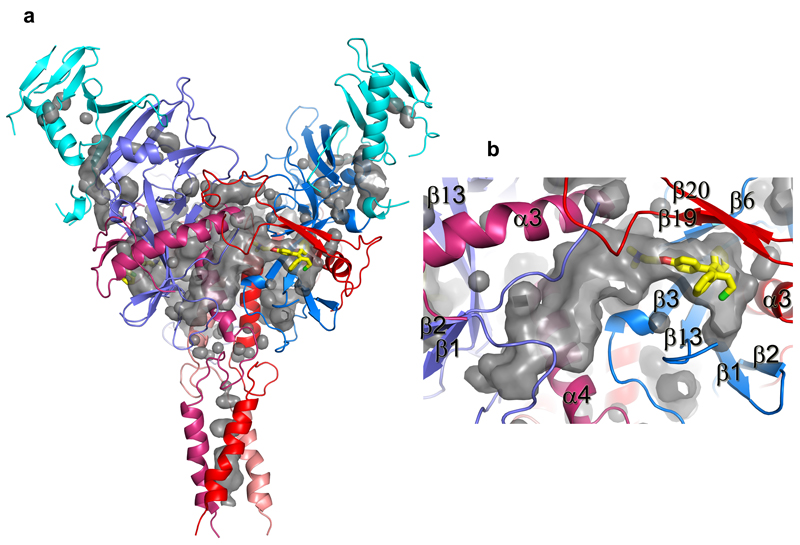
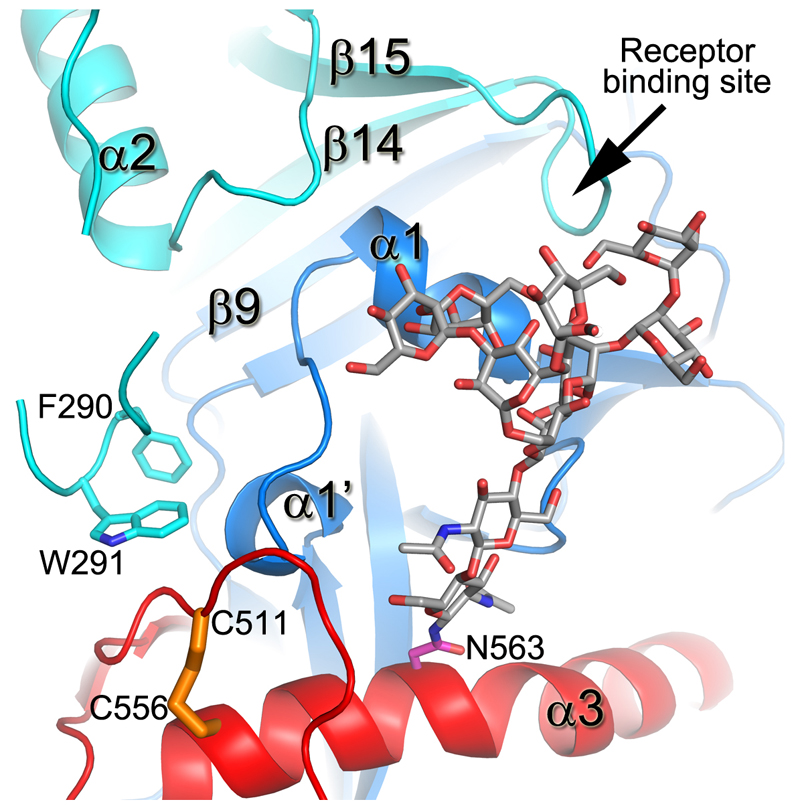
230 Cαs of our apo GP (excluding the glycan cap) overlay with the GP in the NPC1 receptor complex9 with an rmsd of 0.9 Å (Fig. 3e). NPC1 binding draws helix α1 ~2 Å towards the receptor, causing the preceding 310-helix α1' to unwind, disrupting interactions with α3 of GP2, as described previously9 (Fig. 3f). These structural changes also break hydrogen bonds from α1' to the amide groups of residues K510 and N512, disordering the N-terminal residues 502-507 of GP2. The structural differences continue to the other side of α3. In the NPC-bound structure, the α3 helix starts two residues earlier and the β1-β2 hairpin bends inwards, adapting a conformation similar to that in the KZ52 Fab complex (Fig. 3c,g). In addition, there is a large tunnel between neighbouring monomers (Fig. 4, Extended Data Fig. 4), whose hydrophobic entrance is formed by surrounding residues from the β1-β2 hairpin, β3, β6 and β13 of GP1, and α3, β19 and β20 of GP2. Residues 192-195 (with sequence DFFS, and named DFF lid thereafter) form a tight turn with F193 and F194 plugging the entrance of the tunnel and making tight interactions with β19 and β20 (Fig. 4a and Extended Data Fig. 5a). This structure may also hold the putative cleavage site residue 190 in position (Extended Data Fig. 5a) – in the endosome the glycan cap is cleaved to free the receptor-binding site of GP125–29, which also exposes the entrance of the tunnel. Receptor binding is proposed to trigger unwinding of GP2 from GP1 and subsequently lead to membrane fusion23. The above structural changes resulting from receptor binding probably all contribute to weaken GP1-GP2 interactions. Both α1' and α1 are shielded by residues 287-293 and the N563 glycan (which is resistant to enzymatic deglycosylation), perhaps preventing premature release of GP2 (Extended Data Fig. 6).
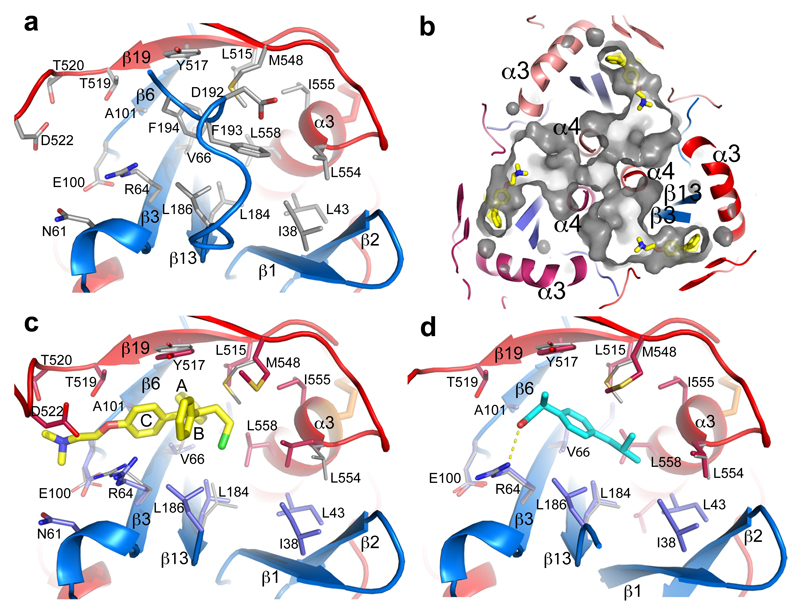
Figure 4. Inhibitor binding site.
a, Details of the inhibitor biding site in the apo GP. The backbone is shown as ribbons with GP1 in blue and GP2 in red, side-chains as grey sticks. b, Tunnels of the GP trimer viewed along the 3-fold axis towards the viral membrane. Toremifenes bound at the entrances of the tunnels are shown as yellow sticks. c, Details of protein-inhibitor interactions of the GP-toremifene complex, and d, GP-ibuprofen complex. Toremifen is shown as yellow sticks, ibuprofen as cyan sticks. Protein main-chains are shown as ribbons and side-chains as sticks (GP1 blue, GP2 red). Side-chains in the apo structure with large conformational changes are shown as thinner grey sticks.
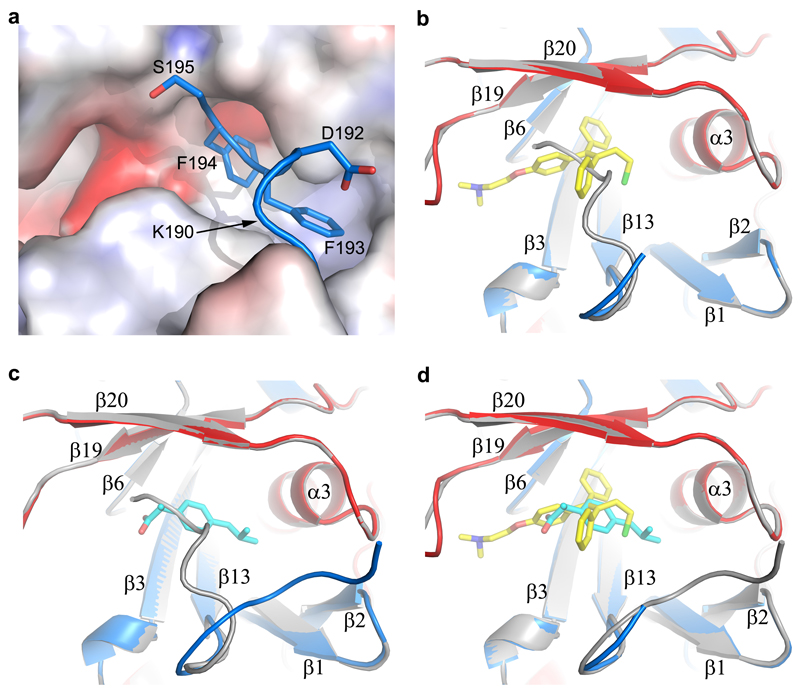
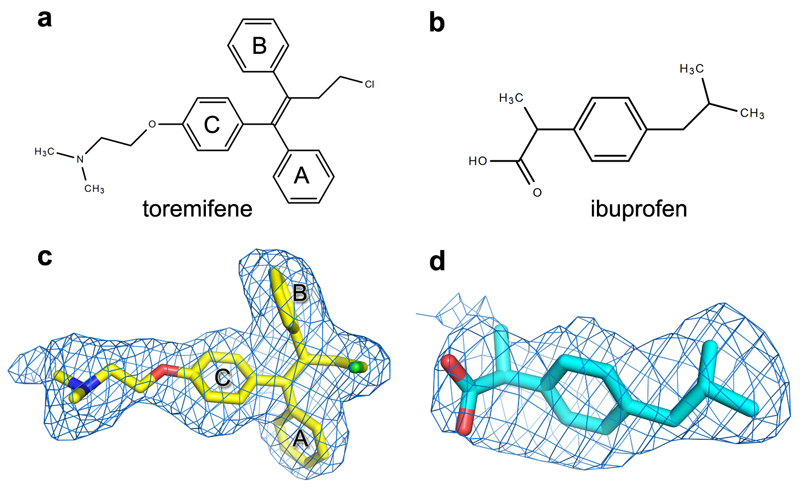
Structures of GP-toremifene and GP-ibuprofen complexes were obtained by crystal soaking and refined to 2.7 Å resolution (Extended Data Table 1). Both inhibitors have well defined electron density and bind at same site at the entrance of the large tunnel by expelling the DFF lid (Fig. 4 and Extended Data Figs. 4-5, 7). In addition to the tunnel entrance residues already mentioned, the tunnel is lined by residues from the N-terminal loop, the β1-β2 hairpin, β2-β3 loop of GP1, and α3 and α4 of GP2 from a neighbouring monomer, and interconnected with the other two tunnels in the trimer at the 3-fold axis (Fig. 4b and Extended Data Fig. 4). Y517 makes dominant interactions with toremifene by contacting all three phenyl rings (Fig. 4c). In addition, phenyl ring A of toremifene is fully buried and interacts with V66, L68, L515 and L558, ring B with L186, and ring C with V66 and A101. The ethyl chloride group interacts with L184, L186, M548 and L558, whilst the dimethylethanamine group points towards the main tunnel and is surrounded by polar/charged residues, including R64, E100, T519, T520 and D522 (Fig. 4c).
Ibuprofen is bound with its isobutyl group partially overlapping the ethyl chloride group of the toremifene but closer to L554. However, its phenyl ring does not overlap any of the rings of toremifene (Extended Data Fig. 5), but makes extensive interactions with M548 (Fig. 4d). The propanoic acid moiety is orientated to make a hydrogen bond to the side-chain of R64 and hydrophobic interactions with Y517. Remarkably ibuprofen was initially suggested to interact with EBOV GP by in silico screening, and predicted to dock in a pocket of the mucin domain12. A racemic mixture of ibuprofen was used for all experiments, however we note that the S-isomer (which is also active as a painkiller) binds preferentially.
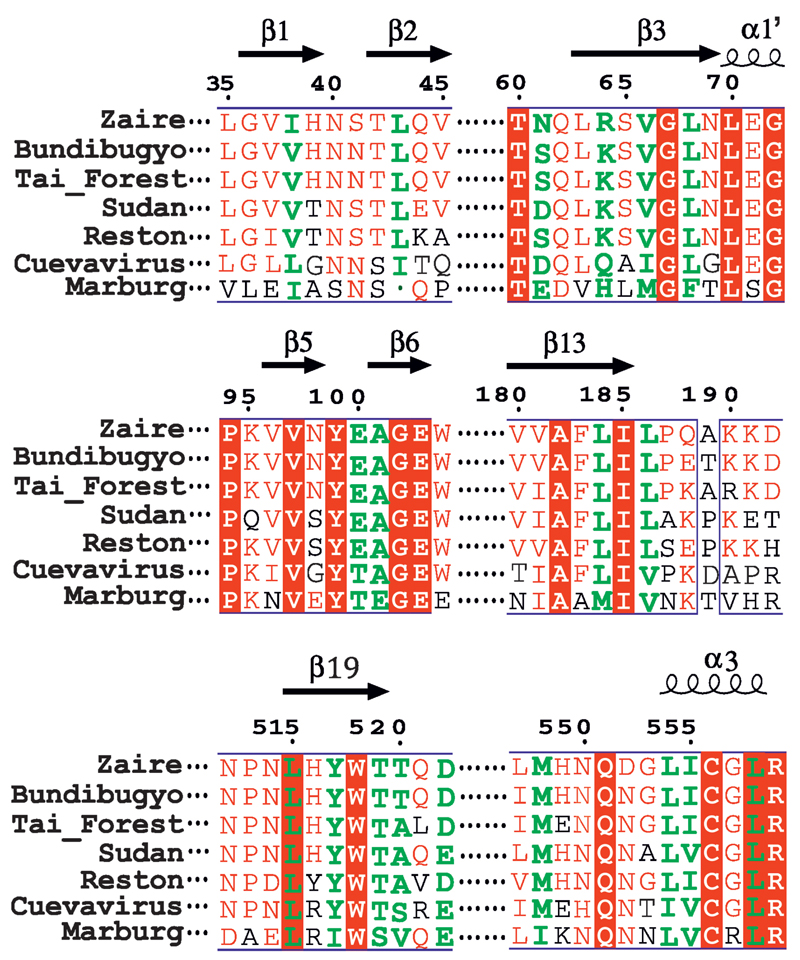
The flexible region, 521-526, of the fusion loop is stabilized in the two inhibitor-bound structures, but in different conformations compared to apo GP. The most significant conformation changes induced by toremifene are at side-chains of M548 and L554, and M548 by ibuprofen (Fig. 4). The residues involved in inhibitor binding are highly conserved across filoviruses, with the exception of MARV (Extended Data Fig. 8), where the DFF lid and its preceding loop are replaced by a helix, and V66 and A101 are substituted by M50 and E85 respectively, partially blocking the binding site30.
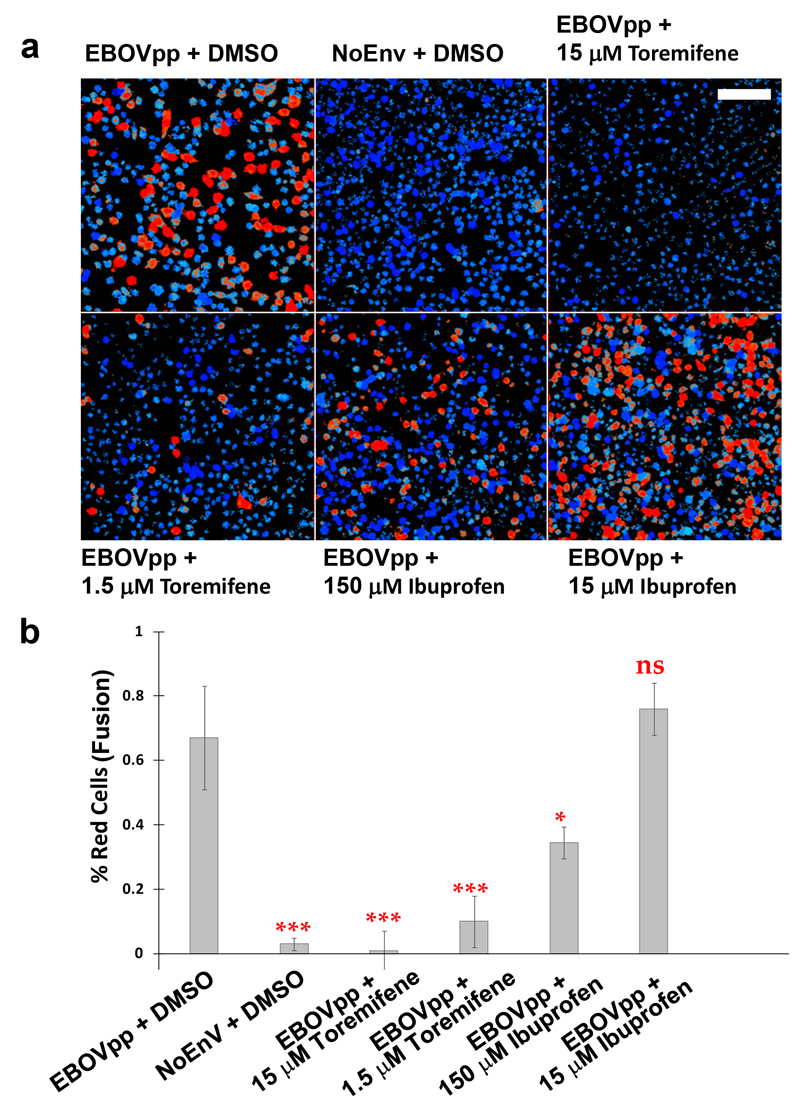
The SERMs tamoxifen, 4-hydroxytamoxifen and clomiphene are less potent inhibitors, despite their chemical similarity to toremifene14,15. Compared to the ethyl chloride group of toremifene, the corresponding ethyl group in tamoxifen and chlorine in clomiphene are expected to make weaker interactions with L184, L186, M548 and L558. A partially bound 4-hydroxytamoxifen structure obtained by crystal soaking (data not shown) shows the hydroxyl group makes close contacts with G67, shifting the whole inhibitor ~1.0 Å towards the solvent, weakening ring stacking interactions with Y517 and having no contacts from the ethyl group to L184, L186 and L558 compared to toremifene. Our crystallographic results are in line with the inhibition data14–16 and our thermal shift assay (Extended Data Fig. 1e,f). If Toremifene and ibuprofen inhibit viral infection by causing premature conversion of GP to the post-fusion conformation or blocking receptor binding we would expect them to abolish viral fusion. This was confirmed by measuring their effect on the fusion of EBOV GP pseudoviruses as judged by a beta-lactamase reporter assay (Extended Data Fig. 9). Benztropine, which decreases the Tm of GP by 4 °C, could not be soaked in our crystals, and needs further investigation (Extended Data Fig. 1f).
Our results pinpoint the binding site of toremifene and ibuprofen on the surface of the GP and reveal that they decrease the stability of the viral GP, and prevent viral fusion. The binding site is different to that predicted for ibuprofen12, and the information on the binding modes of these compounds and the spare volume at the binding cavity can guide the design of more potent compounds. Finally, our readily grown well diffracting crystals are suitable for fragment-based screening for different classes of binders for the development of new inhibitors to combat EBOV infection.
Methods
Protein cloning, expression and purification
Zaire EBOV (strain Mayinga-76) glycoprotein extracellular domain DNA was synthesized (UniProt entry KB-Q05320). The expression construct GPΔ contains two directly linked sections, amino acids 32-312 and 464-632, with a T42A mutation to eliminate N40 glycosylation. At the N-terminus of the protein, 4 amino acids ETGR were added from the expression vector pNeosec31. At the C-terminus, a foldon trimerization sequence from the bacteriophage T4 fibritin and a 6×His tag were added with the sequence: GSGYIPEAPRDGQAYVRKDGEWVLLSTFLGTHHHHHH. The endotoxin free pNeosec-GPΔ plasmid was transiently transfected into the human embryonic kidney HEK293T (ATCC CRL11268) cells with polyethylenmine (PEI, MW 25kd, Sigma, UK). To inhibit the formation of complex glycosylation, the mannosidase inhibitor kifunensine (Cayman chemical, Michigan, USA) was added to a final concentration of 5 μM. After 5 days of transfection, the conditioned media was collected, dialysed against PBS and incubated with talon beads (Takara Bio Europe SAS, France) at 15°C for 1 hour with gentle shaking. The beads were collected and washed with PBS plus 5-10 mM imidazole. The protein was eluted with 200 mM imidazole in PBS and further purified by size exclusion chromatography with a Superdex 200 HiLoad 16/600 column (GE healthcare, Buckinghamshire, UK) and a buffer of 10 mM MES, pH5.2, 150 mM NaCl.
Thermal shift assay
10 µl of solution containing 2 µM glycosylated EBOV GP protein, buffered by the addition of 10 µl of 850 mM sodium malonate at the desired pH, was mixed with 10 µl of 15× SYPRO Orange dye (Thermo Fisher Scientific, UK), along with 10 µl of 50 µM compound in 10% DMSO or just 10% DMSO. The mixture was made up to a total volume of 50µL. Samples were placed in a semi skirted 96 well PCR plate (4 Titude, Surrey, UK), sealed and heated in an Mx3005p qPCR machine (Stratagene, Agilent Technologies, USA) from 24.5 to 98.5 °C at a rate of 1 °C ·min-1. Fluorescence changes were monitored with excitation and emission wavelengths at 492 and 610 nm respectively. Reference wells, i.e. solutions without chemical, but with same amount of DMSO, were used to compare the melting temperature (Tm). Experiments were carried out in triplicate. Compounds tested included toremifene, tamoxifen, 4-hydroxyltamoxifen, anastrozole, benztropine, clomipramine, ibuprofen, Diacylglycerol kinase inhibitor and Benzodiazepine. The SERMs endoxifen and clomiphene could not be tested since they bind to SYPRO Orange directly.
Ebola pseudovirus production and titration
HIV-1-derived pseudoviruses expressing the Ebola virus envelope Glycoproteins (EBOV pseudoparticle, EBOVpp) were produced as described previously32. HEK-293T cells in T175 flasks were transfected with 2 μg pR8ΔEnv, 2 μg BlaM-Vpr, 1 μg pcREV and 3 μg of plexm-EBOV_GP plasmids (containing Zaire EBOV GP residues 1-676 under control of β-actin/CMV chimeric promoter). After 8 hrs transfection, the medium was replaced by fresh DMEM with 10% FBS. Viral supernatants were harvested and concentrated using the Lenti-X Concentrator (Clontech). Virus titres were determined by infecting TZM-bl cells (PTA-5659, no mycoplasma contamination) with a serial dilution of concentrated pseudovirus followed by a β-Gal assay. Since the TZM-bl cells contain a β-Gal expression cassette with an HIV-1-induced promoter infected cells can be identified through hydrolysis of X-gal33.
BlaM assay and analysis
The β-Lactamase assay33 was applied to assess EBOVpp fusion. 24 hrs prior to the assay TZM-bl cells were plated at 4×10⁴ cells/well in black clear-bottomed 96-well plates. On the day of assay, cells were cooled on ice prior to the addition of EBOVpp (MOI 0.5), then centrifuged at 2100×g for 30 mins at 4 °C. Viral supernatants were removed and cells washed with PBS. Then, 100 μl of DMEM+10% FBS containing toremifene (15 µM or 1.5 µM), ibuprofen (150 µM or 15 µM), or the same amount of solvent for the above compounds (5% DMSO) was added to each well before placing in a 37 °C, CO2 incubator to initiate viral entry. After 120 mins, cells were loaded with 1x CCF2-AM from the LiveBLAzer FRET—B/G Loading Kit (Life Technologies) and incubated at room temperature in the dark for 2 hrs. Following CCF2-AM removal, cells were washed with PBS and fixed with 2% PFA prior to viewing. Cells were excited using a 405 nm continuous laser (Leica, Manheim) and the emission spectra between 430–560 nm recorded pixel by pixel (512 × 512) using a Leica SP8 X-SMD microscope with a 20X objective. The ratio of blue emission (440–480 nm, cleaved CCF2-AM) to green (500–540 nm, un-cleaved CCF2-AM) was then calculated pixel by pixel using a customized macro34 for ImageJ (http://imagej.nih.gov/ij/) with ten different observation fields for each condition. A blue/green threshold (fusion threshold) was set using HIVNoEnv virions containing Vpr-BlaM as a background control to provide a fusion detection limit that corresponded to 0.75 +/- 0.05 BlaM ratio. The fusion threshold was calculated recovering the signal (blue/green intensity ratio) coming from individual cells plus 2x SD from ~200 cells in the observation field. This threshold was then applied to all conditions. Cells above the threshold where pseudocolored in red and cells below the threshold pseudocolored in blue. "Red" cells where then counted versus blue cells (non-fusogenic) as an accurate measure of fusion in different conditions.
Crystallization and inhibitor soaking
For crystallization, the GP was treated with Endo-β-acetylglucosaminidase F1 at 37 °C for 1 hour, further purified with size exclusion chromatography and concentrated to 10-12 mg/ml. Crystallization screen experiments were carried out using the nanolitre sitting-drop vapour diffusion method in 96-well plates as previously described35. Crystals were initially obtained from Hampton Research PEGRx™ 1 screen, condition 37 containing 10% (w/v) PEG 6,000 and 0.1 M Sodium citrate tribasic dihydrate (pH 5.0). The best crystals were grown in optimized condition containing 9% (w/v) PEG 6,000 and 0.1 M Sodium citrate tribasic dihydrate at pH 5.2.
To obtain GP–inhibitor complexes, crystal soaking experiments were performed. Crystal soaking solutions were prepared by first dissolving the inhibitors in 100% DMSO and then diluting with 15% (w/v) PEG 6,000 and 0.1 M Sodium citrate tribasic dihydrate (pH 5.0) to a final DMSO concentration of 10%. The inhibitor concentration was typically from 1 to 10 mM depending on solubility. Crystals were soaked in the above solutions for between 20 minutes and 5 hours. Crystals soaked for longer normally diffracted less well and the crystals from which the GP-toremifene and GP-ibuprofen complex structures were obtained were only soaked for 20 minutes.
Data collection and structure determination
Crystals were cryo-protected using solutions containing 75% crystallization liquor (or inhibitor soaking solution) and 25% (v/v) glycerol and frozen in liquid nitrogen prior to data collection. All data were collected from frozen crystals at 100 K. Data were acquired as 0.1° images on PILATUS 6M detectors at Diamond Light Source, UK, using beamline I03 for native data (exposure time 0.1 s per frame, beam size 80×20 μm and 30% beam transmission), and I02 for inhibitor soaked crystals (exposure time 0.05 s per frame, beam size 90×25 μm and 40% beam transmission). Diffraction images were indexed, integrated and scaled with the automated data processing program Xia2-3dii36. The native data set was collected from four crystals to 2.23 Å resolution with 58-fold redundancy. A total of 7 inhibitors were soaked, including toremifene, tamoxifen, 4-hydroxyltamoxifen, raloxifene, clomiphene, ibuprofen and benztropine, and diffraction data were collected with resolutions ranging from 3.5 to 2.3 Å.
The crystals belong to space group R32 with unit cell dimensions a = b = 114.0 Å and c = 307.0 Å approximately. The apo structure was determined by molecular replacement with MOLREP37 using the GP structure of the GP-KZ52 Fab complex (PDB ID, 3CSY) as a search model. There is one GP molecule in the crystal asymmetric unit. The biological trimer is formed by a crystallographic 3-fold axis. Structure refinement used REFMAC38 and models were rebuilt with COOT39. The apo structure was refined to 2.23 Å resolution with an Rwork of 0.223 (Rfree, 0.251) and good stereochemistry. Close examination of the data from inhibitor soaked crystals showed that only toremifene and ibuprofen were fully bound with GP, and structures were refined to resolutions of 2.69 Å and 2.68 Å, respectively. 4-hydroxyltamoxifen was only bound with partial occupancy (data not shown). Data collection and structure refinement statistics are given in Table 1. Structural comparisons used SHP40, figures were prepared with PyMOL41.
Extended Data
Extended Data Figure 1. Thermal shift essay.
Representative thermal melt curves of EBOV GP with 10 µM compounds and 2% DMSO. a-d, Melt curves of EBOV GP with toremifene, ibuprofen or protein alone at pH 5.0, pH 6.0, pH 7.0 and pH 8.0 respectively. e, Small effects of SERM inhibitors tamoxifen, 4-hydroxytamoxifen and raloxifen on the melting temperature of EBOV GP shown at pH 5.2. f, Melt curves of EBOV GP with diaglycerol kinase inhibitor, anastrozole and benztropine mesylate at pH5.2. g, h, Shifts in melting temperature (ΔTm °C in absolute value) were plotted against different concentrations of toremifene (g) or ibuprofen (h) at pH 5.2. Data are mean ± s.d. (n=4). The affinity constant Kd is calculated by a ligand binding 1:1 saturation fitting with the SigmaPlot version 13 (Systat Software Inc).
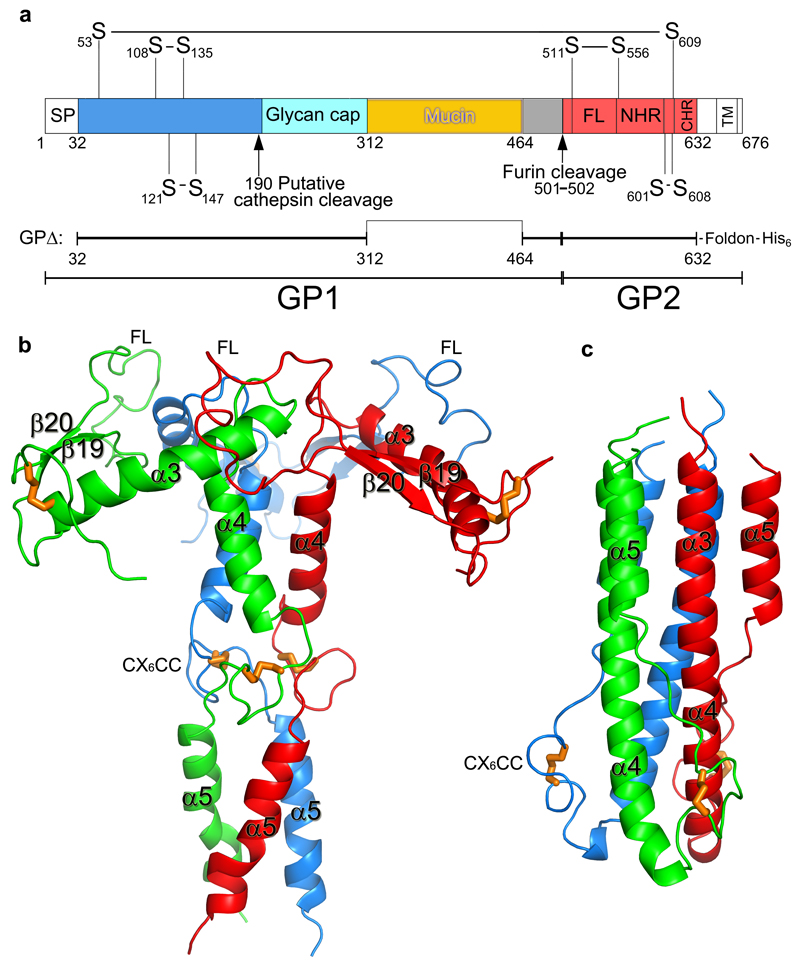
Extended Data Figure 2. Structural organization of EBOV GP and GP2 structure.
a, Scheme showing the structural organization of EBOV GP. SP, signal peptide; FL, fusion loop; NHR and CHR, N- and C-terminal heptad repeats; TM, trans-membrane helix. The construct GPΔ used for structure determination is made by deleting residues 313-463 of the GP mucin domain and residues 633-676. Residue 312 is directly linked to 464. A foldon trimerization peptide and a 6×His tag are added at the C-terminus. b, The GP2 trimer in the prefusion state (current structure). The trimer is shown as cartoon representation with the monomers coloured in red, green and blue, respectively. Disulphide bonds are drawn as orange sticks. c, The six-helix bundle of GP2 in the post fusion state.
Extended Data Figure 3. The fusion loop.
a, The fusion loop that connects β19 and β20 of GP2 projects onto a shallow depression on the surface of a neighbouring monomer. The fusion loop is shown as a red coil with side-chains drawn as grey sticks, the neighbouring monomer is shown in semi-transparent surface representation. b, Comparison of the fusion loop in the apo GP (red and grey) obtained at pH 5.2 with that in the KZ52 Fab complex (cyan) obtained at pH 8.3.
Extended Data Figure 4. Pockets and tunnels in EBOV GP trimer.
a, The several small pockets and three large tunnels in the GP trimer shown as grey surfaces. Protein backbones are drawn as ribbons and coloured as in Fig. 2 of the main text. A toremifene is bound at the entrance of each large tunnel and shown as yellow sticks. b, Close up view of a tunnel. Each tunnel is bordered by secondary structure elements from two neighbouring monomers.
Extended Data Figure 5. The inhibitor binding site.
a, The DFF lid (residues 192-194, blue coil for main-chain and sticks for side-chains) nestles at the entrance of the large tunnel in the apo structure. The rest of the protein is shown as an electrostatic surface. The putative cathepsin cleavage site at residue 190 is indicated by an arrow. b-c, Toremifene (yellow sticks in b) and ibuprofen (cyan sticks in c) bind at same site by expelling the DFF lid. In both panels, the inhibitor bound structure is shown in blue (GP1) and red (GP2), the apo GP in grey. d, Comparing the binding modes of toremifene and ibuprofen. The toremifene bound structure is shown in blue and red, the ibuprofen bound structure in grey.
Extended Data Figure 6. The environment of α1’ and α1 helices.
The surfaces of α1’ and α1 helices, which undergo large conformational changes upon receptor binding, are protected by the 287-293 loop from the glycan cap domain and the N563 glycan from GP2 in the apo GP. The glycan is modelled as Man9GlcNAc2.
Extended Data Figure 7. Chemical structures and electron density maps.
a-b, The chemical structures of toremifene (a) and ibuprofen (b). c-d, |Fo-Fc| omit electron density maps for toremifene (c) and ibuprofen (d) contoured at 3σ.
Extended Data Figure 8. Sequence alignment of filovius GPs.
Amino acid sequence alignment of 7 filovirus GPs around the inhibitor binding site. The amino acids that form contacts with toremifene or ibuprofen are coloured in green. Numbering corresponds to the full length Zaire EBOV GP, conserved residues are shown in a red background. Secondary structure elements are labelled on the top.
Extended Data Figure 9. Toremifene and ibuprofen inhibit fusion of Ebola GP pseudovirus particles.
a, CCF2-loaded TZM-bl cells were exposed to EBOV pseudoparticles (EBOVpp) or control particles lacking envelope proteins (NoENV) at 4 °C to synchronise binding and receptor engagement before fusion was initiated by shifting cells to 37 °C in the presence of Toremefine (15 µM and 1.5 µM), Ibuprofen- (150 µM and 15 µM), or just the compounds solvent (5 % DMSO). After 2h incubation, cells were loaded with the CCF2-AM FRET biosensor, fixed and the ratio of blue (440–480 nm, cleaved CCF2-AM) to green (500–540 nm, un-cleaved CCF2-AM) fluorescence measured. Cells are pseudocolored according to this ratio: blue represents no fusion, red represents fusion. Scale bar: 80 µm. b, The percentage of fusogenic cells (red versus blue) was calculated taking the average max value coming from the negative control as a threshold for fusion, data are means ± s.d. (n=10). Analysis used an unpaired t test and compared to the EBOV + DMSO control, where ns (not significant) = P > 0.05, * = P ≤ 0.05and *** = P ≤ 0.001. Error bars represent standard deviations.
Extended Data Table 1. Data collection and refinement statistics.
| Native GP | GP-toremifene | GP-ibuprofen | |
|---|---|---|---|
| Data collection | |||
| Space group | R32 | ||
| Cell dimensions | |||
| a, b, c (Å) | 114.3, 114.3, 307.4 | 113.5, 113.5, 306.9 | 113.8, 113.8, 306.2 |
| α, β γ (°) | 90, 90, 120 | 90, 90, 120 | 90, 90, 120 |
| Resolution (Å) | 94.2–2.23 (2.29–2.23)* | 51.2–2.69 (2.76–2.69) | 82.8–2.68 (2.75–2.68) |
| Rmerge | 0.204(---) | 0.079 (---) | 0.143 (---) |
| I / σI | 17.4(1.3) | 20.0 (1.9) | 14.7(1.5) |
| Completeness (%) | 100(100) | 99.9 (100) | 99.9(100) |
| Redundancy | 57.8(15.4) | 9.8 (8.6) | 9.8(8.3) |
| Refinement | |||
| Resolution (Å) | 94.2–2.23 | 51.2–2.68 | 82.8–2.68 |
| No. reflections | 36035/1865 | 20449/1090 | 20734/1107 |
| Rwork / Rfree | 0.226/0.241 | 0.201/0.245 | 0.199/0.235 |
| No. atoms | |||
| Protein | 3129 | 3034 | 3025 |
| Ligand/glycan/ion | 143 | 151 | 140 |
| Water | 119 | 53 | 73 |
| B-factors | |||
| Protein | 39 | 62 | 55 |
| Ligand/glycan/ion | 99 | 115 | 96 |
| Water | 54 | 70 | 55 |
| R.m.s. deviations | |||
| Bond lengths (Å) | 0.007 | 0.007 | 0.007 |
| Bond angles (°) | 1.3 | 1.3 | 1.3 |
Values in parentheses are for highest-resolution shell.
Acknowledgments
We thank Diamond scientists at I02 and I03 for assistance with data collection, Dr. T.S. Walter for help with crystallization and thermal shift essay. Y.Z. were supported by the Biostruct-X project (283570) funded by the EU seventh Framework Programme (FP7), J.R. by the Wellcome Trust and D.I.S., E.E.F. and K.H. by the UK Medical Research Council (MR/N00065X/1). This is a contribution from the UK Instruct Centre. The Wellcome Trust Centre for Human Genetics is supported by the Wellcome Trust (grant 090532/Z/09/Z). A.Z. is supported by a Marie Curie Fellowship (658363), T.A.B. is supported by the MRC (MR/L009528/1). We thank the Cellular Imaging Core from the Wellcome Trust Centre for Human Genetics. SP-P is funded by a Nuffield Department of Medicine Leadership Fellowship. DIS is a Jenner Investigator.
Footnotes
Author Contributions Y.Z., J.R. and D.I.S designed the project. Y.Z. made the protein and grew the crystals together with J.R. collected X-ray data and determined the structures. K.H. helped with crystal mounting and data collection. D.M.J. and S.P. carried out cell imaging experiment. A.Z. and T.A.B. provided the cDNA. Y.Z., J.R., E.E.F. and D.I.S. analysed the results and wrote the manuscript in discussions with all authors.
Author Information The coordinates and structure factors have been deposited with the RCSB Protein Data Bank under accession codes 5JQ3, 5JQ7 and 5JQB for the native GP, GP-toremifene and GP-ibuprofen, respectively. Reprints and permissions information is available at www.nature.com/reprints. The authors declare no competing financial interests. Readers are welcome to comment on the online version of the paper.
Potential Conflict of Interests D.I.S., T.A.B. and A.Z. are listed as inventors on the International Patent Application No. PCT/GB2016/050321 ‘Filovirus therapy’.
References
- 1.Takada A, et al. A system for functional analysis of Ebola virus glycoprotein. Proc Natl Acad Sci U S A. 1997;94:14764–14769. doi: 10.1073/pnas.94.26.14764. [DOI] [PMC free article] [PubMed] [Google Scholar]
- 2.Hacke M, et al. Inhibition of Ebola virus glycoprotein-mediated cytotoxicity by targeting its transmembrane domain and cholesterol. Nat Commun. 2015;6:7688. doi: 10.1038/ncomms8688. [DOI] [PubMed] [Google Scholar]
- 3.Aleksandrowicz P, et al. Ebola virus enters host cells by macropinocytosis and clathrin-mediated endocytosis. J Infect Dis. 2011;204(Suppl 3):S957–967. doi: 10.1093/infdis/jir326. [DOI] [PMC free article] [PubMed] [Google Scholar]
- 4.Carette JE, et al. Ebola virus entry requires the cholesterol transporter Niemann-Pick C1. Nature. 2011;477:340–343. doi: 10.1038/nature10348. [DOI] [PMC free article] [PubMed] [Google Scholar]
- 5.Cote M, et al. Small molecule inhibitors reveal Niemann-Pick C1 is essential for Ebola virus infection. Nature. 2011;477:344–348. doi: 10.1038/nature10380. [DOI] [PMC free article] [PubMed] [Google Scholar]
- 6.Nanbo A, et al. Ebolavirus is internalized into host cells via macropinocytosis in a viral glycoprotein-dependent manner. PLoS Pathog. 2010;6:e1001121. doi: 10.1371/journal.ppat.1001121. [DOI] [PMC free article] [PubMed] [Google Scholar]
- 7.Saeed MF, Kolokoltsov AA, Albrecht T, Davey RA. Cellular entry of ebola virus involves uptake by a macropinocytosis-like mechanism and subsequent trafficking through early and late endosomes. PLoS Pathog. 2010;6:e1001110. doi: 10.1371/journal.ppat.1001110. [DOI] [PMC free article] [PubMed] [Google Scholar]
- 8.Lee JE, et al. Structure of the Ebola virus glycoprotein bound to an antibody from a human survivor. Nature. 2008;454:177–182. doi: 10.1038/nature07082. [DOI] [PMC free article] [PubMed] [Google Scholar]
- 9.Wang H, et al. Ebola Viral Glycoprotein Bound to Its Endosomal Receptor Niemann-Pick C1. Cell. 2016;164:258–268. doi: 10.1016/j.cell.2015.12.044. [DOI] [PMC free article] [PubMed] [Google Scholar]
- 10.Dias JM, et al. A shared structural solution for neutralizing ebolaviruses. Nat Struct Mol Biol. 2011;18:1424–1427. doi: 10.1038/nsmb.2150. [DOI] [PMC free article] [PubMed] [Google Scholar]
- 11.WHO. Ebola Situation Reports. 2016 http://www.who.int/csr/disease/ebola/situation-reports/en/
- 12.Veljkovic V, et al. In silico analysis suggests repurposing of ibuprofen for prevention and treatment of EBOLA virus disease. F1000Res. 2015;4:104. doi: 10.12688/f1000research.6436.1. [DOI] [PMC free article] [PubMed] [Google Scholar]
- 13.Edwards MR, et al. High-Throughput Minigenome System for Identifying Small-Molecule Inhibitors of Ebola Virus Replication. ACS Infect Dis. 2015;1:380–387. doi: 10.1021/acsinfecdis.5b00053. [DOI] [PMC free article] [PubMed] [Google Scholar]
- 14.Johansen LM, et al. FDA-approved selective estrogen receptor modulators inhibit Ebola virus infection. Sci Transl Med. 2013;5:190ra179. doi: 10.1126/scitranslmed.3005471. [DOI] [PMC free article] [PubMed] [Google Scholar]
- 15.Johansen LM, et al. A screen of approved drugs and molecular probes identifies therapeutics with anti-Ebola virus activity. Sci Transl Med. 2015;7:290ra289. doi: 10.1126/scitranslmed.aaa5597. [DOI] [PubMed] [Google Scholar]
- 16.Kouznetsova J, et al. Identification of 53 compounds that block Ebola virus-like particle entry via a repurposing screen of approved drugs. Emerg Microbes Infect. 2014;3:e84. doi: 10.1038/emi.2014.88. [DOI] [PMC free article] [PubMed] [Google Scholar]
- 17.Lea WA, Simeonov A. Differential scanning fluorometry signatures as indicators of enzyme inhibitor mode of action: case study of glutathione S-transferase. PLoS One. 2012;7:e36219. doi: 10.1371/journal.pone.0036219. [DOI] [PMC free article] [PubMed] [Google Scholar]
- 18.Cimmperman P, et al. A quantitative model of thermal stabilization and destabilization of proteins by ligands. Biophys J. 2008;95:3222–3231. doi: 10.1529/biophysj.108.134973. [DOI] [PMC free article] [PubMed] [Google Scholar]
- 19.Cheng H, et al. Inhibition of Ebola and Marburg Virus Entry by G Protein-Coupled Receptor Antagonists. J Virol. 2015;89:9932–9938. doi: 10.1128/JVI.01337-15. [DOI] [PMC free article] [PubMed] [Google Scholar]
- 20.Brecher M, et al. Cathepsin cleavage potentiates the Ebola virus glycoprotein to undergo a subsequent fusion-relevant conformational change. J Virol. 2012;86:364–372. doi: 10.1128/JVI.05708-11. [DOI] [PMC free article] [PubMed] [Google Scholar]
- 21.Zhao Y, Ren J, Harlos K, Stuart DI. Structure of glycosylated NPC1 luminal domain C reveals insights into NPC2 and Ebola virus interactions. FEBS Lett. 2016 doi: 10.1002/1873-3468.12089. [DOI] [PMC free article] [PubMed] [Google Scholar]
- 22.Jeffers SA, Sanders DA, Sanchez A. Covalent modifications of the ebola virus glycoprotein. J Virol. 2002;76:12463–12472. doi: 10.1128/JVI.76.24.12463-12472.2002. [DOI] [PMC free article] [PubMed] [Google Scholar]
- 23.Weissenhorn W, Carfi A, Lee KH, Skehel JJ, Wiley DC. Crystal structure of the Ebola virus membrane fusion subunit, GP2, from the envelope glycoprotein ectodomain. Mol Cell. 1998;2:605–616. doi: 10.1016/s1097-2765(00)80159-8. [DOI] [PubMed] [Google Scholar]
- 24.Gregory SM, et al. Structure and function of the complete internal fusion loop from Ebolavirus glycoprotein 2. Proc Natl Acad Sci U S A. 2011;108:11211–11216. doi: 10.1073/pnas.1104760108. [DOI] [PMC free article] [PubMed] [Google Scholar]
- 25.Flyak AI, et al. Cross-Reactive and Potent Neutralizing Antibody Responses in Human Survivors of Natural Ebolavirus Infection. Cell. 2016;164:392–405. doi: 10.1016/j.cell.2015.12.022. [DOI] [PMC free article] [PubMed] [Google Scholar]
- 26.Chandran K, Sullivan NJ, Felbor U, Whelan SP, Cunningham JM. Endosomal proteolysis of the Ebola virus glycoprotein is necessary for infection. Science. 2005;308:1643–1645. doi: 10.1126/science.1110656. [DOI] [PMC free article] [PubMed] [Google Scholar]
- 27.Dube D, et al. The primed ebolavirus glycoprotein (19-kilodalton GP1,2): sequence and residues critical for host cell binding. J Virol. 2009;83:2883–2891. doi: 10.1128/JVI.01956-08. [DOI] [PMC free article] [PubMed] [Google Scholar]
- 28.Hood CL, et al. Biochemical and structural characterization of cathepsin L-processed Ebola virus glycoprotein: implications for viral entry and immunogenicity. J Virol. 2010;84:2972–2982. doi: 10.1128/JVI.02151-09. [DOI] [PMC free article] [PubMed] [Google Scholar]
- 29.Schornberg K, et al. Role of endosomal cathepsins in entry mediated by the Ebola virus glycoprotein. J Virol. 2006;80:4174–4178. doi: 10.1128/JVI.80.8.4174-4178.2006. [DOI] [PMC free article] [PubMed] [Google Scholar]
- 30.Hashiguchi T, et al. Structural basis for Marburg virus neutralization by a cross-reactive human antibody. Cell. 2015;160:904–912. doi: 10.1016/j.cell.2015.01.041. [DOI] [PMC free article] [PubMed] [Google Scholar]
- 31.Zhao Y, Ren J, Padilla-Parra S, Fry EE, Stuart DI. Lysosome sorting of beta-glucocerebrosidase by LIMP-2 is targeted by the mannose 6-phosphate receptor. Nat Commun. 2014;5:4321. doi: 10.1038/ncomms5321. [DOI] [PMC free article] [PubMed] [Google Scholar]
- 32.Desai TM, et al. IFITM3 restricts influenza A virus entry by blocking the formation of fusion pores following virus-endosome hemifusion. PLoS Pathog. 2014;10:e1004048. doi: 10.1371/journal.ppat.1004048. [DOI] [PMC free article] [PubMed] [Google Scholar]
- 33.Cavrois M, De Noronha C, Greene WC. A sensitive and specific enzyme-based assay detecting HIV-1 virion fusion in primary T lymphocytes. Nat Biotechnol. 2002;20:1151–1154. doi: 10.1038/nbt745. [DOI] [PubMed] [Google Scholar]
- 34.Jones DM, Padilla-Parra S. Imaging real-time HIV-1 virion fusion with FRET-based biosensors. Sci Rep. 2015;5:13449. doi: 10.1038/srep13449. [DOI] [PMC free article] [PubMed] [Google Scholar]
- 35.Walter TS, et al. A procedure for setting up high-throughput nanolitre crystallization experiments. Crystallization workflow for initial screening, automated storage, imaging and optimization. Acta Crystallogr D Biol Crystallogr. 2005;61:651–657. doi: 10.1107/S0907444905007808. [DOI] [PMC free article] [PubMed] [Google Scholar]
- 36.Winter G, Lobley CM, Prince SM. Decision making in xia2. Acta Crystallogr D Biol Crystallogr. 2013;69:1260–1273. doi: 10.1107/S0907444913015308. [DOI] [PMC free article] [PubMed] [Google Scholar]
- 37.Vagin A, Teplyakov A. Molecular replacement with MOLREP. Acta Crystallogr D Biol Crystallogr. 2010;66:22–25. doi: 10.1107/S0907444909042589. [DOI] [PubMed] [Google Scholar]
- 38.Winn MD, Murshudov GN, Papiz MZ. Macromolecular TLS refinement in REFMAC at moderate resolutions. Macromolecular Crystallography, Pt D. 2003;374:300–321. doi: 10.1016/S0076-6879(03)74014-2. [DOI] [PubMed] [Google Scholar]
- 39.Emsley P, Cowtan K. Coot: model-building tools for molecular graphics. Acta Crystallogr D Biol Crystallogr. 2004;60:2126–2132. doi: 10.1107/S0907444904019158. [DOI] [PubMed] [Google Scholar]
- 40.Stuart DI, Levine M, Muirhead H, Stammers DK. Crystal structure of cat muscle pyruvate kinase at a resolution of 2.6 A. J Mol Biol. 1979;134:109–142. doi: 10.1016/0022-2836(79)90416-9. [DOI] [PubMed] [Google Scholar]
- 41.DeLano WL, Lam JW. PyMOL: A communications tool for computational models. Abstracts of Papers of the American Chemical Society. 2005;230:U1371–U1372. [Google Scholar]


