. 2016 Jul 12;5:e15675. doi: 10.7554/eLife.15675

Figure 2. The avian retina contains multiple apocarotenoids that absorb different portions of the light spectrum.

(a) The absorbance spectrum of the major apocarotenoid pigments in the chicken C-type oil droplets. (b) A representative HPLC chromatogram of the apocarotenoids in whole retina extracts of the chicken retina. Apo1 has an absorbance spectrum similar to galloxanthin with more pronounced fine structure, suggesting an ε-ring configuration (Figure 2—figure supplement 2). This pigment is not a major component of the C-type oil droplets (Toomey et al., 2015). (c) The proposed chemical structure of dihydrogalloxanthin and known structure of galloxanthin with the positon of the 11’,12’ double bond indicated.

DOI: http://dx.doi.org/10.7554/eLife.15675.004

Figure 2.

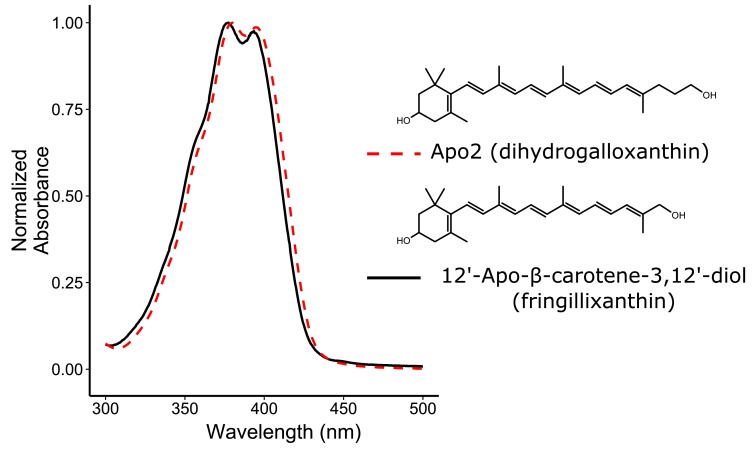
Figure 2—figure supplement 1. The absorbance spectra of Apo2 and 12'-Apo-β-carotene-3,12'-diol (fringillixanthin) are nearly identical.

Figure 2—figure supplement 1.

A comparison of the UV-Vis spectrum and chemical structure of Apo2 (dihydrogalloxanthin) and 3-OH-apo-12’-carotenol (fringillixanthin).

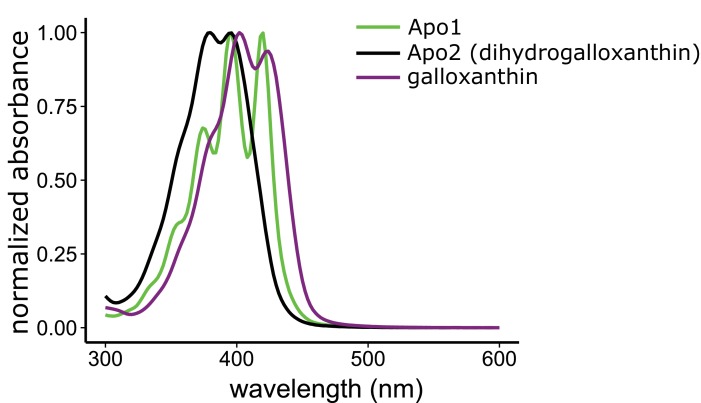
Figure 2—figure supplement 2. The three major apocarotenoids present in the avian retina have distinct light absorbance spectra.

Figure 2—figure supplement 2.

The UV-Vis absorbance spectra of the three apocarotenoids observed in the chicken retina by HPLC analysis. The structure of apo1 is not known. However, the deeply fingered fine structure of the spectrum is consistent with that of an apocarotenoid containing an ε-bond configuration in the terminal ring.

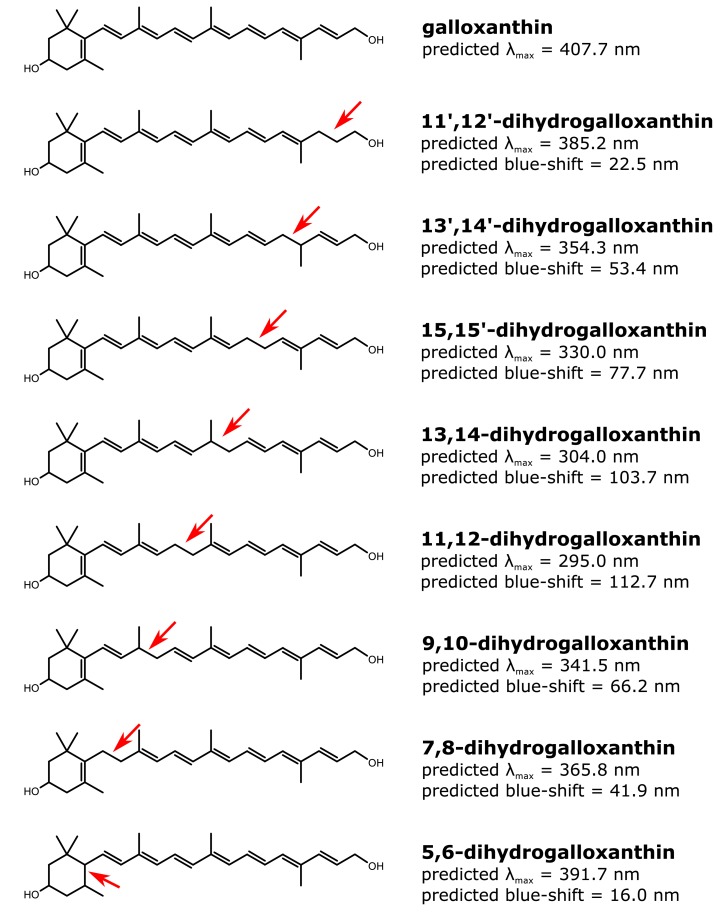
Figure 2—figure supplement 3. The structure and predicted wavelength of maximum absorbance for galloxanthin and the eight possible monosaturated forms of galloxanthin.

Figure 2—figure supplement 3.

The wavelength of maximum absorbance (λmax) was predicted using the Woodward-Fieser for molecules with conjugated systems of four double bonds or less and the Fieser-Kuhn rule for all others. The blue-shift of the λmax relative to the predicted λmax of galloxanthin is given for each monosaturated structure.

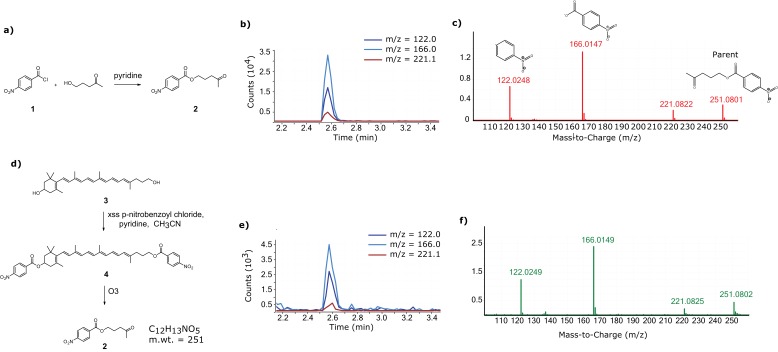
Figure 2—figure supplement 4. Confirmation of the 11’,12’ saturation of dihydrogalloxanthin via derivatization and ozonolysis.

Figure 2—figure supplement 4.

(a) The reaction scheme for the synthesis of the standard for the expected product of the derivatization and ozonolysis of dihydrogalloxanthin. (b) The LC-MS chromatogram and (c) MS:MS spectra of the standard. (d) The reaction scheme for the derivatization and ozonolysis of dihydrogalloxanthin. (e) The LC-MS chromatogram and (f) MS:MS spectra of the product of Apo2 derivatization and ozonolysis.