. 2016 Jul 12;5:e15675. doi: 10.7554/eLife.15675

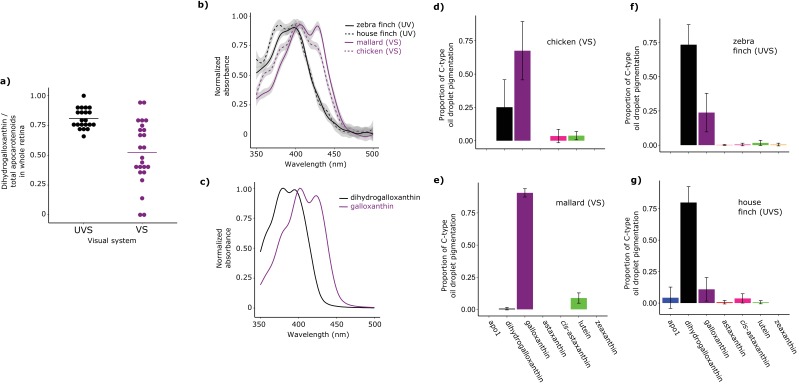
Figure 3. Shifts in the spectral filtering of the SWS2 cone between VS and UVS species are the result of changes in apocarotenoid composition.

(a) The ratio of dihydrogalloxanthin to total apocarotenoid content in the whole retina differs between UV and VS species. Each point represents a different species, and the bar indicates the mean for each visual system. (b) The UV-Vis absorbance spectrum of the expanded C-type oil droplets of selected UVS and VS species, and (c) the spectrum of galloxanthin and dihydrogalloxanthin for comparison. (dg) The mean ± S.D. proportion of each carotenoid in the additive mixture of pure spectra that best fits the C-type droplet spectra from (d) chicken (n = 5, VS), (e) mallard (n = 3, VS), (f) zebra finch (n = 5,UVS), and (g) house finch (n = 4, UVS). The pure carotenoid spectra, the observed C-type droplet spectra, and the fitted spectra of each droplet used to estimate oil droplet composition are presented in Figure 3—figure supplement 2.

DOI: http://dx.doi.org/10.7554/eLife.15675.010

Figure 3—source data 1. The measured oil droplet spectra, pure carotenoid spectra, and model fit parameters for each measured C-type droplet.
DOI: 10.7554/eLife.15675.011

Figure 3.

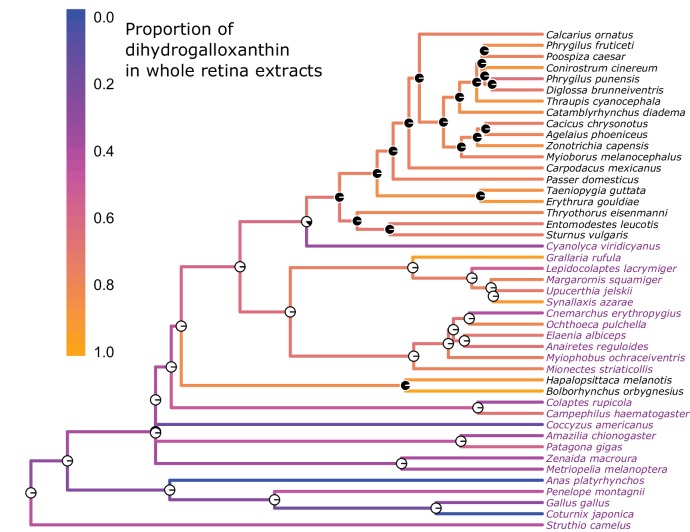
Figure 3—figure supplement 1. The evolution of the UV sensitive SWS1 opsin is associated with changes in whole retina apocarotenoid composition.

Figure 3—figure supplement 1.

The names of UVS species are written in black and those of VS species in purple. The color of each branch represents the proportion of dihydrogalloxanthin in the total apocarotenoid complement of the whole retina. The proportions of dihydrogalloxanthin for ancestral branches were estimated using maximum likelihood. The pie charts at each node indicate the maximum-likelihood ancestral state for the SWS1 opsin, with black and white indicating the probability of UVS and VS, respectively.
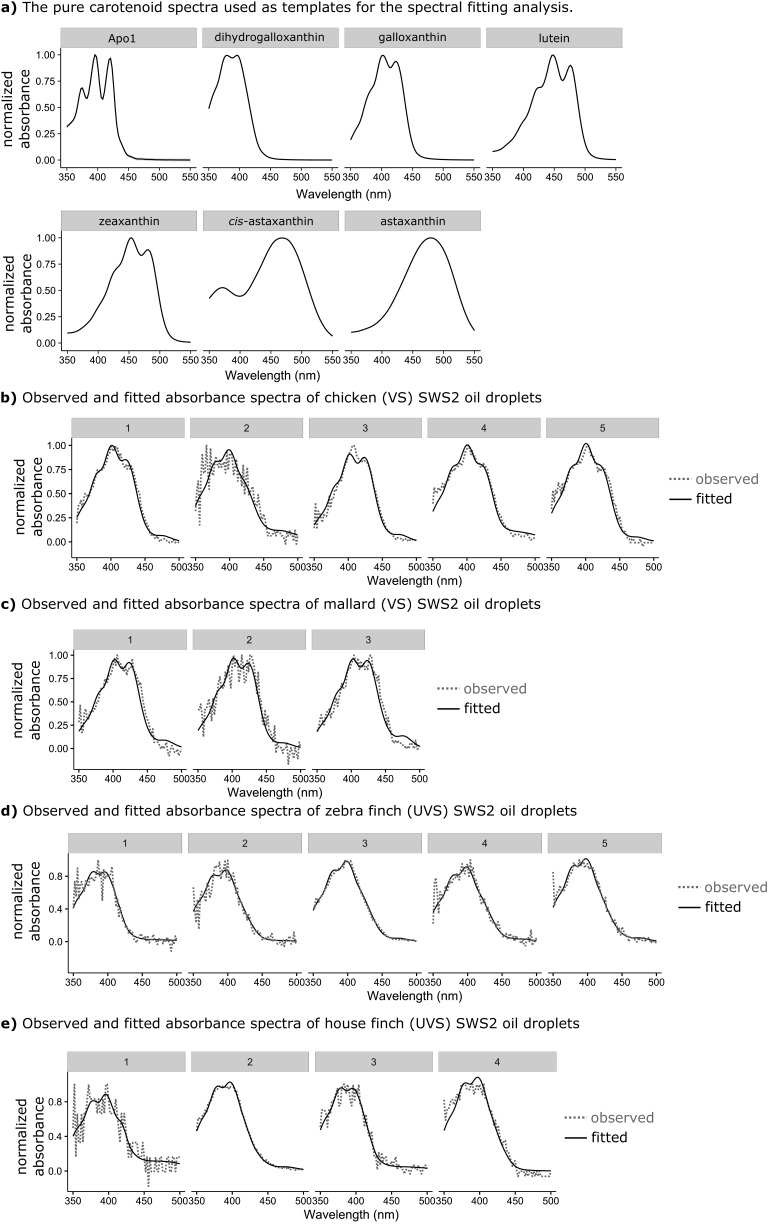
Figure 3—figure supplement 2. The observed absorbance spectra of the expanded C-type oil droplets and corresponding fitted spectra produced from additive mixtures of pure carotenoid spectra.

Figure 3—figure supplement 2.

(a) The spectra of the seven pure carotenoids used to fit the observed oil droplet spectra. (b–c) Each numbered plot represents the observed spectrum (dotted lines) and fitted spectrum (solid lines) for a different individual C-type oil droplet from (b) chicken (n = 5), (c) mallard duck (n = 3), (d) zebra finch (n = 5), or (e) house finch (n = 4).