FIGURE 3.

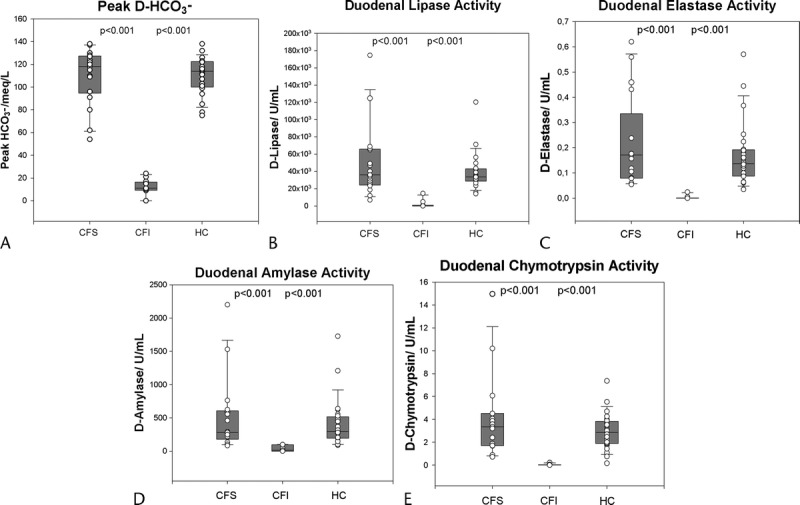
Box and scatter plots for peak bicarbonate concentrations and peak duodenal pancreatic enzyme activities divided by groups.

Box and scatter plots for peak bicarbonate concentrations and peak duodenal pancreatic enzyme activities divided by groups.