Abstract
Introduction
Third generation autologous chondrocyte implantation (ACI) is a suitable method for the treatment of cartilage defects in the knee joint. However, knowledge about the development of graft thickness and the clinical relevance of incomplete defect filling in the postoperative course is low. This prospective study analyses the graft integration into the surrounding cartilage, with special consideration of the graft thickness.
Material and methods
A total of 71 consecutive patients with 79 cartilage defects were treated with third generation autologous chondrocyte implantation (NOVOCART 3D) in the knee. Follow-up magnetic resonance imaging (MRI) was performed at 0.25, 0.5, 1 and 2 years. Graft thickness was measured compared to the surrounding healthy cartilage. The International Knee Documentation Committee (IKDC) scoring system and the visual analogue scale (VAS) were used for clinical evaluation. Cartilage defect filling was classified as the percentage of the surrounding cartilage.
Results
The average graft thickness showed a significant increase between 3 and 6 months after autologous chondrocyte implantation. Incomplete defect filling occurred in 44 (55.7%) cases. Of these, 33 cases showed incomplete defect filling grade I (> 75%), 10 cases were grade II (> 50%) and one case grade III (> 25%). Incomplete defect filling grade IV (< 25%) was not observed. Incomplete defect filling occurred significantly more often in women (p = 0.021), without worse clinical results.
Conclusions
Graft thickness after third generation autologous chondrocyte implantation shows increasing graft thickness over the period of 2 years postoperatively. A high rate of incomplete defect filling in the surrounding cartilage was observed, without worse clinical results.
Keywords: autologous chondrocyte implantation, cartilage defect, incomplete defect filling
Introduction
Autologous chondrocyte implantation (ACI) has become an established method for treating isolated cartilage defects in the past decades [1–4]. Third generation autologous chondrocyte implantation is a further development of the first generation ACI as first described by Brittberg et al. in 1994 using a periosteal flap [1]. Third generation ACI has proved to be an efficient procedure especially for the treatment of large cartilage defects over 4 cm2 as a cost effective procedure [5].
However, incomplete defect filling in the surrounding cartilage in the postoperative course after third generation ACI could be observed in clinical practice. It must be assumed that the used collagen-chondroitin sulfate based biphasic scaffold (NOVOCART 3D) will be rebuilt and will collapse in the following first postoperative weeks. Therefore, a lower graft thickness with incomplete defect filling would be expected. There have been no studies regarding the development of graft thickness in the following months after the operation. Therefore, it is unclear whether incomplete defect filling is responsible for pain and dysfunction after third generation ACI.
The aim of this study was to analyse the graft thickness in the 2-year postoperative course after third generation ACI and the clinical relevance of incomplete defect filling. The following hypotheses were put forward:
Graft thickness after third generation ACI increases in the first 2 postoperative years;
Incomplete defect filling leads to worse clinical results after third generation ACI in the 2-year postoperative course.
Individual factors that could favour the occurrence of incomplete defect filling were examined in this study for the first time. In addition, the International Knee Documentation Committee (IKDC) scoring system and the visual analogue scale (VAS) were assessed to determine whether there is any indication for surgical revision in cases with worse clinical results.
Material and methods
With institutional review board approval from the ethical committee of the Ludwig Maximilian University (LMU) of Munich, 79 consecutive cartilage defects were treated with third generation ACI by multiple surgeons and were included in this study. The criteria for inclusion follow the recommendations of the German Working Group Tissue Regeneration [6]. The following exclusion criteria were applied: osteoarthritis of the knee, joint instability, arthritis, corresponding cartilage defects and more than two focal cartilage defects. All treated cartilage defects were classified arthroscopically using the International Cartilage Repair Society (ICRS) classification of grades 3–4. All patients were treated with a collagen-chondroitin sulfate based biphasic scaffold (Novocart 3D, TETEC AG, Reutlingen, Germany). The scaffolds are bovine-derived, with a firm and dense membrane and a spongy part of pores arranged in columns of a set size. All implants were fixed to the healthy surrounding cartilage with an absorbable Vicryl USP 5-0 suture (Ethicon Inc., Johnson & Johnson, Norderstedt, Germany). Fibrin glue was not used.
Postoperative rehabilitation was conducted according to the guidelines of the German Working Group on Tissue Regeneration [6]. Patients, who were treated with third generation ACI because of femoral cartilage defects, started with postoperative after-care on the second postoperative day with a continuous passive motion (CPM) device. Weight bearing was limited to 20 kg for a period of 6 weeks, while flexion was increased quickly. If an ACI procedure was conducted because of patellar defects, the postoperative after-care was adapted and patients were fitted with a knee brace with limited flexion of 30° for 2 to 3 weeks. Afterwards, flexion was gradually increased and full weight bearing was allowed with full extension.
In order to assess the clinical outcome, we used the “IKDC subjective knee evaluation form” [7] and the VAS for pain prior to surgery and at 6, 12 and 24 months after the surgery. The symptom “pain” was divided into pain at rest and in motion.
Magnetic resonance imaging
The magnetic resonance examination was performed on a 1.5 Tesla unit (Magnetom Sonata, Siemens Medical Solutions, Erlangen, Germany). A commercially available circularly polarized 1-channel knee coil was used. As described in the literature, the fast spin-echo (dual T2-FSE) and fat-saturated gradient echo (3D FS GE) images are particularly suitable for the assessment of cartilage. The study patients underwent a modified examination, which consisted of a proton-weighted fat-saturated T1-weighted sequence and a fast-low-angle shot sequence (FLASH) with selective water excitation. This is an established sequence for the measurement of articular cartilage in the knee joint [8–11].
Incomplete defect filling
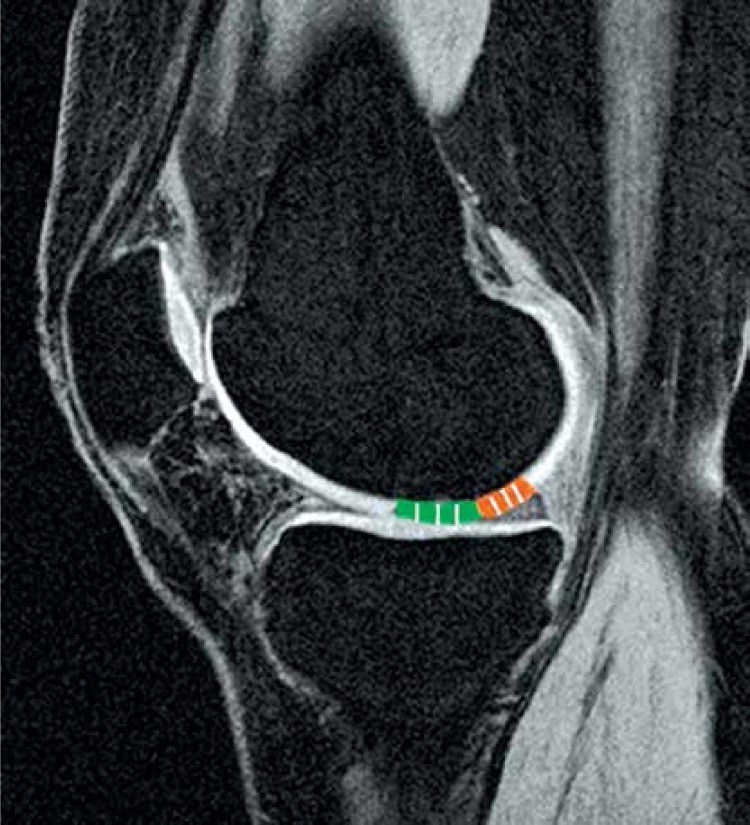
Graft thickness was measured using the MagicView VB33a/MagicWeb 1000 software (Siemens Medical Systems, Erlangen, Germany) for evaluation and measurement of DICOM (Digital Imaging and Communications in Medicine) data sets (Rosslyn, Virginia, USA). The measurement was done by two independent orthopaedic surgeons as described in the literature [10, 12]. Femoral cartilage defects were assessed in sagittal planes. Patellar cartilage defects were measured on axial planes. The thickest area of the graft as well as the adjacent normal cartilage was measured in 3 regions (Figure 1). The standardized measurements of graft and healthy cartilage were conducted by determining the mean values of 3 measurement points in the thickest region of the tissue. The ratio between the thickness of the graft and the thickness of the healthy cartilage was determined.
Figure 1.
Graft thickness was assessed in sagittal planes (femoral defect) and axial planes (patellar defects). The thickest area of the graft (green) as well as the adjacent normal cartilage (orange) was measured in 3 regions. The ratio between the thickness of the graft and the thickness of the healthy cartilage was determined
The level of defect filling was analysed as the percentage of the surrounding cartilage. Classification of incomplete defect filling was carried out on the basis of the ICRS classification system after 0.25, 0.5, 1 and 2 years: grade I (> 75%), grade II (> 50%), grade III (> 25%), grade IV (< 25%).
Statistical analysis
The statistical analysis was performed using the statistical program SPSS (Statistical Package of Social Sciences, version 21, Chicago, IL, USA). The non-parametric Wilcoxon test for paired samples was used for identifying significant differences between pre- and postoperative and between specific postoperative dates. The non-parametric Mann-Whitney U-test for independent samples was used for comparisons between two groups at a time. An intraclass correlation coefficient (ICC) analysis was performed to assess the intra-observer reliability. Post hoc power analysis was done with G*Power version 3.1.6 [13]. For all calculations with an error probability less than 5% (p < 0.05), the result was considered significant. P-values < 0.01 were considered strongly significant.
Results
The mean surrounding healthy cartilage thickness was 3.0 mm (standard deviation 0.53) with a range within 2.3–4.4 mm. At the subsequent measurements after 0.25, 0.5, 1 and 2 years the cartilage thickness was constant between 3.1 and 3.2 mm without significant changes. The mean femoral cartilage thickness was 3.0 (SD 0.65) mm. The mean patellar cartilage thickness was 3.4 ±0.70 mm.
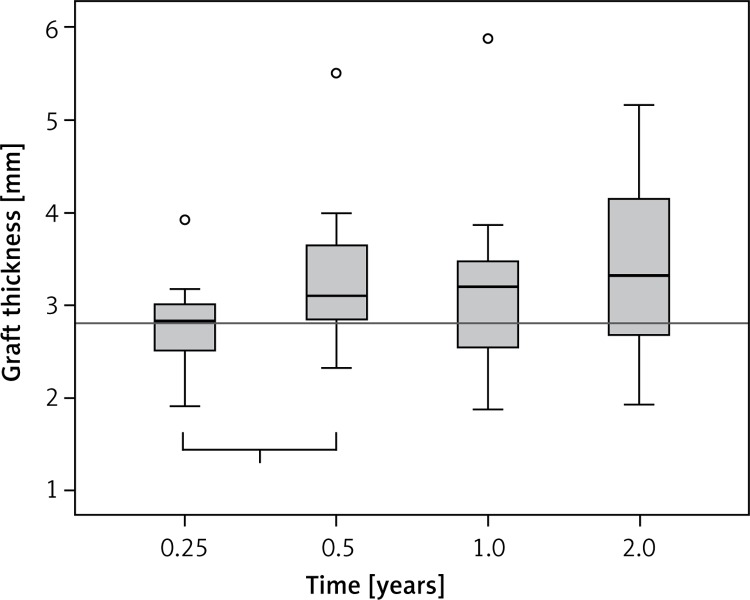
The graft thickness of the implanted cell seeded scaffolds was 2.8 mm before the operation. Three months after implantation, the mean graft thickness was still 2.8 mm. Subsequent to this measurement we could detect a significant increase of graft thickness of 0.3 mm (+10.7%) between 3 and 6 months (Figure 2). Accordingly, there was a consistent increase of the average graft thickness, without significant changes. After 2 years, the ACI grafts reached their maximum thickness of 3.2 mm (Table I). In total, graft thickness showed an increase of 0.44 mm (+15.7%) in the 2-year postoperative course.
Figure 2.
Graft thickness in the 2-year postoperative course. The thickness of the implanted cell seeded scaffolds was 2.8 mm. Three months (0.25 years) after implantation, the mean graft thickness was still 2.8 mm. We detected a significant increase of graft thickness of 0.3 mm (+10.7%) between 3 and 6 months (“1”: 0.25–0.5 years, p = 0.001)
Table I.
After 2 years, the mb-ACI Implants reached their maximum thickness of 3.2 mm. In total, graft thickness showed an increase of 0.44 mm (+15.7%) in the 2-year postoperative course
| Variable | N (%) | PreOP | 0.25 years | 0.5 years | 1 year | 2 years |
|---|---|---|---|---|---|---|
| All defects | 79 | 2.8 | 2.8 (+0%) | 3.1 (+10.7%) | 3.2 (+3.2%) | 3.2 (+0%) |
| Incomplete defect filling | 44 | 2.8 | 2.6 (–7.1%) | 2.9 (+11.5%) | 3.1 (+6.9%) | 3.2 (+3.2%) |
| Regular graft thickness | 35 | 2.8 | 2.9 (+3.6%) | 3.4 (+17.2%) | 3.3 (–2.9%) | 3.4 (+3.0%) |
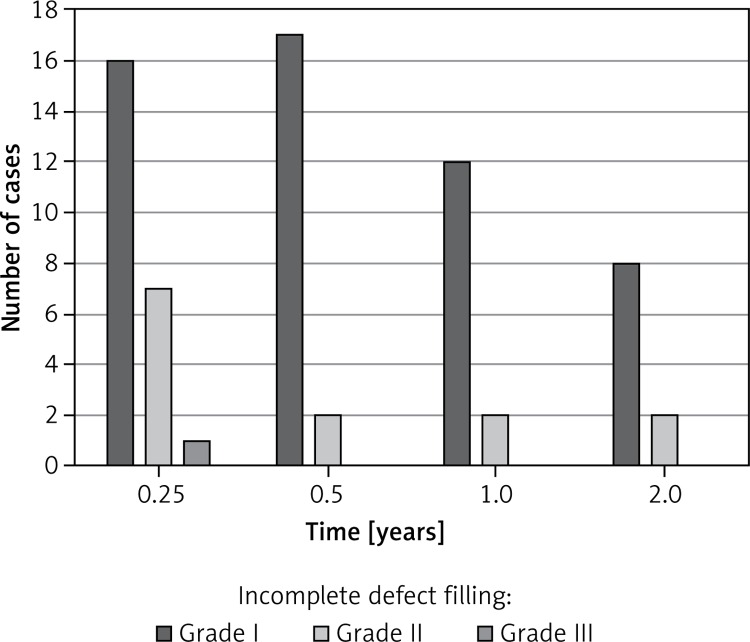
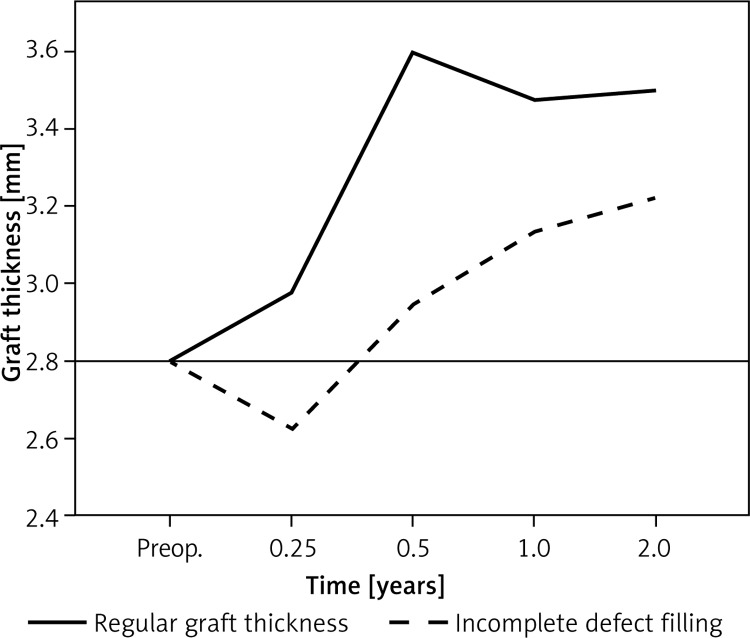
Incomplete defect filling was detected in relation to the surrounding healthy cartilage. A total of 44 implants (55.7% of our patient population) showed an incomplete defect filling. Thirty-three patients (20.2% of the total implants) had a grade I incomplete defect filling. Ten (6.1%) implants showed grade II, and only 1 (0.6%) implant showed a grade III incomplete defect filling. No patient showed incomplete defect filling grade IV. There was a high rate of incomplete defect filling in the first 6 months (Figure 3). Patients with an incomplete defect filling showed an early loss of graft thickness after 3 months. Accordingly, we could detect continuous growth during the observation period. This patient population showed a late accommodation to the surrounding cartilage without a significant increase between 3 and 6 months (Figure 4). Graft hypertrophy was seen in 25% (n = 20) of the study population.
Figure 3.
There was a high rate of incomplete defect filling in the first 6 months. Incomplete defect filling appeared over the whole assessment period with a declining trend. No patients showed incomplete defect filling grade IV
Figure 4.
Patients with an incomplete defect filling showed an early loss of graft thickness after 3 months (0.25 years). Accordingly, we could detect continuous growth during the observation period. This patient population showed a late accommodation to the surrounding cartilage without a significant increase between 3 and 6 months (0.25–0.5 years)
Risk factors
Analysing the influence of risk factors for development of incomplete defect filling, we detected 42 (53.2% of the total patient population) femoral defects and 37 (46.8%) cartilage defects of the retropatellar joint. The area of treated cartilage defects was on average 6.7 cm2. We included 45 (57.0%) men and 34 (43.0%) women with an average age of 34.1 (14–57) years and an average BMI of 25.6 (range 19–35.3; men 26.8, women 25.0) kg/m2 (Table II). Our findings did not show an influence of the localization and defect size of the treated cartilage defects.
Table II.
Gender seems to be a risk factor for development of incomplete defect filling. Incomplete defect filling occurred significantly more often in women. There was no correlation of age, BMI defect size or localization with incomplete defect filling. Patients with incomplete defect filling did not have a significantly worse result in the IKDC subjective score or VAS after 0.5, 1 and 2 years
| Parameter | Incomplete defect filling | Regular graft thickness | P-value |
|---|---|---|---|
| Number of patients | 44 | 35 | NS |
| BMI, male/female (range) [kg/m2] | 25.8 ±4.0 (19.6–34) | 25.2 ±4.1 (19–35.3) | NS |
| 26.9/25.2 | 26.0/23.2 | NS | |
| Defect size (range) | 5.5 ±2.9 (0.5–12) | 6.4 ±2.5 (3.5–15) | NS |
| Age (range) [years] | 33.6 ±10.8 (14–49) | 34.9 ±11.7 (15–57) | NS |
| Sex – male/female | 20/24 | 25/10 | 0.021 |
| Localization – femoral/patellar | 20/24 | 22/13 | NS |
| IKDC – 6 months | 52.2 ±18.6 (9.8–98.9) | 51.8 ±21.8 (16.1–95.4) | NS |
| IKDC – 12 months | 59.6 ±19.6 (24.1–100) | 58.3 ±21.5 (19.5–94.3) | NS |
| IKDC – 24 months | 62.8 ±22.2 (10.3–100) | 61.4 ±23.1 (20.7–100) | NS |
Incomplete defect filling was seen in both femoral and patellar cartilage defects without a correlation with the defect size. Analysing the individual risk factors, we found the following. Gender seems to be a risk factor for development of incomplete defect filling. Incomplete defect filling occurred significantly more often in women. Incomplete defect filling was seen in 24 (70.6%) female cases and only 20 (44.4%) in male cases (Table II). This study did not show a correlation between age or BMI and incomplete defect filling.
Clinical relevance
In a more detailed analysis of the outcomes of our patient population, we analysed the graft thickness and the clinical relevance. No association could be detected between the IKDC subjective score and VAS. Graft thickness does not correlate with the clinical outcomes in the IKDC in the postoperative period. Also the incomplete defect filling showed no significantly worse result in the analysed clinical scores. Patients with incomplete defect filling showed comparable IKDC results in the observation follow-up period of 2 years after the operation. When analysing the influence of graft thickness on the VAS, there was also no association (Table II). There was no need for revision surgery due to incomplete defect filling.
Discussion
The aim of this study was to analyse the graft thickness in the 2-year postoperative course after third generation ACI and the clinical relevance of incomplete defect filling. It was hypothesized that graft thickness increases in the early postoperative course without worse clinical results in cases with incomplete defect filling.
The most important finding of the present study was that graft thickness increases in the 2-year postoperative course, with a significant increase between 3 and 6 months. Also there is a high rate of incomplete defect filling in the 2-year postoperative course without clinical relevance.
Seventy-nine cartilage defects were investigated clinically and radiologically. This study is based on a standardized postoperative follow-up magnetic resonance imaging (MRI), which allows determination of ACI graft thickness in the 2-year postoperative course. The graft thickness as well as the adjacent healthy surrounding cartilage was measured in 3 regions as described in previous studies [10, 12]. In addition, the intra-observer reliability was assessed with intraclass correlation coefficient (ICC) analysis of “substantial” to “almost perfect” intra-observer reliability (ICC: 0.73–0.83). IKDC subjective score and VAS were used for clinical evaluation in the postoperative course after 0.5, 1 and 2 years. These are well-established scores for clinical evaluation of cartilage repair procedures with high reliability [14] and have been used in several studies [15, 16].
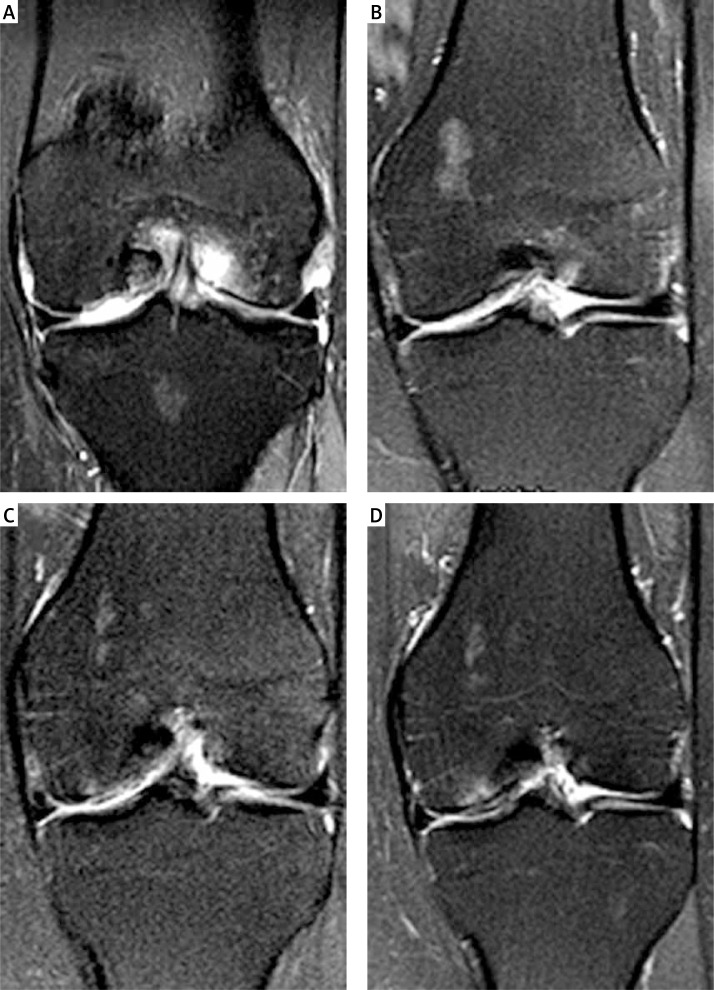
In total, maximum graft thickness showed an increase of 0.44 mm (+15.7%) in the 2-year postoperative course. The course of graft growth was not constant in the observation period. There was significant graft growth between 3 and 6 months by 0.31 mm (+10.7%). This growth between 3 and 6 months represents 70.5% of the total graft growth in the whole 2-year observation period (Figure 5). In the subsequent periods we observed only a small graft growth of 3.2% after 1 and 2 years. It appears that graft thickness reached a plateau after 1–2 years. This may be an indication of maturation and adaption to the surrounding cartilage. In a previous study, it was demonstrated that graft hypertrophy emerges in the first postoperative year [10]. The increase of graft thickness may thus be seen as an adaptive response, with a high regenerative capacity especially during the first 6 postoperative months. This is in line with our results.
Figure 5.
MRI follow-up after 3 months (A), 6 months (B), 1 year (C) and 2 years (D) of a 45-year-old woman with a treated cartilage defect an the left medial femoral condyle. Incomplete defect filling was observed after 3 and 6 months (A–B). After 1 and 2 years (C–D) graft thickness increased with good integration into the surrounding healthy cartilage
Therefore it remains questionable how graft thickness is connected with histological appearance. Especially in cases with incomplete defect filling it must be assumed that cartilage maturation and matrix synthesis are limited, which could be a sign of cell death/apoptosis. Tins et al. examined in a previously study graft thickness after first generation ACI using a periosteal patch. In this study graft thickness was correlated with the histological analysis. The authors could not detect a correlation between graft thickness and histological appearance after 12 months [11].
Also, it is known that chondrogenesis is enhanced by cyclic deformation and load [17, 18]. The main increase of the graft thickness between 3 and 6 months could therefore be explained by increasing weight-bearing in the first postoperative months.
In cases with incomplete defect filling a late accommodation to the surrounding cartilage without a significant increase between 3 and 6 months could be found. In this study a high rate of incomplete defect filling was observed. Interestingly, incomplete defect filling occurred at all times during the follow-up.
Cartilage thickness has been used in previous studies as a parameter indicating joint damage and disease progression [19, 20]. Therefore, it could be expected that incomplete defect filling correlates with a worse clinical outcome. In the present study we could not detect worse clinical results in the raised scores (IKDC and VAS) during the observation period.
Analysing the individual risk factors, women showed a significantly greater risk of developing incomplete defect filling in the 2-year observation period. Incomplete defect filling was observed in 65% (n = 13) of the female cases. In a previous study, Kreuz et al. found that isokinetic muscle strength measures were significantly worse in women with worse clinical outcomes [21, 22].
In our study, we could not detect a worse clinical outcome in the examined IKDC and VAS scores. The clinical influence of gender after ACI is controversial. Kreuz et al. reported worse clinical results [22], which was confirmed by Jungmann et al. In our study we did not confirm these findings in the clinical results.
Ding et al. found that women have substantially higher knee cartilage loss than men per annum. These findings appear especially with increasing age over 40 years. A potentially decisive factor of gender differences in cartilage loss could be the effects of hormones. For example, androgens stimulate human chondrocyte proliferation as well as collagen and proteoglycan synthesis [23]. In another study, it was demonstrated that serum testosterone affects medial femoral cartilage volume [24].
Two limitations of the study are the lack of a control group and the lack of a histological analysis. Only the thickest area of the graft was measured. It would be interesting to obtain more information about the influence of gender on graft growth and maturation. In vivo biopsies were not performed for ethical reasons. Therefore it would be interesting to obtain more detailed information of MRI examinations for in vivo evaluation of graft maturation. Another acknowledged limitation of this study is the missing hormonal analysis, especially of older women. Potentially, there is a hormonal influence on graft thickness after ACI in the postoperative course. More clinical studies over a longer observation period are needed in order to answer these questions.
The high incidence of incomplete defect filling required a detailed examination of the clinical relevance. Patients with incomplete defect filling showed a slow further graft increase at the subsequent observed time points. Without significant growth between 3 and 6 months, this group of patients could be interpreted as late responders. Women are at especially high risk of developing incomplete defect filling as late responders. However, worse clinical results were not detected in this patient population. In a case of incomplete defect filling, it should be clarified whether there is an adaptive response of the graft thickness in the postoperative course. In such cases, without partial deficiency of the graft cartilage surgical revisions should be avoided and other pathologies should be verified first.
In conclusion, the most important finding of this study is that third generation autologous chondrocyte implantation shows increasing graft thickness over the period of 2 years after the operation, with a high rate of incomplete defect filling in the surrounding cartilage. Gender specific differences in graft thickness after third generation ACI were observed with a higher incidence of incomplete defect filling. However, incomplete defect filling did not affect clinical outcomes after third generation ACI in the first 2 postoperative years.
Conflict of interest
The authors declare no conflict of interest.
References
- 1.Brittberg M, Lindahl A, Nilsson A, Ohlsson C, Isaksson O, Peterson L. Treatment of deep cartilage defects in the knee with autologous chondrocyte transplantation. N Engl J Med. 1994;331:889–95. doi: 10.1056/NEJM199410063311401. [DOI] [PubMed] [Google Scholar]
- 2.Peterson L, Brittberg M, Kiviranta I, Akerlund EL, Lindahl A. Autologous chondrocyte transplantation. Biomechanics and long-term durability. Am J Sports Med. 2002;30:2–12. doi: 10.1177/03635465020300011601. [DOI] [PubMed] [Google Scholar]
- 3.Peterson L, Vasiliadis HS, Brittberg M, Lindahl A. Autologous chondrocyte implantation: a long-term follow-up. Am J Sports Med. 2010;38:1117–24. doi: 10.1177/0363546509357915. [DOI] [PubMed] [Google Scholar]
- 4.Meyerkort D, Ebert JR, Ackland TR, et al. Matrix-induced autologous chondrocyte implantation (MACI) for chondral defects in the patellofemoral joint. Knee Surg Sports Traumatol Arthrosc. 2014 doi: 10.1007/s00167-014-3046-x. [DOI] [PubMed] [Google Scholar]
- 5.Samuelson EM, Brown DE. Cost-effectiveness analysis of autologous chondrocyte implantation: a comparison of periosteal patch versus type I/III collagen membrane. Am J Sports Med. 2012;40:1252–8. doi: 10.1177/0363546512441586. [DOI] [PubMed] [Google Scholar]
- 6.Niemeyer P, Andereya S, Angele P, et al. Autologous chondrocyte implantation (ACI) for cartilage defects of the knee: a guideline by the working group “Tissue Regeneration” of the German Society of Orthopaedic Surgery and Traumatology (DGOU) Z Orthop Unfall. 2013;151:38–47. doi: 10.1055/s-0032-1328207. [DOI] [PubMed] [Google Scholar]
- 7.Peterson L, Minas T, Brittberg M, Lindahl A. Treatment of osteochondritis dissecans of the knee with autologous chondrocyte transplantation: results at two to ten years. J Bone Joint Surg Am. 2003;85(A Suppl 2):17–24. doi: 10.2106/00004623-200300002-00003. [DOI] [PubMed] [Google Scholar]
- 8.Eckstein F, Sittek H, Milz S, Putz R, Reiser M. The morphology of articular cartilage assessed by magnetic resonance imaging (MRI). Reproducibility and anatomical correlation. Surg Radiol Anat. 1994;16:429–38. doi: 10.1007/BF01627667. [DOI] [PubMed] [Google Scholar]
- 9.Graichen H, Springer V, Flaman T, et al. Validation of high-resolution water-excitation magnetic resonance imaging for quantitative assessment of thin cartilage layers. Osteoarthr Cartil. 2000;8:106–14. doi: 10.1053/joca.1999.0278. [DOI] [PubMed] [Google Scholar]
- 10.Pietschmann MF, Niethammer TR, Horng A, et al. The incidence and clinical relevance of graft hypertrophy after matrix-based autologous chondrocyte implantation. Am J Sports Med. 2012;40:68–74. doi: 10.1177/0363546511424396. [DOI] [PubMed] [Google Scholar]
- 11.Tins BJ, McCall IW, Takahashi T, et al. Autologous chondrocyte implantation in knee joint: MR imaging and histologic features at 1-year follow-up. Radiology. 2005;234:501–8. doi: 10.1148/radiol.2342031970. [DOI] [PubMed] [Google Scholar]
- 12.Niethammer TR, Pietschmann MF, Horng A, et al. Graft hypertrophy of matrix-based autologous chondrocyte implantation: a two-year follow-up study of NOVOCART 3D implantation in the knee. Knee Surg Sports Traumatol Arthrosc. 2013 doi: 10.1007/s00167-013-2454-7. [DOI] [PubMed] [Google Scholar]
- 13.Faul F, Erdfelder E, Lang AG, Buchner A. G*Power 3: a flexible statistical power analysis program for the social, behavioral, and biomedical sciences. Behav Res Methods. 2007;39:175–91. doi: 10.3758/bf03193146. [DOI] [PubMed] [Google Scholar]
- 14.Higgins LD, Taylor MK, Park D, et al. International Knee Documentation C. Reliability and validity of the International Knee Documentation Committee (IKDC) Subjective Knee Form. Joint Bone Spine. 2007;74:594–9. doi: 10.1016/j.jbspin.2007.01.036. [DOI] [PubMed] [Google Scholar]
- 15.Niemeyer P, Pestka JM, Salzmann GM, Sudkamp NP, Schmal H. Influence of cell quality on clinical outcome after autologous chondrocyte implantation. Am J Sports Med. 2012;40:556–61. doi: 10.1177/0363546511428879. [DOI] [PubMed] [Google Scholar]
- 16.Pietschmann MF, Horng A, Niethammer T, et al. Cell quality affects clinical outcome after MACI procedure for cartilage injury of the knee. Knee Surg Sports Traumatol Arthrosc. 2009;17:1305–11. doi: 10.1007/s00167-009-0828-7. [DOI] [PubMed] [Google Scholar]
- 17.Angele P, Schumann D, Angele M, et al. Cyclic, mechanical compression enhances chondrogenesis of mesenchymal progenitor cells in tissue engineering scaffolds. Biorheology. 2004;41:335–46. [PubMed] [Google Scholar]
- 18.Angele P, Yoo JU, Smith C, et al. Cyclic hydrostatic pressure enhances the chondrogenic phenotype of human mesenchymal progenitor cells differentiated in vitro. J Orthop Res. 2003;21:451–7. doi: 10.1016/S0736-0266(02)00230-9. [DOI] [PubMed] [Google Scholar]
- 19.Buckland-Wright JC, Macfarlane DG, Lynch JA, Jasani MK, Bradshaw CR. Joint space width measures cartilage thickness in osteoarthritis of the knee: high resolution plain film and double contrast macroradiographic investigation. Ann Rheum Dis. 1995;54:263–8. doi: 10.1136/ard.54.4.263. [DOI] [PMC free article] [PubMed] [Google Scholar]
- 20.Karvonen RL, Negendank WG, Teitge RA, Reed AH, Miller PR, Fernandez-Madrid F. Factors affecting articular cartilage thickness in osteoarthritis and aging. J Rheumatol. 1994;21:1310–8. [PubMed] [Google Scholar]
- 21.Kreuz PC, Muller S, Erggelet C, et al. Is gender influencing the biomechanical results after autologous chondrocyte implantation? Knee Surg Sports Traumatol Arthrosc. 2014;22:72–9. doi: 10.1007/s00167-012-2280-3. [DOI] [PubMed] [Google Scholar]
- 22.Kreuz PC, Muller S, von Keudell A, et al. Influence of sex on the outcome of autologous chondrocyte implantation in chondral defects of the knee. Am J Sports Med. 2013;41:1541–8. doi: 10.1177/0363546513489262. [DOI] [PubMed] [Google Scholar]
- 23.Franchimont P, Bassleer C. Effects of hormones and local growth factors on articular chondrocyte metabolism. J Rheumatol Suppl. 1991;27:68–70. [PubMed] [Google Scholar]
- 24.Cicuttini FM, Wluka A, Bailey M, et al. Factors affecting knee cartilage volume in healthy men. Rheumatology (Oxford) 2003;42:258–62. doi: 10.1093/rheumatology/keg073. [DOI] [PubMed] [Google Scholar]


