

Abstract
Objective
Obesity is associated with increased risk of diabetes, hypertension and cardiovascular mortality. Several studies have reported increased length of hospital stay and complications; however, there are also reports of obesity having a protective effect on health, a phenomenon coined the ‘obesity paradox’. We aimed to investigate the impact of overweight and obesity on complications and mortality in hospitalized patients with hyperglycemia and diabetes.
Research design and methods
This retrospective analysis was conducted on 29 623 patients admitted to two academic hospitals in Atlanta, Georgia, between January 2012 and December 2013. Patients were subdivided by body mass index into underweight (body mass index <18.5 kg/m2), normal weight (18.5–24.9 kg/m2), overweight (25–29.9 kg/m2) and obese (>30 kg/m2). Hyperglycemia was defined as a blood glucose >10 mmol/L during hospitalization. Hospital complications included a composite of pneumonia, acute myocardial infarction, respiratory failure, acute kidney injury, bacteremia and death.
Results
A total of 4.2% were underweight, 29.6% had normal weight, 30.2% were overweight, and 36% were obese. 27.2% of patients had diabetes and 72.8% did not have diabetes (of which 75% had hyperglycemia and 25% had normoglycemia during hospitalization). A J-shaped curve with higher rates of complications was observed in underweight patients in all glycemic groups; however, there was no significant difference in the rate of complications among normal weight, overweight, or obese patients, with and without diabetes or hyperglycemia.
Conclusions
Underweight is an independent predictor for hospital complications. In contrast, increasing body mass index was not associated with higher morbidity or mortality, regardless of glycemic status. There was no evidence of an obesity paradox among inpatients with diabetes and hyperglycemia.
Keywords: Obesity, Type 2 Diabetes, Hyperglycemia
Key messages.
Underweight status was found to be an independent predictor for inpatient complications.
Obesity was not associated with a higher morbidity or mortality in hospitalized patients when compared to normal weight, regardless of glycemic status.
No ‘obesity paradox’ was observed in the hospital setting among patients with diabetes and hyperglycemia.
Introduction
Obesity and diabetes mellitus are major burdens on the US healthcare system. Despite public health efforts, over two-thirds of US adults were overweight or obese in 2011–2012.1 Similarly, the worldwide prevalence of obesity has more than doubled since 1980 and according to the WHO, more than 1.9 billion adults aged 18 years and above (38% of men and 40% of women) were overweight in 2014.2 Several studies have reported on the negative impact of obesity on health, including increased risk of diabetes, hypertension, dyslipidemia, cardiovascular disease, osteoarthritis, cancer, and overall mortality.3–6 Despite the known negative health effects of obesity, recent prospective studies have reported a U-shaped or J-shaped relationship between body mass index (BMI) and mortality, with lower mortality rates observed in individuals with higher BMI compared to lower BMI.7–12 This phenomenon has been coined the ‘obesity paradox’ and has been recognized in several conditions, including cardiovascular8 11 12 and kidney disease.10
A large body of evidence suggests that the presence of hyperglycemia in hospitalized patients with and without diabetes is associated with poor clinical outcomes.13–20 Inpatient hyperglycemia has been associated with increased risk of complications, longer hospital stay, higher admission rates to intensive care and death.13–19 In general medicine and surgery patients, hyperglycemia has also been associated with a higher risk of postoperative infection, prolonged hospital stay and a higher chance of requiring nursing home care after discharge.14 17 21 22
Few studies have investigated the association between BMI and clinical outcomes in hospitalized patients. In the surgical population, mixed results have been reported with some studies showing longer operation times, increased length of stay, and worse perioperative outcomes,23–26 while other studies have shown improved operative outcomes and mortality.9 27 Numerous studies in medicine patients have also reported a protective effect against morbidity and mortality, suggesting the presence of an obesity paradox.7 8 10–12 Despite the lack of consensus on the association between obesity and hospital complications, obese patients are generally considered to be at higher risk of complications compared to their normal weight counterparts. Given the high prevalence of diabetes, hyperglycemia, and obesity in hospitalized patients and the inconsistencies in evidence regarding their impact on hospital outcomes, we performed an observational database analysis investigating the interplay between obesity and hyperglycemia and its impact on hospital outcomes.
Methods
We reviewed the medical records of 29 623 patients admitted to Emory University Hospital and Emory Midtown Hospital between January 2012 and December 2013. Patients were subdivided by BMI into categories of underweight (BMI <18.5 kg/m2), normal weight (BMI 18.5–24.9 kg/m2), overweight (BMI 25–29.9 kg/m2), obesity grade 1 (BMI 30–34.9 kg/m2), obesity grade 2 (BMI 35–39.9 kg/m2), and obesity grade 3 (BMI >40 kg/m2). Patients were categorized according to glycemic status into diabetes, no diabetes with hyperglycemia, and no diabetes with normoglycemia. Hyperglycemia was defined as a maximum blood glucose (BG) >10 mmol/L. We excluded patients who were undergoing outpatient procedures, had an admission glucose >22 mmol/L, ICD-9 diagnoses for diabetic ketoacidosis, hyperosmolar hyperglycemic state and end-stage renal disease. Patients with an estimated glomerular filtration rate <15 mL/min were also excluded.
Patient information was obtained from the Clinical Data Warehouse infrastructure programme from the Emory University Hospital electronic health record and billing systems. The following variables were extracted for each patient: age at admission, gender, race, BMI, history of diabetes, admission service (medicine vs surgery), intensive care unit (ICU) treatment, comorbidities, hospital complications, insulin usage and glucose measures on admission and during hospitalization. Admission diagnoses were extracted using ICD-9 codes and were categorized into the following groups: cardiovascular, gastrointestinal, endocrinology, rheumatology, hematology/oncology, infectious, neurology, pulmonary, renal and miscellaneous disorders. Diagnosis of diabetes mellitus, complications, and comorbidities were identified based on ICD-9 codes except for acute kidney injury (AKI). AKI was determined by a rise in serum creatinine of 50% during hospitalization, above the admission value. ICD-9 codes necessary to calculate Charlson comorbidity index28 were evaluated in order to take into account severity of illness.28 Hospital complications included a composite of mortality, pneumonia, acute myocardial infarction, respiratory failure, AKI and bacteremia. Comorbidities were determined using ICD-9 codes for the following chronic conditions: coronary artery disease, hypertension, chronic kidney disease, malignancy, chronic obstructive pulmonary disease and dyslipidemia. Since some patients had multiple hospitalizations, only the first hospitalization during the study time period was included in the analyses.
Statistical analysis
The primary objective of the study was to determine the association between BMI and in-hospital composite of complications and mortality by diabetes/glycemic status. We examined the association via logistic regression models. In unadjusted and adjusted analyses, BMI was included as a categorical variable (<18.5, 18.5–24.9 (reference group) compared to 25–29.9, 30–34.9, 35–39.9, and ≥40 kg/m2). In the adjusted analysis, we sequentially added demographics including age, gender, and race, and then clinical characteristics including comorbidities, hospital setting (ICU vs non-ICU), admission service (medicine vs surgery), admission diagnosis, Charlson comorbidity index and admission glucose into the models.
Inpatient complications, demographics and comorbidities were compared across different BMI and glycemic groups. Continuous variables were compared using analysis of variance or Kruskal-Wallis test and expressed as mean±SD or median (IQR). Categorical variables were compared by χ2 test and expressed as frequency and proportion. All the analyses were also performed in patients with diabetes and in patients without diabetes with normoglycemia and hyperglycemia. Hosmer-Lemeshow test was applied to examine the fit of all the models. A two-tailed p<0.05 was considered to be statistically significant. Statistical analyses were performed with the Statistical Analysis System, V.9.4 (SAS Institute, Cary, North Carolina, USA).
Results
The study population included 29 623 patients. Of them, 1235 patients were underweight (4.2%), 8743 normal (29.6%), 8960 overweight (30.2%), 5665 obesity grade 1 (19.1%), 2734 obesity grade 2 (9.2%) and 2276 obesity grade 3 (7.7%). There were 8046 (27.2%) patients with diabetes and 21 577 (72.8%) without diabetes. Of the patients without diabetes, 5368 (25%) were hyperglycemic and 16 209 (75%) were normoglycemic during their hospital stay. Patient demographics and clinical characteristics by glycemic status and BMI are shown in table 1. Patients with diabetes tended to be older than patients without diabetes, but patients with obesity grade 3 were younger than those of other BMI categories (see table 1). There was a relatively even ratio of male to female patients, except for those with obesity grade 3 who were more likely to be women. There were also more African-American patients with diabetes when compared to those without diabetes, particularly among normal BMI, overweight and obesity grade 1 patients. Among patients with diabetes, admission and mean BG were lower in underweight patients than in higher BMI groups; however, there was no significant difference in the maximum in-hospital BG across all BMI groups.
Table 1.
Patient demographics by BMI and glycemic status
| Patients with diabetes (n=8046) | Underweight (n=227) | Normal BMI (n=1697) | Overweight (n=2137) | Obese grade 1 (n=1900) | Obese grade 2 (n=1105) | Obese grade 3 (n=980) | p Value |
|---|---|---|---|---|---|---|---|
| Age, years | 62.1±17.8 | 66.2±16.1 | 66.1±13.1 | 63.9±12.6 | 61.3±12.1 | 56.4±13.4 | <0.0001 |
| Male, n (%) | 112 (49.3) | 918 (54.1) | 1242 (58.1) | 1002 (52.7) | 483 (43.7) | 317 (32.3) | <0.0001 |
| African-American, n (%) | 134 (59.0) | 842 (49.6) | 947 (44.3) | 872 (45.9) | 550 (49.8) | 550 (56.1) | <0.0001 |
| BMI, kg/m2 | 16.8±1.5 | 22.3±1.8 | 27.5±1.4 | 32.4±1.5 | 37.3±1.4 | 45.6±4.7 | <0.0001 |
| BG at admission, mmol/L | 8.8±3.8 | 9.0±3.6 | 9.1±3.3 | 9.4±3.4 | 9.7±3.4 | 9.9±3.6 | <0.0001 |
| Mean in-hospital BG, mmol/L | 8.1±2.4 | 8.5±2.4 | 8.6±2.2 | 9.0±2.4 | 9.1±2.3 | 9.2±2.6 | <0.0001 |
| Maximum hospital BG, mmol/L | 15.1±7.5 | 15.1±7.3 | 14.9±6.7 | 15.1±6.4 | 15.2±5.8 | 15.1±6.1 | 0.82 |
| Insulin treatment, n (%) | 138 (60.8) | 1152 (67.9) | 1550 (72.5) | 1476 (77.7) | 901 (81.5) | 767 (78.3) | <0.0001 |
| Length of stay, median, days | 5.0 (3.0–9.0) | 5.0 (3.0–8.0) | 4.0 (2.0–8.0) | 4.0 (2.0–7.0) | 4.0 (2.0–7.0) | 4.0 (2.0–8.0) | <0.0001 |
| Patients without diabetes (n=21 577) | Underweight (n=1008) | Normal BMI (n=7056) | Overweight (n=6823) | Obese grade 1 (n=3765) | Obese grade 2 (n=1629) | Obese grade 3 (n=1296) | p Value |
| Age at admission, years | 58.4±19.5 | 59.6±18.4 | 60.2±15.3 | 58.0±14.8 | 55.2±14.0 | 50.7±14.0 | <0.0001 |
| Male, n (%) | 417 (41.4) | 3481 (49.3) | 3844 (56.3) | 1876 (49.8) | 654 (40.1) | 382 (29.5) | <0.0001 |
| African-American, n (%) | 428 (42.5) | 2244 (31.8) | 2045 (30.0) | 1313 (34.9) | 699 (42.9) | 701 (54.1) | <0.0001 |
| BMI, kg/m2 | 16.7±1.6 | 22.3±1.8 | 27.4±1.4 | 32.2±1.4 | 37.2±1.4 | 45.2±4.6 | <0.0001 |
| BG at admission, mmol/L | 6.5±1.9 | 6.7±1.8 | 6.9±1.9 | 7.1±2.0 | 7.2±2.1 | 7.1±2.0 | <0.0001 |
| Mean in-hospital BG, mmol/L | 6.3±1.2 | 6.4±1.2 | 6.7±1.3 | 6.8±1.4 | 6.9±1.4 | 6.8±1.4 | <0.0001 |
| Maximum hospital BG, mmol/L | 9.3±4.9 | 8.8±4.2 | 8.9±3.9 | 9.1±4.4 | 9.3±4.4 | 9.1±3.9 | <0.0001 |
| Insulin treatment, n (%) | 205 (20.3) | 1339 (19.0) | 1449 (21.2) | 832 (22.1) | 387 (23.8) | 304 (23.5) | <0.0001 |
| Length of stay, median days | 5.0 (3.0–10.0) | 4.0 (2.0–7.0) | 4.0 (2.0–7.0) | 4.0 (2.0–7.0) | 3.0 (2.0–6.0) | 3.5 (2.0–7.0) | <0.0001 |
BG, blood glucose; BMI, body mass index.
Patient comorbidities by BMI are shown in table 2. Obese patients had significantly higher rates of pre-existing coronary artery disease, hypertension, and hyperlipidemia. However, chronic obstructive coronary disease and malignancy were more frequently seen in the lower BMI groups, in patients with and without diabetes.
Table 2.
Prevalence of comorbidities by BMI and diabetes status
| Underweight | Normal BMI | Overweight | Obese grade 1 | Obese grade 2 | Obese grade 3 | p Value | |
|---|---|---|---|---|---|---|---|
| Patients with diabetes (n=8046) | |||||||
| CAD, n (%) | 41 (18.1) | 417 (24.6) | 689 (32.2) | 588 (30.9) | 308 (27.9) | 208 (21.2) | <0.0001 |
| Hypertension, n (%) | 95 (41.9) | 866 (51.0) | 1147 (53.7) | 1116 (58.7) | 641 (58.0) | 592 (60.4) | <0.0001 |
| CKD, n (%) | 61 (26.9) | 428 (25.2) | 589 (27.6) | 483 (25.4) | 275 (24.9) | 201 (20.5) | 0.0028 |
| COPD, n (%) | 39 (17.2) | 250 (14.7) | 235 (11.0) | 258 (13.6) | 122 (11.0) | 123 (12.6) | 0.0013 |
| Malignancy, n (%) | 33 (14.5) | 221 (13.0) | 247 (11.6) | 158 (8.3) | 82 (7.4) | 45 (4.6) | <0.0001 |
| Hyperlipidemia, n (%) | 59 (26.0) | 662 (39.0) | 1065 (49.8) | 959 (50.5) | 547 (49.5) | 389 (39.7) | <0.0001 |
| Patients without diabetes (n=21 577) | |||||||
| CAD, n (%) | 123 (12.2) | 1088 (15.4) | 1261 (18.5) | 615 (16.3) | 254 (15.6) | 145 (11.2) | <0.0001 |
| Hypertension, n (%) | 362 (35.9) | 2682 (38.0) | 3254 (47.7) | 1927 (51.2) | 902 (55.4) | 705 (54.4) | <0.0001 |
| CKD, n (%) | 111 (11.0) | 749 (10.6) | 641 (9.4) | 379 (10.1) | 154 (9.5) | 135 (10.4) | 0.18 |
| COPD, n (%) | 211 (20.9) | 817 (11.6) | 604 (8.9) | 314 (8.3) | 108 (6.6) | 111 (8.6) | <0.0001 |
| Malignancy, n (%) | 186 (18.5) | 1026 (14.5) | 863 (12.6) | 407 (10.8) | 119 (7.3) | 78 (6.0) | <0.0001 |
| Hyperlipidemia, n (%) | 166 (16.5) | 1671 (23.7) | 2149 (31.5) | 1203 (32.0) | 514 (31.6) | 324 (25.0) | <0.0001 |
BMI, body mass index; CAD, coronary artery disease; CKD, chronic kidney disease; COPD, chronic obstructive pulmonary disease.
Figure 1 shows the rate of in-hospital complications and mortality across BMI and glycemic groups. Hyperglycemic patients with and without diabetes had higher rates of hospital complications compared to normoglycemic patients without diabetes. In unadjusted analysis, a J-shaped curve was observed with higher rates of hospital complications and mortality in underweight patients. In multivariate analyses adjusted for patient demographics and clinical characteristics including comorbidities, severity of illness, admission diagnosis, hospital setting (ICU vs no ICU), and service (medicine vs surgery), we found that being underweight was independently associated with higher rates of composite complications among all patients (table 3). When stratifying by glycemic status, only patients without diabetes with hyperglycemia had significantly increased complications in underweight compared to normal weight (adjusted OR 1.66 (1.15 to 2.38)) (table 4). Otherwise, across all glycemic groups, BMI was not associated with higher rates of complications or in-hospital mortality.
Figure 1.
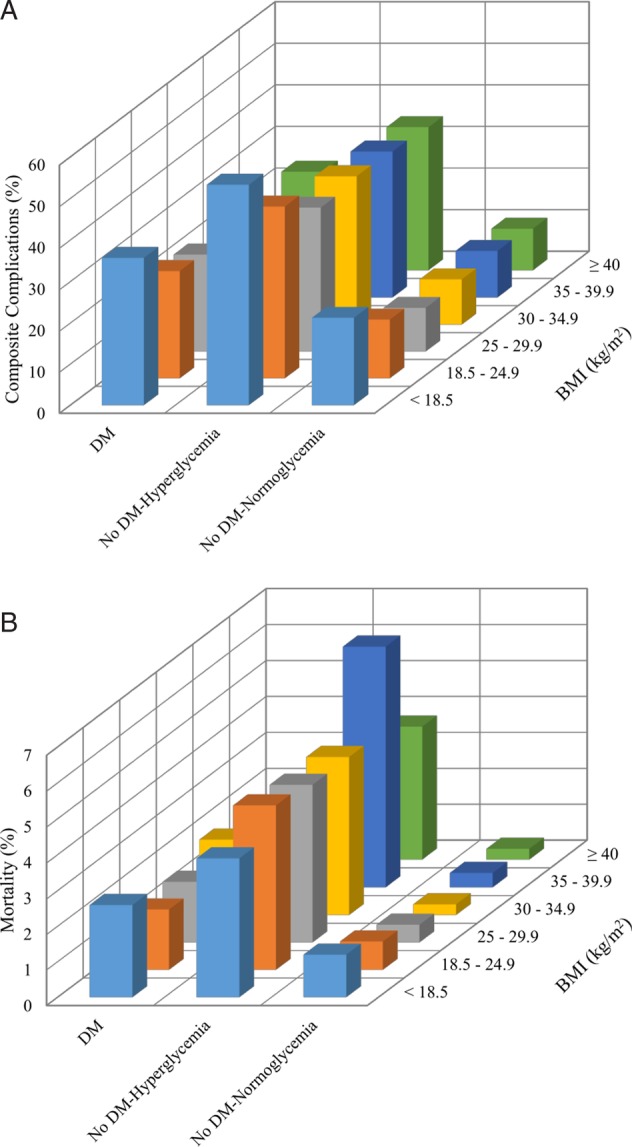
(A) Inpatient complications by BMI and glycemic status. (B) In-hospital mortality by BMI and glycemic status. BMI, body mass index; DM, diabetes mellitus.
Table 3.
Adjusted ORs for complications and mortality by BMI including all glycemic groups
| Composite complications |
In-hospital mortality |
|||||
|---|---|---|---|---|---|---|
| Unadjusted OR* | Model 1† | Model 2‡ | Unadjusted OR* | Model 1† | Model 2‡ | |
| Underweight | 1.58 (1.18 to 2.12) | 1.58 (1.18 to 2.12) | 1.35 (1.12 to 1.62) | 1.62 (0.66 to 3.95) | 1.74 (0.71 to 4.26) | 1.13 (0.69 to 1.87) |
| Normal | 1 (Reference) | 1 (Reference) | 1 (Reference) | 1 (Reference) | 1 (Reference) | 1 (Reference) |
| Overweight | 0.87 (0.75 to 1.01) | 0.87 (0.75 to 1.01) | 0.95 (0.86 to 1.05) | 1.02 (0.62 to 1.68) | 1.03 (0.73 to 1.70) | 0.90 (0.67 to 1.21) |
| Obesity grade 1 | 0.82 (0.70 to 0.95) | 0.82 (0.71 to 0.96) | 0.96 (0.86 to 1.07) | 1.25 (0.77 to 2.04) | 1.34 (0.82 to 2.20) | 0.91 (0.65 to 1.27) |
| Obesity grade 2 | 0.74 (0.62 to 0.89) | 0.76 (0.63 to 0.91) | 0.96 (0.83 to 1.11) | 0.88 (0.47 to 1.63) | 1.02 (0.54 to 1.90) | 1.20 (0.80 to 1.79) |
| Obesity grade 3 | 0.88 (0.74 to 1.06) | 0.91 (0.76 to 1.10) | 0.97 (0.83 to 1.13) | 0.93 (0.49 to 1.74) | 1.21 (0.63 to 2.33) | 0.84 (0.51 to 1.39) |
BMI categories: underweight (<18.5 kg/m2), normal (18.5–24.9 kg/m2), overweight (25–29.9 kg/m2), obesity 1 (30–34.9 kg/m2), obesity 2 (35–39.9 kg/m2), and obesity 3 (>40 kg/m2). Data reported as OR with 95% CIs.
*Crude OR.
†Model 1 adjusted for age, gender, race, and BMI.
‡Model 2: model 1+hospital setting (ICU vs non-ICU), admission team (medical vs surgical), admission diagnosis, BG on admission, medical comorbidities, and Charlson comorbidity index.
BG, blood glucose; BMI, body mass index; ICU, intensive care unit.
Table 4.
Adjusted ORs for complications and mortality by BMI and glycemic status
| Composite complications |
In-hospital mortality |
|||||
|---|---|---|---|---|---|---|
| Unadjusted OR* | Model 1† | Model 2‡ | Unadjusted OR* | Model 1† | Model 2‡ | |
| Patients with diabetes | ||||||
| Underweight | 1.58 (1.18 to 2.12) | 1.58 (1.18 to 2.12) | 1.25 (0.87 to 1.79) | 1.62 (0.66 to 3.95) | 1.74 (0.71 to 4.26) | 1.33 (0.43 to 4.09) |
| Normal | 1 (Reference) | 1 (Reference) | 1 (Reference) | 1 (Reference) | 1 (Reference) | 1 (Reference) |
| Overweight | 0.87 (0.75 to 1.01) | 0.87 (0.75 to 1.01) | 0.94 (0.79 to 1.12) | 1.02 (0.62 to 1.68) | 1.03 (0.73 to 1.70) | 1.08 (0.60 to 1.93) |
| Obesity grade 1 | 0.82 (0.70 to 0.95) | 0.82 (0.71 to 0.96) | 0.92 (0.77 to 1.10) | 1.25 (0.77 to 2.04) | 1.34 (0.82 to 2.20) | 1.58 (0.88 to 2.84) |
| Obesity grade 2 | 0.74 (0.62 to 0.89) | 0.76 (0.63 to 0.91) | 0.87 (0.70 to 1.08) | 0.88 (0.47 to 1.63) | 1.02 (0.54 to 1.90) | 1.34 (0.66 to 2.73) |
| Obesity grade 3 | 0.88 (0.74 to 1.06) | 0.91 (0.76 to 1.10) | 1.06 (0.85 to 1.33) | 0.93 (0.49 to 1.74) | 1.21 (0.63 to 2.33) | 1.58 (0.73 to 3.44) |
| Patients without diabetes with hyperglycemia | ||||||
| Underweight | 1.61 (1.25 to 2.07) | 1.63 (1.26 to 2.10) | 1.66 (1.15 to 2.38) | 0.84 (0.44 to 1.59) | 0.84 (0.44 to 1.61) | 0.73 (0.34 to 1.55) |
| Normal | 1 (Reference) | 1 (Reference) | 1 (Reference) | 1 (Reference) | 1 (Reference) | 1 (Reference) |
| Overweight | 0.75 (0.65 to 0.86) | 0.74 (0.65 to 0.86) | 0.91 (0.75 to 1.11) | 0.96 (0.69 to 1.33) | 0.96 (0.69 to 1.33) | 1.02 (0.67 to 1.56) |
| Obesity grade 1 | 0.78 (0.66 to 0.92) | 0.79 (0.67 to 0.93) | 1.00 (0.80 to 1.25) | 0.95 (0.65 to 1.40) | 0.97 (0.66 to 1.44) | 0.87 (0.52 to 1.46) |
| Obesity grade 2 | 0.76 (0.61 to 0.94) | 0.77 (0.62 to 0.96) | 0.97 (0.73 to 1.31) | 1.50 (0.97 to 1.59) | 1.56 (1.01 to 2.41) | 1.64 (0.92 to 2.92) |
| Obesity grade 3 | 0.74 (0.58 to 0.94) | 0.75 (0.59 to 0.97) | 0.95 (0.67 to 1.34) | 0.81 (0.44 to 1.47) | 0.85 (0.46 to 1.57) | 0.85 (0.38 to 1.89) |
| Patients without diabetes with normoglycemia | ||||||
| Underweight | 1.62 (1.34 to 1.97) | 1.60 (1.32 to 1.95) | 1.27 (0.96 to 1.69) | 1.65 (0.80 to 3.42) | 1.70 (0.82 to 3.51) | 1.57 (0.66 to 3.74) |
| Normal | 1 (Reference) | 1 (Reference) | 1 (Reference) | 1 (Reference) | 1 (Reference) | 1 (Reference) |
| Overweight | 0.71 (0.63 to 0.80) | 0.70 (0.62 to 0.79) | 0.96 (0.81 to 1.14) | 0.61 (0.37 to 1.02) | 0.62 (0.37 to 1.02) | 0.58 (0.30 to 1.15) |
| Obesity grade 1 | 0.73 (0.64 to 0.84) | 0.73 (0.63 to 0.84) | 0.95 (0.77 to 1.17) | 0.42 (0.20 to 0.87) | 0.45 (0.22 to 0.92) | 0.36 (0.12 to 1.07) |
| Obesity grade 2 | 0.76 (0.62 to 0.92) | 0.76 (0.63 to 0.93) | 1.10 (0.82 to 1.47) | 0.56 (0.22 to 1.43) | 0.64 (0.25 to 1.64) | 0.95 (0.32 to 2.82) |
| Obesity grade 3 | 0.67 (0.53 to 0.83) | 0.68 (0.54 to 0.85) | 0.78 (0.56 to 1.10) | 0.42 (0.13 to 1.35) | 0.53 (0.16 to 1.73) | 0.24 (0.03 to 1.86) |
BMI categories: underweight (<18.5 kg/m2), normal (18.5–24.9 kg/m2), overweight (25–29.9 kg/m2), obesity 1 (30–34.9 kg/m2), obesity 2 (35–39.9 kg/m2), and obesity 3 (>40 kg/m2). Data are reported as OR with 95% CIs.
*Crude OR.
†Model 1 adjusted for age, gender, race, and BMI.
‡Model 2: model 1+hospital setting (ICU vs non-ICU), admission team (medical vs surgical), admission diagnosis, BG on admission, medical comorbidities, and Charlson comorbidity index.
BG, blood glucose; BMI, body mass index; ICU, intensive care unit.
Discussion
This study aimed to determine the combined impact of obesity and hyperglycemia on inpatient complications and mortality rates. In agreement with previous studies,13–17 we observed that inpatient hyperglycemia is common and is associated with poor outcomes, with the highest rates of complications seen in hyperglycemic patients without diabetes, even compared to patients with diabetes. Also consistent with the literature was our finding that being underweight conferred a worse prognosis compared to normal, overweight, or obesity.29 30 After adjusting for patient demographics and clinical characteristics, no significant improvement in clinical outcomes was observed in patients who were obese compared to those with normal BMI.
Several studies have investigated the relationship between obesity, diabetes and clinical outcomes in ambulatory populations.29–34 Emerging evidence suggests that obesity may have a protective effect against morbidity and mortality, a phenomenon referred to as the ‘obesity paradox’.7–12 31 Despite a plethora of data, the effect of diabetes and glycemic status on the perceived obesity paradox remains unclear. Carnethon et al34 prospectively analyzed a population of 2625 at the time of diabetes diagnosis and observed much higher mortality rates in patients with normal BMI when compared to overweight or obese patients (categorized as BMI >25). There are multiple studies that have found similar results, with a J-shaped or U-shaped association between BMI and mortality among patients with diabetes.31–33 35 However, some limitations of these studies included broad BMI categories,33 34 small number of deaths,29 33 34 and lack of analyses of patient comorbidities.31–34 Our results were more consistent with those of Tobias et al,30 who analyzed data from two large, prospective cohort studies and found no evidence of an obesity paradox in 11 427 patients with diabetes. Conflicting data regarding the obesity paradox extends beyond the population with diabetes, and whether a paradox truly exists is an ongoing topic of debate.
To the best of our knowledge, this is the first study to explore the interplay between BMI and glycemic status and its impact on mortality and complications in hospitalized patients. Our results did not show the presence of an obesity paradox among patients with diabetes. In-hospital mortality, bacteremia, and acute myocardial infarction were complications that did not appear to be affected by BMI or glycemic status in our study. The literature remains mixed regarding the link between obesity and coronary atherosclerosis.36–40 In a recent prospective cohort study by Costanzo et al,37 clinic patients with type 2 diabetes who were overweight and obese had a higher risk of nonfatal cardiovascular events but not mortality. We did not observe higher rates of acute myocardial infarction with increasing BMI, but perhaps these patients remained at higher risk of nonfatal cardiovascular events beyond their hospital stay, which was not accounted for in our retrospective study. Additional prospective studies would be beneficial in determining long-term risk of cardiovascular events in patients across different glycemic and BMI groups.
There are a number of limitations in our study. This is a retrospective analysis, which relied on ICD-9 codes. As a result, we may have missed some diagnoses due to lack of documentation. We also used BMI as the single measure of obesity; however, fitness and waist circumference have been shown to better predict mortality compared to BMI.41–43 As with many observational studies, selection bias is another potential limitation, seeing as patients are selected based on a factor which is to be analyzed (diabetes) that is affected by an exposure (obesity), both of which share risk factors for the outcome (mortality). The only sure way to avoid such selection bias is to ensure that exposure and start of follow-up coincide.44 One of the major strengths of our study was its large sample size, which provided unique insight into how obesity relates to hospitalized patients. In addition, we adjusted for patient demographics and key clinical characteristics that included comorbid conditions, severity of illness, admission diagnosis, hospital setting (ICU vs no ICU), and service (medicine vs surgery). We did not, however, adjust for smoking or alcohol consumption which may have confounded our results, as smoking in particular has been linked to low BMI status and increased risk of mortality.30 45
In summary, we found that underweight represents an independent predictor for hospital complications; however, there was no evidence of an obesity paradox in hospitalized patients with hyperglycemia and diabetes. We also found no association between increasing BMI and mortality regardless of glycemic status.
Acknowledgments
The abstract of this study was previously presented at Endo Society, March 2015.
Footnotes
Contributors: A-SA and GEU designed the study and wrote the proposal and manuscript. MF, LB, DS, FJP, PV, and JSH contributed to the analysis and interpretation, as well as reviewing the manuscript. JW was in charge of data collection and LZ from the School of Public health conducted the statistical analysis. All listed authors were involved in critically revising the manuscript and approved the final version of the paper to be published.
Funding: This study was supported by the Jacobs Family Research Funds (GEU). GEU is supported in part by research grants from the American Diabetes Association (1-14-LLY-36), and Public Health service (PHS) grant from the Clinical Translational Science Award Program (M01 RR-00 039), National Institutes of Health, National Center for Research Resources.
Competing interests: None declared.
Provenance and peer review: Not commissioned; externally peer reviewed.
Data sharing statement: No additional data are available.
References
- 1.Ogden CL, Carroll MD, Kit BK et al. . Prevalence of childhood and adult obesity in the United States, 2011–2012. JAMA 2014;311:806–14. 10.1001/jama.2014.732 [DOI] [PMC free article] [PubMed] [Google Scholar]
- 2.World Health Organization. Obesity and overweight. Secondary obesity and overweight, 2015http://www.who.int/mediacentre/factsheets/fs311/en/ http://www.who.int/mediacentre/factsheets/fs311/en/ (accessed Apr 2016). [Google Scholar]
- 3.Flegal KM, Graubard BI, Williamson DF et al. . Excess deaths associated with underweight, overweight, and obesity. JAMA 2005;293:1861–7. 10.1001/jama.293.15.1861 [DOI] [PubMed] [Google Scholar]
- 4.Fontaine KR, Redden DT, Wang C et al. . Years of life lost due to obesity. JAMA 2003;289:187–93. 10.1001/jama.289.2.187 [DOI] [PubMed] [Google Scholar]
- 5.Gregg EW, Cheng YJ, Cadwell BL et al. . Secular trends in cardiovascular disease risk factors according to body mass index in US adults. JAMA 2005;293:1868–74. 10.1001/jama.293.15.1868 [DOI] [PubMed] [Google Scholar]
- 6.Rubenstein AH. Obesity: a modern epidemic. Trans Am Clin Climatol Assoc 2005;116:103–11; discussion 12–3. [PMC free article] [PubMed] [Google Scholar]
- 7.Andersen KK, Olsen TS. The obesity paradox in stroke: lower mortality and lower risk of readmission for recurrent stroke in obese stroke patients. Int J Stroke 2015;10:99–104. 10.1111/ijs.12016 [DOI] [PubMed] [Google Scholar]
- 8.Clark AL, Fonarow GC, Horwich TB. Impact of cardiorespiratory fitness on the obesity paradox in patients with systolic heart failure. Am J Cardiol 2015;115:209–13. 10.1016/j.amjcard.2014.10.023 [DOI] [PubMed] [Google Scholar]
- 9.Hutagalung R, Marques J, Kobylka K et al. . The obesity paradox in surgical intensive care unit patients. Intensive Care Med 2011;37:1793–9. 10.1007/s00134-011-2321-2 [DOI] [PubMed] [Google Scholar]
- 10.Kalantar-Zadeh K, Abbott KC, Salahudeen AK et al. . Survival advantages of obesity in dialysis patients. Am J Clin Nutr 2005;81:543–54. [DOI] [PubMed] [Google Scholar]
- 11.Kalantar-Zadeh K, Block G, Horwich T et al. . Reverse epidemiology of conventional cardiovascular risk factors in patients with chronic heart failure. J Am Coll Cardiol 2004;43:1439–44. 10.1016/j.jacc.2003.11.039 [DOI] [PubMed] [Google Scholar]
- 12.Wang J, Yang YM, Zhu J et al. . Obesity paradox in patients with atrial fibrillation and heart failure. Int J Cardiol 2014;176:1356–8. 10.1016/j.ijcard.2014.07.264 [DOI] [PubMed] [Google Scholar]
- 13.Clement S, Braithwaite SS, Magee MF et al. . Management of diabetes and hyperglycemia in hospitals. Diabetes Care 2004;27:553–91. 10.2337/diacare.27.2.553 [DOI] [PubMed] [Google Scholar]
- 14.Montori VM, Bistrian BR, McMahon MM. Hyperglycemia in acutely ill patients. JAMA 2002;288:2167–9. 10.1001/jama.288.17.2167 [DOI] [PubMed] [Google Scholar]
- 15.Norhammar AM, Ryden L, Malmberg K. Admission plasma glucose. Independent risk factor for long-term prognosis after myocardial infarction even in nondiabetic patients. Diabetes Care 1999;22:1827–31. [DOI] [PubMed] [Google Scholar]
- 16.Stranders I, Diamant M, van Gelder RE et al. . Admission blood glucose level as risk indicator of death after myocardial infarction in patients with and without diabetes mellitus. Arch Intern Med 2004;164:982–8. 10.1001/archinte.164.9.982 [DOI] [PubMed] [Google Scholar]
- 17.Umpierrez GE, Isaacs SD, Bazargan N et al. . Hyperglycemia: an independent marker of in-hospital mortality in patients with undiagnosed diabetes. J Clin Endocrinol Metab 2002;87:978–82. 10.1210/jcem.87.3.8341 [DOI] [PubMed] [Google Scholar]
- 18.Wahab NN, Cowden EA, Pearce NJ et al. . Is blood glucose an independent predictor of mortality in acute myocardial infarction in the thrombolytic era? J Am Coll Cardiol 2002;40:1748–54. 10.1016/S0735-1097(02)02483-X [DOI] [PubMed] [Google Scholar]
- 19.Capes SE, Hunt D, Malmberg K et al. . Stress hyperglycaemia and increased risk of death after myocardial infarction in patients with and without diabetes: a systematic overview. Lancet 2000;355:773–8. 10.1016/S0140-6736(99)08415-9 [DOI] [PubMed] [Google Scholar]
- 20.Buehler L, Fayfman M, Alexopoulos AS et al. . The impact of hyperglycemia and obesity on hospitalization costs and clinical outcome in general surgery patients. J Diabetes Complications 2015;29:1177–82. 10.1016/j.jdiacomp.2015.07.027 [DOI] [PMC free article] [PubMed] [Google Scholar]
- 21.Frisch A, Chandra P, Smiley D et al. . Prevalence and clinical outcome of hyperglycemia in the perioperative period in noncardiac surgery. Diabetes Care 2010;33:1783–8. 10.2337/dc10-0304 [DOI] [PMC free article] [PubMed] [Google Scholar]
- 22.Pomposelli JJ, Baxter JK III, Babineau TJ et al. . Early postoperative glucose control predicts nosocomial infection rate in diabetic patients. J Parenter Enteral Nutr 1998;22:77–81. 10.1177/014860719802200277 [DOI] [PubMed] [Google Scholar]
- 23.Smith RK, Broach RB, Hedrick TL et al. . Impact of BMI on postoperative outcomes in patients undergoing proctectomy for rectal cancer: a national surgical quality improvement program analysis. Dis Colon Rectum 2014;57:687–93. 10.1097/DCR.0000000000000097 [DOI] [PubMed] [Google Scholar]
- 24.Causey MW, Johnson EK, Miller S et al. . The impact of obesity on outcomes following major surgery for Crohn's disease: an American College of Surgeons National Surgical Quality Improvement Program assessment. Dis Colon Rectum 2011;54:1488–95. 10.1097/DCR.0b013e3182342ccb [DOI] [PubMed] [Google Scholar]
- 25.Ri M, Miyata H, Aikou S et al. . Effects of body mass index (BMI) on surgical outcomes: a nationwide survey using a Japanese web-based database. Surg Today 2015;45:1271–9. 10.1007/s00595-015-1231-2 [DOI] [PubMed] [Google Scholar]
- 26.Smits A, Lopes A, Das N et al. . Surgical morbidity and clinical outcomes in ovarian cancer—the role of obesity. BJOG 2016;123:300–8. [DOI] [PubMed] [Google Scholar]
- 27.Stamou SC, Nussbaum M, Stiegel RM et al. . Effect of body mass index on outcomes after cardiac surgery: is there an obesity paradox? Ann Thorac Surg 2011;91:42–7. 10.1016/j.athoracsur.2010.08.047 [DOI] [PubMed] [Google Scholar]
- 28.D'Hoore W, Bouckaert A, Tilquin C. Practical considerations on the use of the Charlson comorbidity index with administrative data bases. J Clin Epidemiol 1996;49:1429–33. 10.1016/S0895-4356(96)00271-5 [DOI] [PubMed] [Google Scholar]
- 29.Chaturvedi N, Fuller JH. Mortality risk by body weight and weight change in people with NIDDM. The WHO Multinational Study of Vascular Disease in Diabetes. Diabetes Care 1995;18:766–74. [DOI] [PubMed] [Google Scholar]
- 30.Tobias DK, Pan A, Jackson CL et al. . Body-mass index and mortality among adults with incident type 2 diabetes. N Engl J Med 2014;370:233–44. 10.1056/NEJMoa1304501 [DOI] [PMC free article] [PubMed] [Google Scholar]
- 31.Khalangot M, Tronko M, Kravchenko V et al. . Body mass index and the risk of total and cardiovascular mortality among patients with type 2 diabetes: a large prospective study in Ukraine. Heart 2009;95:454–60. 10.1136/hrt.2008.150524 [DOI] [PubMed] [Google Scholar]
- 32.Logue J, Walker JJ, Leese G et al. . Association between BMI measured within a year after diagnosis of type 2 diabetes and mortality. Diabetes Care 2013;36:887–93. 10.2337/dc12-0944 [DOI] [PMC free article] [PubMed] [Google Scholar]
- 33.Ross C, Langer RD, Barrett-Connor E. Given diabetes, is fat better than thin? Diabetes Care 1997;20:650–2. 10.2337/diacare.20.4.650 [DOI] [PubMed] [Google Scholar]
- 34.Carnethon MR, De Chavez PJ, Biggs ML et al. . Association of weight status with mortality in adults with incident diabetes. JAMA 2012;308:581–90. 10.1001/jama.2012.9282 [DOI] [PMC free article] [PubMed] [Google Scholar]
- 35.Kotagal M, Symons RG, Hirsch IB et al. . Perioperative hyperglycemia and risk of adverse events among patients with and without diabetes. Ann Surg 2015;261:97–103. 10.1097/SLA.0000000000000688 [DOI] [PMC free article] [PubMed] [Google Scholar]
- 36.Auer J, Weber T, Berent R et al. . Obesity, body fat and coronary atherosclerosis. Int J Cardiol 2005;98:227–35. 10.1016/j.ijcard.2003.11.007 [DOI] [PubMed] [Google Scholar]
- 37.Costanzo P, Cleland JG, Pellicori P et al. . The obesity paradox in type 2 diabetes mellitus: relationship of body mass index to prognosis: a cohort study. Ann Intern Med 2015;162:610–18. 10.7326/M14-1551 [DOI] [PubMed] [Google Scholar]
- 38.Manson JE, Willett WC, Stampfer MJ et al. . Body weight and mortality among women. N Engl J Med 1995;333:677–85. 10.1056/NEJM199509143331101 [DOI] [PubMed] [Google Scholar]
- 39.Rubinshtein R, Halon DA, Jaffe R et al. . Relation between obesity and severity of coronary artery disease in patients undergoing coronary angiography. Am J Cardiol 2006;97: 1277–80. 10.1016/j.amjcard.2005.11.061 [DOI] [PubMed] [Google Scholar]
- 40.Zeller M, Steg PG, Ravisy J et al. . Relation between body mass index, waist circumference, and death after acute myocardial infarction. Circulation 2008;118:482–90. 10.1161/CIRCULATIONAHA.107.753483 [DOI] [PubMed] [Google Scholar]
- 41.Church TS, LaMonte MJ, Barlow CE et al. . Cardiorespiratory fitness and body mass index as predictors of cardiovascular disease mortality among men with diabetes. Arch Intern Med 2005;165:2114–20. 10.1001/archinte.165.18.2114 [DOI] [PubMed] [Google Scholar]
- 42.Wei M, Kampert JB, Barlow CE et al. . Relationship between low cardiorespiratory fitness and mortality in normal-weight, overweight, and obese men. JAMA 1999;282:1547–53. 10.1001/jama.282.16.1547 [DOI] [PubMed] [Google Scholar]
- 43.Staiano AE, Reeder BA, Elliott S et al. . Body mass index versus waist circumference as predictors of mortality in Canadian adults. Int J Obes (Lond) 2012;36:1450–4. 10.1038/ijo.2011.268 [DOI] [PMC free article] [PubMed] [Google Scholar]
- 44.Lajous M, Banack HR, Kaufman JS et al. . Should patients with chronic disease be told to gain weight? The obesity paradox and selection bias. Am J Med 2015;128:334–6. 10.1016/j.amjmed.2014.10.043 [DOI] [PMC free article] [PubMed] [Google Scholar]
- 45.Chiolero A, Faeh D, Paccaud F et al. . Consequences of smoking for body weight, body fat distribution, and insulin resistance. Am J Clin Nutr 2008;87:801–9. [DOI] [PubMed] [Google Scholar]