

Abstract
Objective
To prospectively examine whether children of women with a pregnancy affected by severe pre-eclampsia (PE), compared to children of women without a PE-affected pregnancy, have differences in neurodevelopmental performance up to 5 years of age.
Design
Prospective cohort study.
Setting
Tertiary care centre.
Participants
Women were recruited following a PE-affected pregnancy. After each PE participant was recruited, the next normotensive woman without a prior history of PE and matched by parity, maternal age and race was invited to participate. Women with a history of chronic hypertension, diabetes or renal disease were excluded. Total enrolment included 129 PE-affected and 140 normotensive mothers.
Outcome measures
The primary outcome measure was failure of the Ages and Stages Questionnaire (ASQ). The ASQ was completed yearly, until age 5.
Results
A significant difference was found in the proportion of ASQ categories failed in year 3 (p<0.05), and this approached significance in years 1 and 4 (p<0.10 and p<0.15, respectively). At year 1, the number of ASQ categories failed was significantly greater among children born to PE mothers. A subgroup analysis revealed that a significant proportion of PE children born preterm (<37 weeks) failed the ASQ in years 3 and 4 (p<0.05), and when failed, those who were preterm failed significantly more categories (p<0.05). A trend towards increased failure in the gross motor category was found. There was a significant positive correlation between maternal lifetime CVD risk score and number of ASQ categories failed at years 1 and 3 (p<0.05).
Conclusions
Severe PE is associated with other adverse pregnancy outcomes, including intrauterine growth restriction and preterm birth, all of which are associated with increased neurodevelopment delays. Thus, PE indicates a need for early screening and intervention at the neurodevelopmental level to improve children's long-term health, with larger studies required to tease out contributing factors.
Keywords: NEONATOLOGY, OBSTETRICS, PREVENTIVE MEDICINE
Strengths and limitations of this study.
This study follows offspring of pre-eclamptic mothers from birth until age 5, filling the knowledge gap regarding the first few years of life.
There was a considerable number of mothers and offspring that were lost to follow-up by 3 years postpartum, resulting in a sample size too small to provide significant results for certain measures.
Some variables were not well collected (child blood pressure), while others were added part way through the study (child waist and hip circumference), resulting in an incomplete set of data for some study participants.
Use of the validated Ages and Stages Questionnaire permits early screening and identification of at-risk offspring, to allow for timely intervention and an overall improvement in children's long-term health.
Introduction
Hypertensive disorders are among the most common complications of pregnancy. Gestational hypertension occurs in 6–17% of pregnancies, and is defined as newly elevated blood pressure (BP) after 20 weeks' gestation in a previously normotensive individual. Pre-eclampsia (PE) affects 2–7% of otherwise healthy women, and is diagnosed by newly elevated BP after 20 weeks’ gestation, with associated proteinuria.1 Presently, the aetiology of PE is largely unknown. Many theories have been proposed, including mechanisms involving oxidative stress, angiogenic imbalance and immunological intolerance between fetoplacental and maternal tissue.2 Delivery is the only definitive cure, with other treatments focused on sign and symptom management.2 It is well known that hypertensive disorders of pregnancy are associated with adverse health outcomes including perinatal deaths, preterm birth, intrauterine growth restriction (IUGR), neonatal morbidity and infants that are small for gestational age (GA).1 3
Previous studies have demonstrated a positive link between PE and offspring neurodevelopmental delay (ND),4–8 but many other studies have disputed this claim,6 9 10 thus no conclusions can be made. The inconsistencies between studies investigating the implications of PE pregnancies on offspring indicate a need for further research. Moreover, many studies either examine immediate postnatal or neonatal complications, or follow-up with mothers and offspring years down the line, resulting in a knowledge gap regarding the first few years of life. Since earlier detection allows for earlier intervention, there is a need to identify those with increased risk in early childhood.
Using the Preeclampsia New Emerging Team (PE-NET) longitudinal prospective cohort that has previously been used to investigate maternal outcomes and cardiovascular risk factors,11–13 this study examined whether infants of women with a PE pregnancy, compared to infants of women without a PE pregnancy, have differences in ND, and whether it changes over time. We hypothesised that infants born to women with PE-affected pregnancies will display markers indicating an increased risk of ND.
Methods
Study design
This longitudinal prospective cohort study compared assessments of ND in the offspring born to women with/without PE yearly, from age 1 to 5. Neurodevelopment was assessed via the Ages and Stages Questionnaire (ASQ), the categories of which include gross motor, fine motor, communication, personal social and problem-solving skills.14 The ASQ was chosen for its consistency, specificity, cost-effectiveness and flexibility in administration. Each year, parents were mailed the ASQ and asked to complete it through home observation of their child. Additionally, participants were asked to return at 1, 3 and 5 years postpartum for a clinical assessment. A study reminder was mailed every 6 months, and reminders by telephone or email were sent 1 week prior to a scheduled visit. If participants missed appointments, they were contacted weekly for the following month before being considered as lost to follow-up.
Participants
The recruitment criteria and process have been previously described.11 In brief, women were recruited into the PE-NET longitudinal prospective cohort at the Kingston General Hospital and Ottawa General Hospital between September 2003 and October 2009. All the women diagnosed with PE (BP>140/90 mm Hg and proteinuria>300 mg/24 hours or ≥1+ on repeat dipstick) at the time of presentation or admission/transfer were approached to participate. A trained research nurse explained the study and obtained consent. After each PE participant was recruited, the next normotensive woman without a prior history of PE and matched by parity (0 vs 1 or greater), maternal age (±5 years) and race was invited to participate. Women with a history of chronic hypertension, diabetes (including development of gestational diabetes) or renal disease were excluded from the study.15 A total of 129 women with PE and 140 normotensive control women were enrolled in the study. Thirty-four participants were diagnosed with mild PE, as defined above. Ninety-five participants met the criteria for severe PE, which included the above definition and one or more of the following: systolic BP≥160 mm Hg, diastolic BP≥110 mm Hg, proteinuria≥5 g in 24 hours or ≥3+ on dipstick, oliguria (≤500 mL in 24 hours), cerebral or visual disturbances, epigastric pain, thrombocytopenia (<150 000×109/L), increase in aspartate aminotransferase (AST) (>46 U/L) and alanine aminotransferase (ALT) (>40 U/L), elevated serum creatinine (>106 µmol/L), pulmonary oedema or cyanosis, IUGR or eclampsia. All BPs had to be elevated on two measurements taken at least 6 hours apart.
The mild PE group (n=34 at enrolment) is excluded from the current study for many reasons: (1) no difference was seen between the mild PE group and the controls in the comparisons done; (2) the number of patients with mild PE seen in the follow-up was small and (3) we focused on those who experienced more severe disease.
Statistical methods
Data collected at time of recruitment and follow-up after 1 year were used to calculate maternal 30-year16 and lifetime17 risk estimates for cardiovascular risk (CVD). For comparisons of categorical variables, the Mantel-Haenszel χ2 test was used. The Fisher's exact method was used if cell counts were <5. For continuous variables, the Mann-Whitney U test was used. A logistic regression analysis was completed for years 1, 2 and 3 of follow-up to examine risk factors for ASQ failure. Variables were removed from the model stepwise based on the highest p value until all those remaining had a p<0.1. PE, IUGR and GA were forced into the final model, regardless of p value, to control for their effects. The Pearson correlation coefficient was used to explore the relationships between maternal CVD risk estimates and child neurodevelopment. For all tests, a 95% confidence level was used to determine significance. SAS V.9.3 and R V.2.15.2 were used for all analyses.
Results
Figure 1 indicates the number of participants in each group throughout the study.
Figure 1.
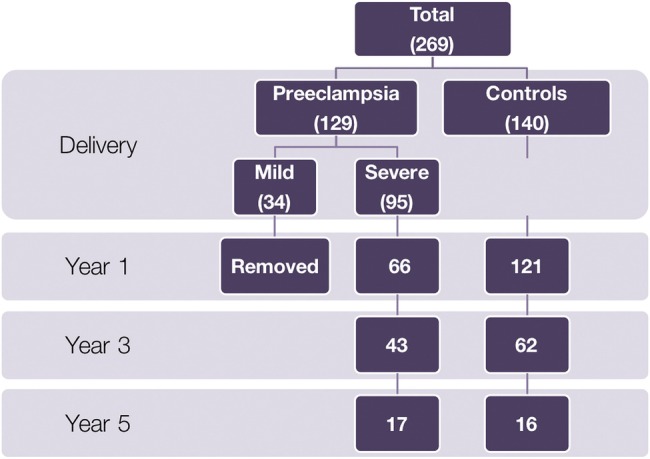
Flow diagram of study participants at years 1–5.
There were no significant differences in maternal characteristics at baseline, including age, height, weight, race, education level, household income, smoking status, parity or breastfeeding status. There was a significant difference between groups regarding the mode of delivery and having a previous pregnancy with PE, which is expected given the nature of the participants and eligibility criteria for the study (table 1).
Table 1.
Maternal characteristics at baseline visit
| Maternal characteristics | Control (n=140) | Severe PE (n=95) | p Value |
|---|---|---|---|
| Maternal age (years), median (IQR) | 31.0 (27.75–33.25) | 31.0 (28.0–34.0) | 0.88 |
| Maternal height (cm), median (IQR) | 165.0 (160.0–170.0) | 163.0 (160.0–168.0) | 0.13 |
| Maternal weight (kg), median (IQR) | |||
| Birth | 66.5 (58.0–77.0) | 68.0 (61.5–82.0) | 0.23 |
| Year 1 | 67.5 (59.4–81.0) | 71.95 (63.1–79.8) | 0.19 |
| Year 3 | 72.1 (63.4–90.3) | 68.7 (61.9–79.8) | 0.33 |
| Maternal BMI (kg/m2), median (IQR) | |||
| Birth | 24.2 (21.7–27.4) | 25.3 (21.8–30.5) | 0.09 |
| Year 1 | 25.3 (22.0–29.7) | 26.6 (23.0–30.5) | 0.08 |
| Year 3 | 26.0 (22.4–32.3) | 25.6 (22.7–30.3) | 0.68 |
| Maternal race, n (%) | |||
| White | 123 (87.9) | 76 (80.0) | 0.11 |
| Other | 17 (12.1) | 19 (20.0) | |
| Maternal education level, n (%) | |||
| High school or less | 9 (6.4) | 14 (14.7) | 0.11 |
| Postsecondary not complete | 16 (11.4) | 11 (11.6) | |
| Postsecondary complete | 115 (82.1) | 70 (73.7) | |
| Household income ($), n (%) | |||
| <29 999 | 8 (5.7) | 8 (8.4) | 0.01 |
| 30 000–59 999 | 17 (12.1) | 23 (24.2) | |
| 60 000–89 999 | 32 (22.9) | 26 (27.4) | |
| >90 000 | 77 (55.0) | 33 (34.7) | |
| Did not respond | 6 (4.3) | 5 (5.3) | |
| Maternal smoking, n (%) | |||
| Yes | 3 (2.1) | 5 (5.3) | 0.27 |
| No | 137 (97.9) | 90 (94.7) | |
| Parity, n (%) | |||
| Nulliparous | 65 (46.4) | 44 (46.3) | 1.00 |
| Multiparous | 75 (53.6) | 51 (53.7) | |
| Previous pregnancy with PE, n (%) | |||
| Yes | 0 (0.0) | 10 (10.5) | <0.0001 |
| No | 140 (100.0) | 85 (89.5) | |
| Mode of delivery, n (%) | |||
| Vaginal | 99 (70.7) | 30 (31.6) | <0.0001 |
| Caesarean | 41 (29.3) | 65 (68.4) | |
| Breast feeding | |||
| Total, n | 98 | 52 | |
| Yes, n (%) | 87 (88.8) | 50 (96.2) | 0.22 |
| Length of time (weeks), median (IQR) | 32 (20.0–48.0) | 28.0 (8.8–48.0) | 0.63 |
BMI, body mass index; PE, pre-eclampsia.
There were significant differences between the majority of infant characteristics at birth, including GA, 5 min Apgar score, admission level and length of stay, and presence of IUGR (table 2).
Table 2.
Infant characteristics at birth
| Infant characteristics | Control (n=140) | Severe PE (n=95) | p Value |
|---|---|---|---|
| Sex, n (%) | |||
| Male | 75 (53.6) | 56 (59.0) | NS |
| Female | 65 (46.4) | 39 (41.1) | <0.001 |
| GA at birth | |||
| Weeks, median (IQR) | 39.5 (38.0–41.0) | 36.0 (32.0–38.0) | <0.001 |
| <37 weeks, n (%) | 5 (0.04) | 59 (0.62) | <0.001 |
| ≥37 weeks, n (%) | 135 (0.96) | 36 (0.38) | |
| Placental weight | |||
| Grams, median (IQR) | 555.0 (480.0–639.0) | 413.0 (294.2–596.8) | <0.001 |
| Magnesium sulphate usage, n (%) | |||
| Yes | 1 (0.7) | 48 (50.5) | <0.001 |
| No | 139 (99.3) | 47 (49.5) | |
| If yes, usage <33 weeks gestation, n (%) | 0 (0.0) | 20 (41.7) | |
| Apgar score, median (IQR) | |||
| 1 min | 8.0 (7.0–9.0) | 8.0 (6.0–9.0) | <0.01 |
| 5 min | 9.0 (9.0–9.0) | 9.0 (8.0–9.0) | <0.001 |
| Admission info | |||
| Combined care or level 1, n (%) | 127 (90.7) | 36 (37.9) | <0.001 |
| Length of stay (days), median (IQR) | 2.0 (2–3) | 3.0 (2–4.5) | <0.001 |
| Level 2 or 3, n (%) | 13 (9.3) | 59 (62.1) | <0.001 |
| Length of stay (days), median (IQR) | 4.5 (3–5.5) | 15.5 (6.3–32.8) | <0.01 |
| Transferred before discharge, n (%) | 0 (0) | 9 (9) | |
| IUGR, n (%) | 0 (0.0) | 25 (26.3) | <0.001 |
GA, gestational age; IUGR, intrauterine growth restriction; PE, pre-eclampsia.
Figure 2 compares the proportion and number of ASQ categories failed at each year of follow-up between the severe PE and control groups. A significant difference was found in the proportion of categories failed in year 3 (p<0.05), and this approached significance in years 1 and 4 (p<0.10 and p<0.15, respectively). Although a significant difference was not found in year 2, the trend is clearly present. Comparison of the distribution of the number of categories failed, among those who failed at least one category, indicated that severe PE children tended to fail more categories than controls at year 1 (p<0.10).
Figure 2.

Comparison of ASQ failures between the severe PE and control groups at years 1–5 of follow-up.  <0.05, + <0.10,
  <0.15, p value based on Mantel-Haenszel χ2. Fisher's exact test was used when cell counts were <5. Comparison of the proportion of failures in the severe PE group to the control group at each year of follow-up.
  <0.05,
  <0.10,
  <0.15, p value based on Wilcoxon rank-sum test. Comparison of the distribution of the number of categories failed, among those participants who failed at least one category, between the severe PE group and the control group at each year of follow-up. ASQ, Age and Stages Questionnaire; PE, pre-eclampsia.
A subgroup analysis was performed looking at only patients with PE, categorised by preterm (<37 weeks) and term (≥37 weeks). It was found that GA appears to significantly contribute to the relationship between PE and failure of ASQ categories (figure 3). A significant proportion of PE children born preterm failed the ASQ in years 3 and 4 (p<0.05). In addition, it was found that when failed, those who were preterm tended to fail in more categories. This was significant at years 3 and 4 (p<0.05) and approached significance at years 2 and 5 (p<0.10).
Figure 3.

Comparison of ASQ failures between the PE and preterm and PE and term groups at years 1–5 of follow-up. <0.05, + <0.10, <0.15, p value based on Mantel-Haenszel χ2. Fisher's exact test was used when cell counts were <5. Comparison of the proportion of failures in the <37 weeks to the ≥37 weeks GA group at each year of follow-up. <0.05, <0.10, <0.15, p value based on Wilcoxon rank-sum test. Comparison of the distribution of the number of categories failed, among those participants who failed at least one category, between the <37 weeks and the ≥37 weeks GA group at each year of follow-up. ASQ, Age and Stages Questionnaire; GA, gestational age; PE, pre-eclampsia; Wks, weeks.
A logistic regression analysis examining risk factors for ASQ failure was performed for years 1, 2 and 3 of follow-up, considering the variables MgSO4 usage, maternal smoking, socioeconomic status (a combination of income, maternal and paternal education), sex, parity (multiparous or nulliparous) and breast feeding (did not breast feed, breast fed <6 months and breast fed ≥6 months) (table 3). As well, severe PE, GA and IUGR were forced into the model regardless of p value, due to their well-known effects. Males had a greater risk of ASQ failure than females with an OR of 2.31 (95% CI 0.88 to 6.05) at year 1 and 2.72 (95% CI 1.11 to 6.70) at year 2. This relationship was not significant by year 3. MgSO4 usage was retained in the model at year 1 only, with an OR of 2.69 (95% CI 0.73 to 9.99). The diagnosis of IUGR increased the risk of ASQ failures in years 1, 2 and 3, with ORs of 2.22 (95% CI 0.53 to 9.22), 1.63 (95% CI 0.30 to 8.85) and 3.96 (95% CI 0.71 to 21.93), respectively. Increasing GA was protective against ASQ failure with ORs of 0.96 (95% CI 0.83 to 1.10), 0.84 (95% CI 0.73 to 0.98) and 0.94 (95% CI 0.79 to 1.11) at years 1, 2 and 3, respectively. Interestingly, severe PE appeared to be protective in the first 2 years, while it increased the risk of ASQ failures in year 3 with an OR of 2.31 (95% CI 0.63 to 8.53). As well, multiparity was a risk factor at year 3 with an OR of 2.74 (95% CI 0.92 to 8.17).
Table 3.
Logistic regression analysis of ASQ failures at years 1, 2 and 3 of follow-up
| OR (95% CI) |
|||
|---|---|---|---|
| Variable | Year 1 (n=197) | Year 2 (n=170) | Year 3 (n=99) |
| Sex (male vs female) | 2.31 (0.88 to 6.05) | 2.72 (1.11 to 6.70) | – |
| IUGR (yes vs no) | 2.22 (0.53 to 9.22) | 1.63 (0.30 to 8.85) | 3.96 (0.71 to 21.93) |
| MgSO4 (yes vs no) | 2.69 (0.73 to 9.99) | – | – |
| Gestational age (weeks) | 0.96 (0.83 to 1.10) | 0.84 (0.73 to 0.98) | 0.94 (0.79 to 1.11) |
| Severe PE vs normotensive | 0.90 (0.24 to 3.34) | 0.63 (0.19 to 2.09) | 2.31 (0.63 to 8.53) |
| Parity (multiparous vs nulliparous) | – | – | 2.74 (0.92 to 8.17) |
ASQ, Age and Stages Questionnaire; IUGR, intrauterine growth restriction; MgSO4, magnesium sulfate; PE, pre-eclampsia.
Infants born to PE mothers tended to fail more often in the gross motor ASQ category. This was significant in year 2 (46.15% vs 5.26%, p=0.01), and trended towards significance in year 1 (42.86% vs 23.08%, p=0.32) and year 3 (21.43% vs 0%, p=0.24). A larger sample size is needed to confirm this trend.
Significant correlations were noted between maternal lifetime risk score and number of ASQ categories failed at year 1 (r=0.20, p=0.008) and year 3 (r=0.23, p=0.026). Ordinal regression was explored, but was not possible because the proportional odds assumption did not hold true, and the sample size was not large enough to make proper adjustments.
Discussion
Mild PE is not associated with adverse ND outcomes in offspring. Infants born to mothers with severe PE were more likely to have failed in at least one ASQ category (figure 2), indicating ND, up to and including 3 years. This is in keeping with Ehrenstein et al18 who found a slightly reduced cognitive performance in adult men exposed to gestational hypertensive disorders. In addition, Sorensen et al7 revealed that maternal hypertension was an independent risk factor for the development of schizophrenia in offspring later in life, and Tuovinen et al19 showed that hypertensive disorders in pregnancy are associated with lower intellectual abilities in 20-year-old male offspring in a subgroup of the Helsinki Birth Cohort. However, a further investigation of this cohort revealed that it was hypertension without proteinuria that was associated with an increased risk of serious mental disorders requiring hospitalisation or contributing to death, while PE was actually associated with a lower risk.9 These discrepancies between findings indicate that further studies are needed to better understand this association.
Severe PE-affected offspring can be viewed as having a ‘severe PE syndrome’, which includes other adverse pregnancy outcomes, including IUGR and earlier GA. For instance, table 3 suggests that these outcomes are contributors to ASQ failure in years 1–3, with MgSO4 usage also affecting this finding in year 1, but all of these variables may simply be considered markers of severe PE. Infants with IUGR are more likely to have significant placental issues often seen with severe PE, MgSO4 is the standard treatment for severe elevations in BP due to PE and earlier delivery is required when PE is severe and can no longer be medically managed. Severe PE itself was trending towards significant in year 3 (OR 2.31; 95% CI 0.63 to 8.53) but did not reach it, potentially due to the small sample size (n=99). While previous studies have indicated that earlier GA and IUGR are the primary risk factors in this population,20 others have shown that among growth-restricted infants, those born to mothers with PE have lower IQ scores than those without PE-complicated pregnancies, indicating that PE itself is also a major contributor.4 Follow-up studies conducted on the PE-NET cohort also support the effects of severe PE on cognitive ability. Ratsep et al21 found impairment in working memory in the offspring of PE mothers, based on psychometric testing, as well as visuospatial processing. A smaller cohort of patients was followed up with brain MRI at a mean age of 9.66 years for PE offspring and 9.79 years for controls. This study revealed many structural and vascular anatomic changes in the brains of PE offspring that shared similarities with alterations found in autism.22 The deficits in higher level cognitive functioning reveal that the increased risk seen with severe PE in year 3 is likely the beginning of a trend, but larger studies with longer follow-up are needed to further define this relationship.
Interestingly, our data indicated a slightly decreased gross motor performance compared to the other categories measured. This is in contrast to Whitehouse et al8 who found that gestational hypertension and PE reduced verbal ability in offspring, but non-verbal performance was unaffected. Along with previously discussed findings, further studies are needed to tease out the true nature of developmental deficits experienced in this population.
Last, there was a significant positive correlation between maternal lifetime CVD risk score and number of ASQ categories failed at years 1 and 3 (p<0.05). Likewise, Krakowiak et al23 revealed that children aged 2–5 years exposed to metabolic conditions in pregnancy (diabetes, hypertension or obesity) scored lower on neurodevelopmental assessments. These persistent NDs indicate a need for early childhood interventions to ensure that efforts are made to reduce their persistence into school age.
There are many limitations to the study that must be addressed. The considerable number of mothers and offspring that were lost to follow-up by 3 years postpartum (figure 1) resulted in a sample size too small to provide significant results for certain measures. On the basis of the failure rates observed at each year, we would need a sample size of 172 severe PE and 172 controls at year 1, 359 severe PE and 359 controls at year 2, and 96 severe PE and 96 controls at year 3, to reach a desired power of 80%.24 In addition, the group lost to follow-up by 3 years postpartum contained a significant number of patients with mild PE, and along with the small amount of patients in this group to begin with, we were unable to include this group in the analyses. Future studies should include this subgroup, and we would expect the effects found to be lesser than what was observed in the severe PE group. Furthermore, only ∼6% of control mothers were at high risk for cardiometabolic disease,13 which must be considered as the issue driving the PE. Last, some variables were not well collected (child BP), while others were added part way through the study (child waist and hip circumference), resulting in an incomplete set of data for some study participants.
Pregnancy is a useful way to identify women at risk for CVD.11–13 Our findings indicate that it may also allow us to identify offspring at risk from a neurodevelopmental perspective. This provides us a unique opportunity to use maternal health complications to improve whole family outcomes. By identifying these women at the time of delivery, early screening and follow-up of offspring can help ensure that those individuals at risk are identified in a timelier manner. This will allow for earlier intervention and an overall improvement in children's long-term health.
Acknowledgments
The authors thank Heather Ramshaw, Michelle Roddy, Logan Barr and Matthew Ratsep at the Queen's Perinatal Research Unit and Ruth White at the Ottawa Hospital Research Institute for their dedicated assistance in recruitment, follow-up and data collection.
Footnotes
Contributors: MW, GNS and S-WW designed the study. GNS, MW and S-WW contributed to acquisition of data. CW and JP completed analysis and interpretation of data. All authors assisted in drafting and/or critically reviewing the manuscript. All authors have approved the final version and agreed to be accountable for all aspects of the work.
Funding: Funding for the PE-NET cohort was provided by the Canadian Institutes of Health Research ( FMI 63194) and the Heart and Stroke Foundation of Canada (PG-03-0175-PE-NET).
Competing interests: None declared.
Ethics approval: This study reviewed data that had been previously collected with approval from the Queen's University Health Sciences & Affiliated Teaching Hospitals Research Ethics Board (OBGY-108-03).
Provenance and peer review: Not commissioned; externally peer reviewed.
Data sharing statement: Extra data are available by emailing Dr Graeme Smith.
References
- 1.Geelhoed JJ, Fraser A, Tilling K et al. Preeclampsia and gestational hypertension are associated with childhood blood pressure independently of family adiposity measures: the Avon Longitudinal Study of Parents and Children. Circulation 2010;122:1192–9. 10.1161/CIRCULATIONAHA.110.936674 [DOI] [PMC free article] [PubMed] [Google Scholar]
- 2.Bell MJ. A historical overview of preeclampsia-eclampsia. J Obstet Gynecol Neonatal Nurs 2010;39:510–18. 10.1111/j.1552-6909.2010.01172.x [DOI] [PMC free article] [PubMed] [Google Scholar]
- 3.Langenveld J, Ravelli AC, van Kaam AH et al. Neonatal outcome of pregnancies complicated by hypertensive disorders between 34 and 37 weeks of gestation: a 7 year retrospective analysis of a national registry. Am J Obstet Gynecol 2011;205:540.e1–7. 10.1016/j.ajog.2011.07.003 [DOI] [PubMed] [Google Scholar]
- 4.Many A, Fattal A, Leitner Y et al. Neurodevelopmental and cognitive assessment of children born growth restricted to mothers with and without preeclampsia. Hypertens Pregnancy 2003;22:25–9. 10.1081/PRG-120016791 [DOI] [PubMed] [Google Scholar]
- 5.McCowan LM, Pryor J, Harding JE. Perinatal predictors of neurodevelopmental outcome in small-for-gestational-age children at 18 months of age. Am J Obstet Gynecol 2002;186:1069–75. 10.1067/mob.2002.122292 [DOI] [PubMed] [Google Scholar]
- 6.Silveira RC, Procianoy RS, Koch MS et al. Growth and neurodevelopment outcome of very low birth weight infants delivered by preeclamptic mothers. Acta Paediatr 2007;96:1738–42. 10.1111/j.1651-2227.2007.00552.x [DOI] [PubMed] [Google Scholar]
- 7.Sorensen HJ, Mortensen EL, Reinisch JM et al. Do hypertension and diuretic treatment in pregnancy increase the risk of schizophrenia in offspring? Am J Psychiatry 2003;160:464–8. 10.1176/appi.ajp.160.3.464 [DOI] [PubMed] [Google Scholar]
- 8.Whitehouse AJ, Robinson M, Newnham JP et al. Do hypertensive diseases of pregnancy disrupt neurocognitive development in offspring? Paediatr Perinat Epidemiol 2012;26:101–8. 10.1111/j.1365-3016.2011.01257.x [DOI] [PubMed] [Google Scholar]
- 9.Tuovinen S, Raikkonen K, Pesonen AK et al. Hypertensive disorders in pregnancy and risk of severe mental disorders in the offspring in adulthood: the Helsinki Birth Cohort Study. J Psychiatr Res 2012;46:303–10. 10.1016/j.jpsychires.2011.11.015 [DOI] [PubMed] [Google Scholar]
- 10.Leonard H, de Klerk N, Bourke J et al. Maternal health in pregnancy and intellectual disability in the offspring: a population-based study. Ann Epidemiol 2006;16:448–54. 10.1016/j.annepidem.2005.05.002 [DOI] [PubMed] [Google Scholar]
- 11.Smith GN, Walker MC, Liu A et al. A history of preeclampsia identifies women who have underlying cardiovascular risk factors. Am J Obstet Gynecol 2009;200:58.e1–8. 10.1016/j.ajog.2008.06.035 [DOI] [PubMed] [Google Scholar]
- 12.Smith GN, Pudwell J, Walker M et al. Ten-year, thirty-year, and lifetime cardiovascular disease risk estimates following a pregnancy complicated by preeclampsia. J Obstet Gynaecol Can 2012;34:830–5. 10.1016/S1701-2163(16)35381-6 [DOI] [PubMed] [Google Scholar]
- 13.Smith GN, Pudwell J, Walker M et al. Risk estimation of metabolic syndrome at one and three years after a pregnancy complicated by preeclampsia. J Obstet Gynaecol Can 2012;34:836–41. 10.1016/S1701-2163(16)35382-8 [DOI] [PubMed] [Google Scholar]
- 14.Squires J, Bricker D, Potter L. Revision of a parent-completed developmental screening tool: ages and stages questionnaires. J Pediatr Psychol 1997;22:313–28. 10.1093/jpepsy/22.3.313 [DOI] [PubMed] [Google Scholar]
- 15.ACOG Committee on Practice Bulletins—Obstetrics. ACOG practice bulletin. Diagnosis and management of preeclampsia and eclampsia. Number 33, January 2002. Obstet Gynecol 2002;99:159–67. [DOI] [PubMed] [Google Scholar]
- 16.Pencina MJ, D'Agostino RB Sr, Larson MG et al. Predicting the 30-year risk of cardiovascular disease: the framingham heart study. Circulation 2009;119:3078–84. 10.1161/CIRCULATIONAHA.108.816694 [DOI] [PMC free article] [PubMed] [Google Scholar]
- 17.Lloyd-Jones DM, Leip EP, Larson MG et al. Prediction of lifetime risk for cardiovascular disease by risk factor burden at 50 years of age. Circulation 2006;113:791–8. 10.1161/CIRCULATIONAHA.105.548206 [DOI] [PubMed] [Google Scholar]
- 18.Ehrenstein V, Rothman KJ, Pedersen L et al. Pregnancy-associated hypertensive disorders and adult cognitive function among Danish conscripts. Am J Epidemiol 2009;170:1025–31. 10.1093/aje/kwp223 [DOI] [PubMed] [Google Scholar]
- 19.Tuovinen S, Raikkonen K, Kajantie E et al. Hypertensive disorders in pregnancy and intellectual abilities in the offspring in young adulthood: the Helsinki Birth Cohort Study. Ann Med 2012;44:394–403. 10.3109/07853890.2011.573497 [DOI] [PubMed] [Google Scholar]
- 20.Love ER, Crum J, Bhattacharya S. Independent effects of pregnancy induced hypertension on childhood development: a retrospective cohort study. Eur J Obstet Gynecol Reprod Biol 2012;165:219–24. 10.1016/j.ejogrb.2012.08.015 [DOI] [PubMed] [Google Scholar]
- 21.Ratsep MT, Hickman AF, Maser B et al. Impact of preeclampsia on cognitive function in the offspring. Behav Brain Res 2016;302:175–81. 10.1016/j.bbr.2016.01.030 [DOI] [PubMed] [Google Scholar]
- 22.Ratsep MT, Paolozza A, Hickman AF et al. Brain structural and vascular anatomy is altered in offspring of pre-eclamptic pregnancies: a pilot study. Am J Neuroradiol 2015;37:939–45. 10.3174/ajnr.A4640 [DOI] [PMC free article] [PubMed] [Google Scholar]
- 23.Krakowiak P, Walker CK, Bremer AA et al. Maternal metabolic conditions and risk for autism and other neurodevelopmental disorders. Pediatrics 2012;129:e1121–8. 10.1542/peds.2011-2583 [DOI] [PMC free article] [PubMed] [Google Scholar]
- 24.Dupont WD, Plummer WD. Power and sample size calculations: a review and computer program. Control Clin Trials 1990;11:116–28. 10.1016/0197-2456(90)90005-M [DOI] [PubMed] [Google Scholar]