Figure 2.
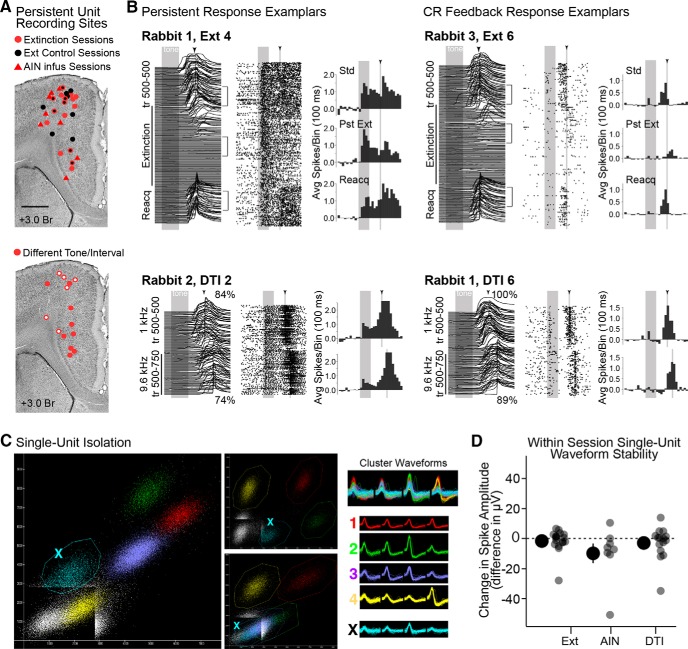
Estimated recording sites of persistent cells, example single-unit responses, single unit cluster isolation and stability measurements for manipulation sessions. A, Top, Estimated recording locations of persistent mPFC neurons recorded during extinction (red circles) and control extinction sessions (black circles; markers outlined in red indicate persistent cells recorded at that location for both control and corresponding extinction sessions). Recordings during cerebellar infusions (AIN) are shown as red triangles. Bottom, Recording sites for DTI sessions. Open markers indicate recordings during sessions with poor performance, closed markers indicate good performance. B, Waterfall plots show eyelid behavior. Raster plots show spike data across trials (each row is a trial; each dot is a spike; gray bars and arrowheads indicate the presentation of tone and US, respectively). Brackets indicate trials used for spike analysis based on behavioral criteria (see Materials and Methods), and histograms (baseline subtracted) show averaged spike data from those epochs (Std; Pst, postextinction; Reacq, reacquisition training). Top examples are from extinction sessions; bottom examples are from different tone/interval sessions. C, Scatterplots showing different peak-to-peak comparisons from two of the four channels of a tetrode. Colors indicate putative isolated single-unit clusters, with corresponding waveforms given to the right. Note that the teal cluster never completely surpasses the trigger threshold, while other clusters do and show clean separation from each other on at least one projection. The teal cluster would be eliminated from analyses due to poor isolation. D, Isolated clusters showing persistent responses during Ext, cerebellar infusion (AIN), and DTI training were evaluated for stability within recording sessions. Large markers show the mean and SEM of changes in amplitude between standard and experimental trials (individual data points are also shown). The peak spike amplitudes of some persistent cells shifted during recording sessions, but no systematic changes were observed for any group (t = 0.79–1.5, p > 0.05, n.s.).

