Abstract
Encephalization is a core concept in comparative neurobiology, aiming to quantify the neurological capacity of organisms. For measuring encephalization, many studies have employed relative brain sizes corrected for expected allometric scaling to body size. Here we highlight the utility of a multivariate geometric morphometric (GM) approach for visualizing and analyzing neuroanatomical shape variation associated with encephalization. GM readily allows the statistical evaluation of covariates, such as size, and many software tools exist for visualizing their effects on shape. Thus far, however, studies using GM have not attempted to translate the meaning of encephalization to shape data. As such, we tested the statistical relationship between size and encephalization quotients (EQs) to brain shape utilizing a broad interspecific sample of avian endocranial data. Although statistically significant, the analyses indicate that allometry accounts for <10% of total neuroanatomical shape variation. Notably, we find that EQs, despite being corrected for allometric scaling based on size, contain size‐related neuroanatomical shape changes. In addition, much of what is traditionally considered encephalization comprises clade‐specific trends in relative forebrain expansion, particularly driven by landbirds. EQs, therefore, fail to capture 90% of the total neuroanatomical variation after correcting for allometry and shared phylogenetic history. Moving forward, GM techniques provide crucial tools for investigating key drivers of this vast, largely unexplored aspect of avian brain morphology.
Keywords: allometry, Aves, brain, encephalization, geometric morphometrics
Introduction
An appropriate characterization of brain morphology is critical for assessing neuroanatomical differences among taxa and generating accurate conclusions on how and why these differences have evolved (Striedter, 2005, 2009). In comparative neurobiology there is a long‐standing tradition of quantifying differences in brain morphology in an attempt to describe the neurological capacity of various taxa (Gould, 1975). Early comparative anatomists, such as von Haller (‘Haller's law’; Lüps, 2010), recognized that absolute brain size is strongly correlated to the size of the animal (Fig. 1) and that, even when corrected for body mass (Snell, 1891; Dubois, 1897), brain size was found to be proportionately larger in smaller animals and smaller in larger animals (Gould, 1971; Jerison, 1973; van Dongen, 1998; Striedter, 2005). Since then, brain evolution has been largely assessed as an allometric phenomenon, namely, as the scaling relationship between brain and body masses.
Figure 1.
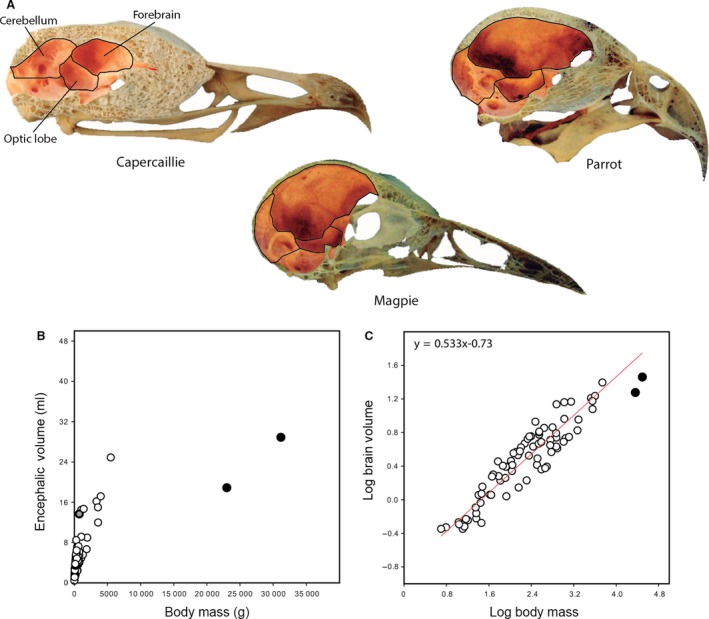
Neuroanatomical size in relation to skull and body size. (A) Skull of adult capercaillie, parrot, and magpie illustrating interspecific differences in absolute and proportional size of the endocranial cavity and its subdivisions. Images scaled to equivalent skull length. (B) Exponential relationship between brain volume and body mass. Data from Dominguez et al. (2002), after Jerison (1973). (C) Bivariate plot of log‐transformed brain volume against body mass showing a tight allometric relationship between these two variables. As examples, crows (gray data point) show positive residual deviation which equates to greater encephalization than expected for its body size; ostriches and emu (black data points) exhibit negative residual deviation, indicating less encephalization for its body size.
In most cases, however, removing the effect of size from these measurements is crucial to study evolutionary changes independent of simple allometric scaling (Gould, 1975; Stevens, 2009). Portmann (1947a,b) was among the first authors to recognize this and proposed to compare brain differences among birds using ratios between the mass of brain components and a baseline, or the mass of the brainstem of a putatively ‘primitive’ organism, which was labeled as the ‘basal cipher’ (in birds, likely the chicken). Later, based on the allometric relationship between brain and body size, Jerison (1955, 1961, 1973) established the concept of encephalization quotient (EQ), where all vertebrate brains are characterized by the observed brain weight divided by expected brain weight for a particular taxon. This involves fitting a least‐squares regression to log‐transformed brain and body mass (Fig. 1C), and the EQ is therefore a measure of the deviations of each taxon from this pooled allometric pattern, essentially equivalent to the residuals derived from the regression line. Consequently, EQs and the residuals are assumed to be statistically independent from the primary correlation of brain size with body size (Gould, 1975) and have remained instrumental variables in the comparative neurobiological literature (e.g. Striedter, 2005, 2009; Stevens, 2009; Smaers et al. 2012).
Despite its wide adoption in neurobiological studies, EQs, and by extension residuals from pooled allometric regressions, are limited with respect to both methodological and biological foundations. As a univariate metric, relative sizes are highly restricted in capturing the overall neuroanatomical differences associated with size differences (Klingenberg, 1996), and groups with similar residual values could exhibit disparate morphologies, confounding actual disparity in neuroanatomy. Secondly, a well‐known limitation is that the use of ratios has analytical shortcomings, including non‐independence of changes in value (Atchley et al. 1976; Jasienski & Bazzaz, 1999). Further, the use of residual size variables, even when analyzing multiple relative size measurements (e.g. forebrain size, cerebellum size), is difficult to translate into real anatomical changes. More importantly, however, the concept of encephalization presupposes that the brain scales as a function of body size, yet numerous studies have shown that body size is not a dominant predictor of brain size (Gould, 1981; Dunbar, 2006; Herculano‐Houzel et al. 2007).
Clearly, the investigation of brain structures demands more robust approaches to characterize the variation in brain morphology. To this end, geometric morphometrics (GM) offers a suite of powerful tools for investigating a wide range of biological questions. Instead of univariate measurements, such as mass, angles, and distances, it involves multidimensional analyses of biological form (Fig. 2; Dryden & Mardia, 1998; Adams et al. 2013) and allows compelling visualizations of morphological differences in brain size and shape (e.g. Gunz, 2014). GM typically involves landmark data comprising 2‐D or 3‐D Cartesian coordinate points on defined anatomical locations (Fig. 3A). These raw coordinate data are then aligned by superimposition, removing the effect of position, orientation and, of great importance to the study of brain evolution, scale (Fig. 3B,D). The distances between corresponding landmarks among specimens, by definition, describe the difference in ‘shape’ based on the landmark configuration (Fig. 3C,D). One of the most important advantages of these shape data is that they can be subjected to standard multivariate statistical methods, including multivariate regressions, commonly used to test for allometry (e.g. Monteiro, 1999; Mitteroecker et al. 2013; Marugán‐Lobón et al. 2014). With GM techniques, shape information is maintained throughout the course of these analyses, allowing virtual depictions of how specific factors affect actual morphological differences (Slice, 2005).
Figure 2.
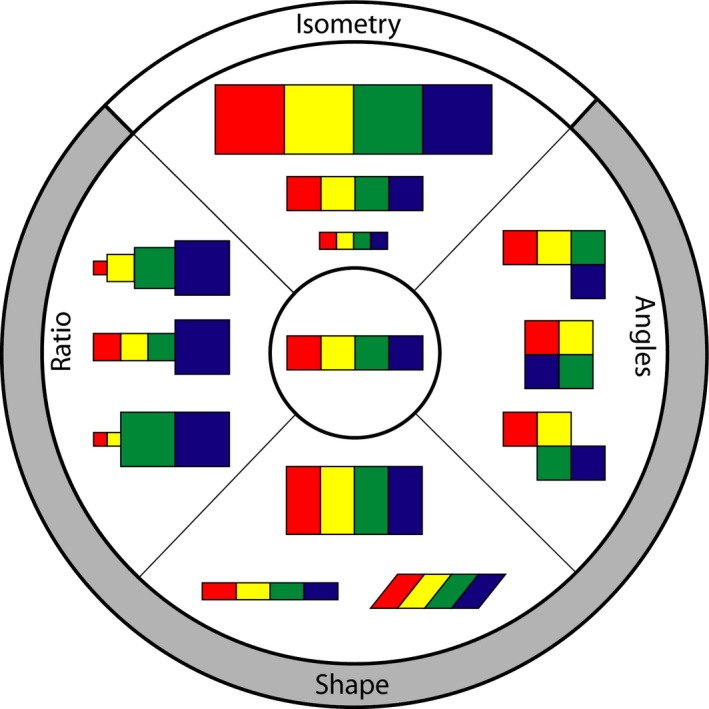
Schematic diagram of types of morphological changes (periphery) from reference structure (center). Use of shape data encompasses morphological changes beyond the capabilities of angles and ratios between different regions of a structure. Generalized Procrustes alignment, a standard procedure in GM, removes the effect of isometric change from the coordinate data. Colors indicate homologous regions within a structure.
Figure 3.
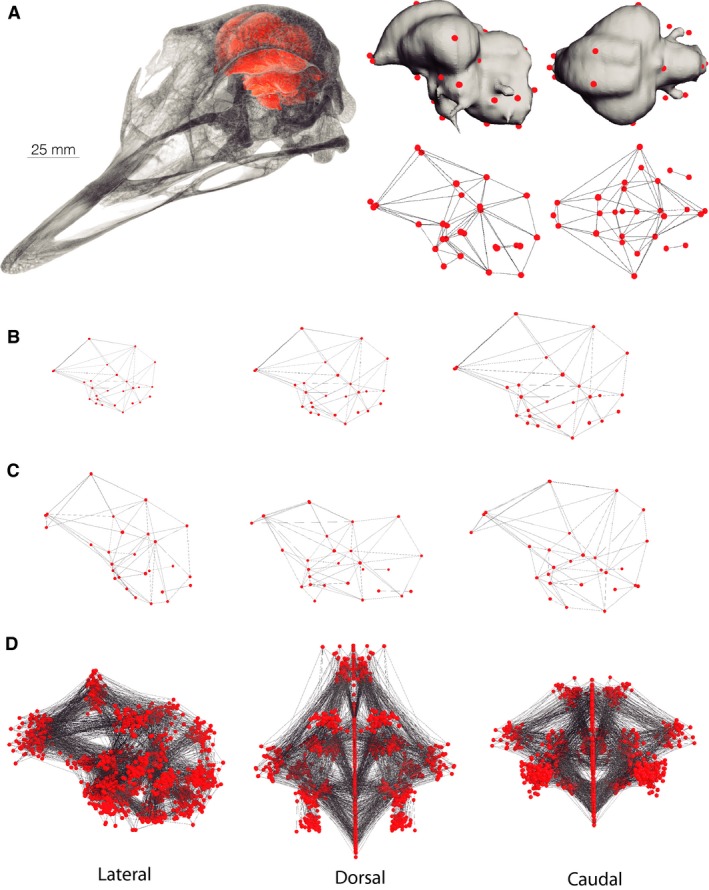
Geometric morphometric data used in this study. (A) Skull and endocast (orange) of an ostrich reconstructed from CT data. Landmarks on the ostrich endocast in lateral (left) and dorsal (right) views. (B) Example landmark configurations depicting isometric changes in endocranial morphology in lateral view. Performing a generalized Procrustes superimposition on coordinate data of multiple specimens removes the effect on isometry on coordinate values. Thus, shape mathematically excludes isometric changes. (C) Landmark data depicting shape differences including differences in topology and relative sizes of neuroanatomical structures. (D) Shape data of all 61 endocasts sampled in this study in lateral, dorsal, and caudal views. The landmark data are from Kawabe et al. (2013).
Here, we assess the implementation of GM techniques for studying encephalization using the neuroanatomical diversity of modern birds as a case study. Previous studies have characterized brain morphology with GM techniques in primates (Bruner et al. 2003; Bruner, 2004, Bruner & Jeffery, 2007; Bastir et al. 2010; Gómez‐Robles et al. 2014) and in birds (Kawabe et al. 2013, 2015), but to our knowledge these studies have never directly and mathematically linked shape changes to the traditional concept of encephalization. Thus, to help visualize and define encephalization in the context of GM, we examine the correspondence between shape and EQ using the endocranial shape data of extant birds.
Material and methods
Data
The endocranial coordinate data from a published study (Kawabe et al. 2013) include 61 extant bird species encompassing 22 of 23 orders. As in mammals, the brain of modern birds fills nearly the entire endocranial cavity, allowing the digital cast of this space to be used as an accurate proxy of brain size and shape (Hopson, 1979; Iwaniuk & Nelson, 2002; Striedter, 2005; Witmer et al. 2008). In this article, we refer to anatomical features of the endocast with corresponding structures on the brain (e.g. ‘forebrain’ instead of ‘cast of forebrain’). The coordinate data were obtained by digitally placing landmark points on endocasts reconstructed from 3‐D micro‐computed tomography data of skulls in amira v. 5.3.2 (Kawabe et al. 2013). The shape data consist of 28 landmarks including both the left and right sides of the endocast (Fig. 3A; list of landmarks in Kawabe et al. 2013).
We subjected the raw landmark data to a standard alignment protocol in GM called generalized Procrustes superimposition (Gower, 1975; Rohlf & Slice, 1990; Bookstein, 1991; Dryden & Mardia, 1998). This procedure extracts shape information from the raw coordinates by aligning the position and orientation of each specimen, in addition to standardizing their scale to a single centroid size (CS). CS is computed as the square root of the sum of squared distances between the landmarks and the centroid of the landmark configuration (Dryden & Mardia, 1998). In this study, and in most programs, the CS of specimens is scaled to unit size. The standardization of size of coordinate data is particularly relevant in this study because it guarantees that the effect of isometry on coordinate values is removed from the data (Gower, 1975). In addition, we applied a symmetrization procedure on the latter shape data, which isolates a component of bilateral symmetric shape variation (Mardia et al. 2000). This correction ignores any source of variation within the sample due to asymmetry and reduces the small yet potentially present error introduced by the separate digitizing of two nearly identical sides of a bilaterally symmetric structure such as the endocast.
In principle, CS of each specimen in the original, unaligned landmark configurations should serve as an equivalent proxy to brain size, yet to our knowledge the comparison between these two scalars has never been performed. To examine the level of correspondence between endocranial CS and other size metrics for brain size, we obtained the brain and body masses corresponding to each of our sampled species from the literature (Mlikovsky, 1989a,b,c, 1990; Dunning, 2007) (Appendix S1). We also used multivariate regressions to compare the statistical relationship between brain shape and EQ (sensu Jerison, 1973) calculated using past v. 2.17b (Hammer et al. 2001). This EQ was calculated for each specimen using the allometric equation derived from the dataset devised by Iwaniuk & Nelson (2003), as EQ = (Brain volume/Body mass)0.568 (Ashwell & Scofield, 2007), rescaling brain mass to volume (Appendix S1).
Analyses
Reduced major axis (RMA) regression was conducted in past v. 2.17b (Hammer et al. 2001) to test the correspondence between brain and body masses and centroid size. All GM analyses were performed using morphoj v. 1.06d (Klingenberg, 2011). To examine the distribution of endocranial shape in modern birds, the shape data were subjected to principal components analysis (PCA; Jolicoeur & Mosimann, 1960) to construct phylomorphospaces (Sidlauskas, 2008) based on axes that capture much of the total shape variation. Using the shape data and different size metrics, we performed multivariate regressions to characterize and compare the predicted endocranial shape from size, i.e. allometry (Monteiro, 1999; Mitteroecker et al. 2013), as well as EQ. We also evaluated whether the endocranial shape data contain a phylogenetic signal where closely related taxa tend to exhibit similar endocranial shape (Klingenberg & Gidaszewski, 2010). This requires adopting a comparative approach that takes into account the phylogenetic structure of the data (Felsenstein, 1985; Klingenberg & Gidaszewski, 2010; Klingenberg & Marugán‐Lobón, 2013). We followed previous studies on avian brain shape (e.g. Kawabe et al. 2013) and corrected for phylogeny based on the phylogenetic tree of Hackett et al. (2008), with all branch lengths set to the same length (Fig. 4A). Although not discussed explicitly in this article, we reconstructed the ancestral shapes using the squared‐change parsimony method (Maddison, 1991).
Figure 4.
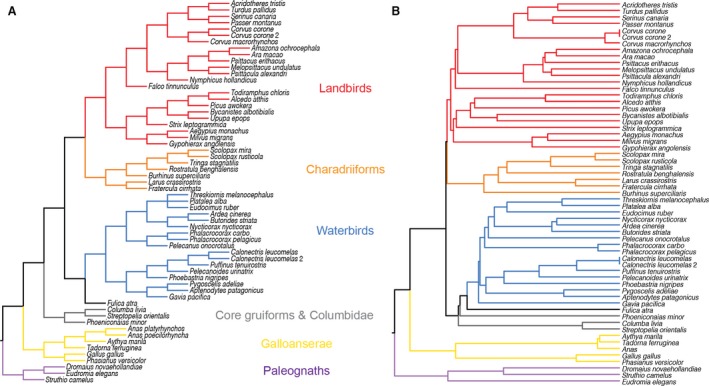
Phylogenetic trees of species sampled in this study. (A) Equal branch tree based on Hackett et al. (2008) where all branch lengths are 1. (B) Time‐calibrated tree based on Jetz et al. (2012) and Jarvis et al. (2014).
However, due to rapid radiation of crown group bird orders early in their evolutionary history, the assumption of equal branch lengths may lead to spurious results. Therefore, we also used a time‐calibrated phylogeny based on a distribution of 10 000 sequence‐based trees with Hackett tree as backbone topology from Jetz et al. (2012) pruned to include only the taxa sampled in this study (obtained at birdtree.org). Then, the median estimated time divergences were modified based on primarily order‐level relationships and divergence times put forth more recently by Jarvis et al. (2014) based on genomic data. When the median divergence times estimated by Jetz et al. (2012) and Jarvis et al. (2014) were incompatible, then the branch leading to the node was arbitrarily set to length 0.1 Ma. For example, the estimated divergence time of Bycanistes albotibialis and Upupa epops is 58.2601 Ma in Jarvis et al. (2014), but the preceding node is aged 51.985 Ma by Jetz et al. (2012). Because a higher‐level internal node cannot precede a lower‐level node, the branch between the two nodes was changed to 0.1, and the terminal branches leading to B. albotibialis and U. epops were modified accordingly to construct an ultrametric tree (Fig. 4B).
In addition, two species of Anas, Anas platyrhynchos and Anas poecilorhyncha, were collapsed to form a single Anas terminal in the time‐calibrated phylogeny because the very short phylogenetic distance between these congeneric taxa considerably inflated their phylogenetic independent contrast. Furthermore, several taxonomic nomenclatures in the previous study (Kawabe et al. 2013) were modified to reflect the current taxonomic classification (i.e. Ceratogymna to Bycanistes, Halcyon chloris to Todiramphus chloris). Phalacrocorax filamentosus (capillatus) was removed from the datasets when analyzing with a time‐calibrated phylogeny because it was not sampled. Although some of the lower‐level phylogeny of crown group birds is yet to be determined conclusively, using both phylogenetic trees allowed us to evaluate the potential artifact caused by assuming equal branch lengths in Aves.
To assess the correlation between non‐allometric component of neuroanatomy to EQ, residual shape data from multivariate regression analyses on the original endocranial shape data and size were subjected to an additional round of PCA and multivariate regression analysis onto EQ. Likewise, multivariate regression was also performed on phylogenetic independent contrasts (PICs) of shape and size to determine whether allometric signal still exists in phylogenetically corrected data. Finally, these residual and PIC shape datasets were regressed onto EQ to test whether EQs significantly correlate with PIC shape, as well as shape data corrected for overall allometric and phylogenetic signal.
Results
Bivariate regression analyses demonstrate significant correlations between different size metrics (Fig. 5; Supporting Information Table 1). As expected, log‐transformed brain and body mass data collected from literature scale with a slope of 0.55 (Fig. 5A). In addition, the linear models show a strong correspondence between endocranial CS and brain mass (Fig. 5B), and thus between CS and body mass with a slope of 0.60 (Fig. 5C). Notably, the EQ remains significantly correlated with body size (Fig. 5D).
Figure 5.
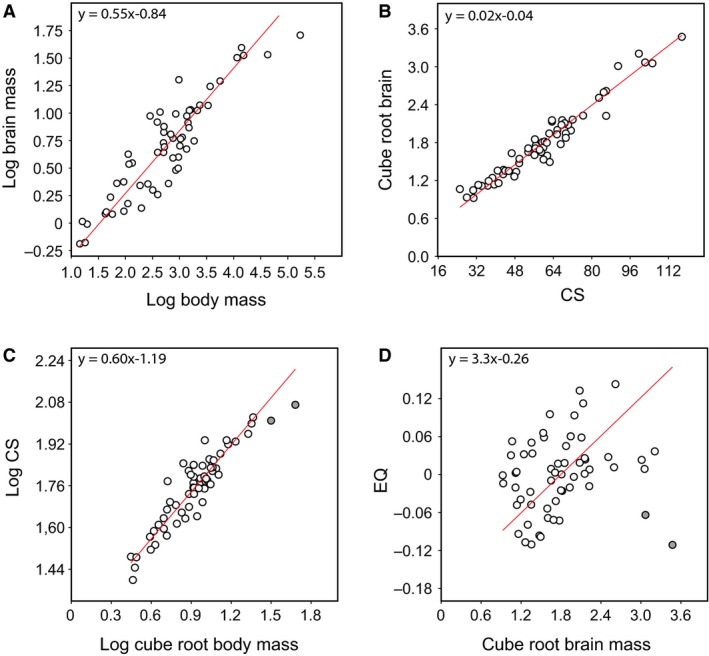
Bivariate plots showing the scaling relationships between (A) log brain mass and body mass; (B) cube root of brain mass and centroid size; (C) log CS and log cube root of body mass; (D) EQ and cube root of brain mass. Grey dots are examples of large avians (Ratites)
Table 1.
Summary of multivariate regressions
| Shape on: | % Explained variance | P |
|---|---|---|
| Log CS | 8.12 | <0.0001 |
| Log Body mass (g) | 8.73 | <0.0001 |
| Log Brain mass (g) | 8.63 | <0.0001 |
| Jerison's EQ | 13.37 | <0.0001 |
| Non‐allometric shape residuals on | ||
| Jerison's EQ | 13.57 | <0.0001 |
| Regression of PIC shape onto | ||
| PIC Log CS | 8.49 | <0.0001 |
| PIC Log Body mass | 7.86 | <0.0001 |
| PIC Log Brain mass | 8.64 | <0.0001 |
| PIC Jerison's EQ | 5.06 | <0.0006 |
| Non‐allometric shape PIC on | ||
| PIC Jerison's EQ | 2.73 | 0.08 |
CS, Centroid size; PIC, Phylogenetic independent contrasts data.
Phylomorphospaces constructed from the first two PCs of endocranial shape (Fig. 6) and bivariate plots illustrating the results of multivariate regression analyses (Fig. 7) provide complementary views on the link between shape, size, and encephalization. PC1 and PC2 of the original endocranial shape data (Fig. 6A) account for similar percentages of the variance (23 and 21%, respectively). This equivalency between the amount of shape variance, as well as nearly identical shape changes associated with these axes, signifies that both PC1 and PC2 should be interpreted collectively as a single descriptor of overall variation. We find that the neuroanatomy of birds largely differ in the relative size of the forebrain and degree of flexion and extension of the endocranial cavity (Fig. 6A). With relatively expanded forebrains, the landbirds, particularly psittaciformes (parrots) and passerines (songbirds), occupy the same region in morphospace separate from the rest of birds. This distribution strongly suggests that the endocranial data, and thereby brain morphology, contain a broad phylogenetic structure.
Figure 6.
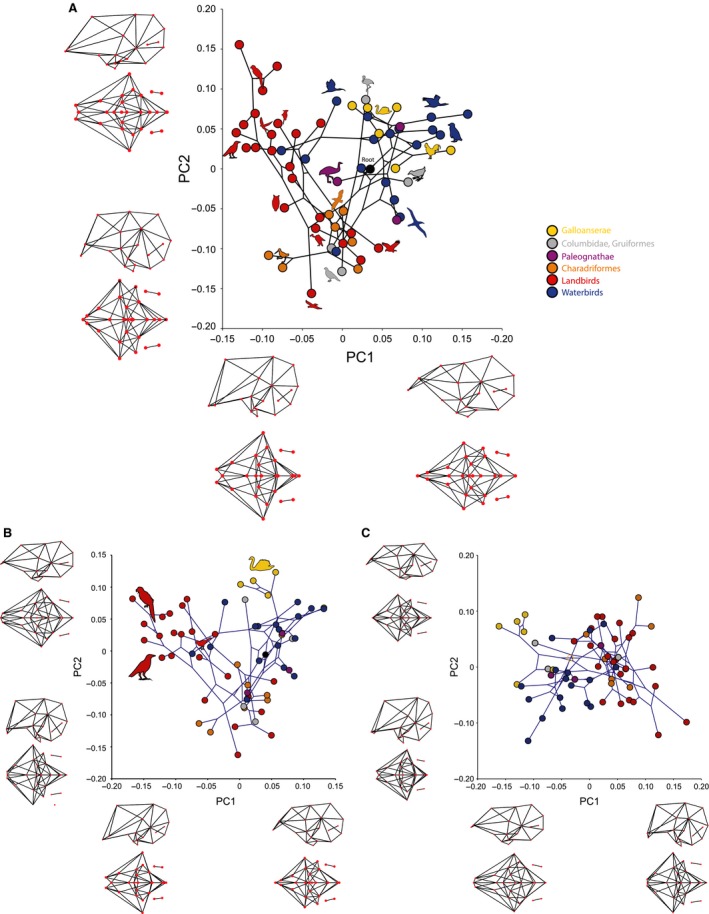
Phylomorphospaces of endocranial shape constructed from first two principal components (PCs) and associated shape changes. (A) Phylomorphospace of original endocranial shape. Note that PC1 and PC2 account for similar shape changes (i.e. relative size of the forebrain and dorsoventral flexion of the brain. Note relatively larger forebrain size in landbirds, particularly the crow and parrots. (B) PC phylomorphospace of residual shape data from multivariate regression of original shape data onto log CS. Note that Galloanserae occupy a distinct area when common allometric signal is mathematically removed. (C) PC phylomorphospace of residual shape data from multivariate regression of original shape data onto log CS and EQ. Note that only brain flexure largely drives endocranial shape variation after correcting for encephalization.
Figure 7.
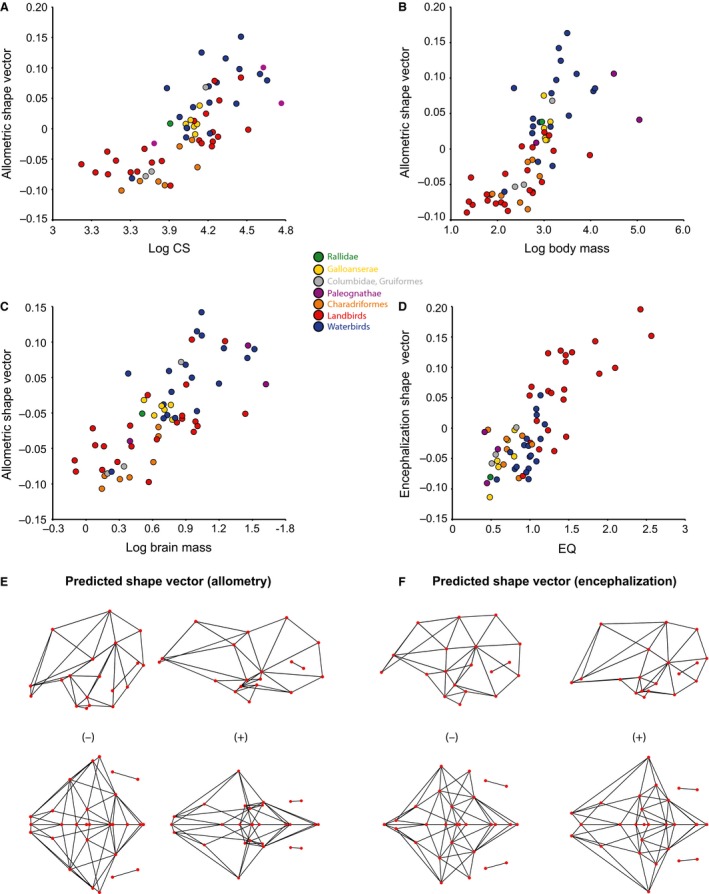
Multivariate regression of endocranial shape onto (A) log CS; (B) log body mass; (C) log brain mass; (D) EQs. The shape vectors represent an axis that maximizes the correlation between the multivariate shape data and respective size variable. All size variables (A–C) predict equivalent allometric shape changes as exemplified by relationship with log CS (E), and EQ (F) also predicts similar changes.
We performed three separate multivariate regression analyses on the endocranial shape data, using the three size variables: log CS (Fig. 7A), log body mass (Fig. 7B), and log brain mass (Fig. 7C). All three regressions recover equivalent and statistically significant results (Table 1). Size variables account for nearly 10% or less of the total variance of endocranial shape (Table 1), yielding an allometric trend in which birds with smaller bodies and brains generally exhibit a slightly more expanded forebrain than the cerebellum, with a greater flexion in the brain (Fig. 7E). Conversely, birds with larger brains and bodies bear relatively larger cerebellum and a more elongated profile than smaller taxa (Fig. 7E). Interestingly, the bivariate plot of shape vector, representing the axis of maximum correlation with the independent variable, against log body mass (Fig. 7B) shows that relative body size is phylogenetically biased, with the clade of waterbirds encompassing larger birds on average than those of the rest in the sample.
The residual shape variation that remains unaccounted by size is substantial (~90% of the total variation) and a PCA on these residual data (Fig. 6B) results again in PC1 and PC2 capturing similar amount of variation (25 and 20%, respectively). With the removal of overall allometric signal, the primary axes of shape variation account for more distinct morphological changes. Whereas PC1 primarily accounts for relative forebrain expansion, PC2 is associated with changes in the degree of overall brain flexion (Fig. 6B). The resulting morphospace closely resembles that of the original endocranial shape data, with the exception of Galloanserae (ducks and chickens) that possesses a unique neuroanatomy for their size.
Linking endocranial shape with encephalization, we find that EQ correlates significantly with endocranial shape (Table 1; Fig. 7D), corresponding to changes in the relative size of the forebrain and less substantial changes in brain flexion (Fig. 7F). A multivariate regression on the non‐allometric shape component (i.e. approximately 90% of total shape variance) onto EQs shows significant correlation that accounts for 7.78% of the total shape variance (P < 0.0001). This predicted variance is still primarily associated with the degree of relative forebrain expansion, where greater EQ values predict proportionally larger forebrain (not figured). Interestingly, the bivariate plot of this analysis also unambiguously shows that there is phylogenetic structure in the data, with the landbirds generally having much larger EQs than those of the rest of birds in the sample, in close correspondence to their characteristic endocranial shape (Fig. 7D). In other words, clade‐specific shape and EQs drive this overall trend, and need to be corrected with PIC. The residual shape variation from this regression remains large (~85% of the total shape variation) and PC phylomorphospace based on this dataset indicates that the largest source of shape variance encompasses differences in the degree of flexion, not by differences in forebrain expansion (Fig. 6C). Comparison of the phylomorphospace of data corrected for both allometry and EQ (Fig. 6C) to that of data corrected only for allometric signal (Fig. 6B) implies that EQs predominantly account for relative forebrain size.
To our surprise, we found a marginal difference in PIC shape distribution using equal‐branch and time‐calibrated trees (Supporting Information Fig. S1). Here, we present only the results from PIC generated with the non‐calibrated phylogeny. Regressions on PIC data of shape onto size corroborate the fact that allometric signal after correcting for phylogenetic structure, or evolutionary allometry, significantly underlies endocranial shape differences in birds (Table 1, Fig. 7A). Although statistically significant, this signal merely accounts for 8% of total shape variation and predicts slight changes in forebrain size relative to other brain regions, but not the degree of brain flexion (Fig. 8C). Similarly, the PIC EQs only predict 5% of PIC brain shape changes (P < 0.0006; Fig. 8D). This correlation, however, is significant only if the PIC shape data have not been corrected for allometry (Table 1). The PICs of EQs, therefore, are only very slightly correlated with PIC brain shape (Table 1; Fig. 8B), and not with the residuals from allometry based on the regression of PIC shape onto size (Table 1).
Figure 8.
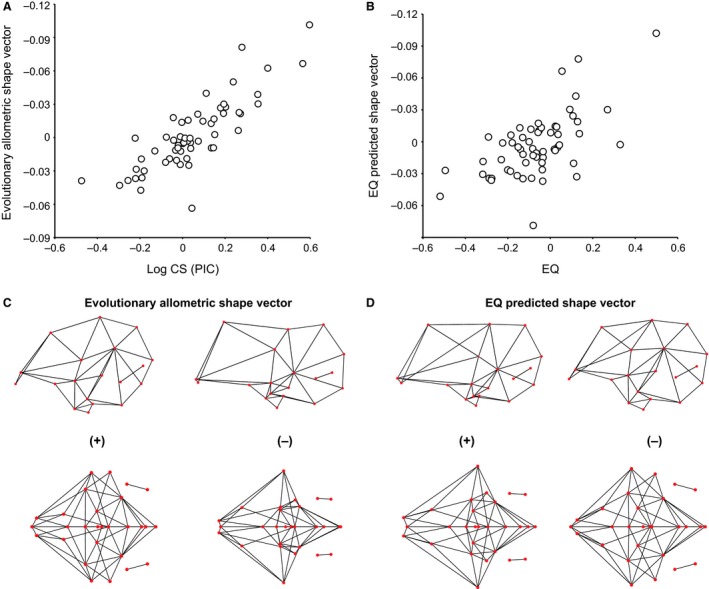
Bivariate plots of PIC endocranial shape against (A) PIC log CS and (B) PIC EQ. Brain morphs show predicted shape changes associated with (C) PIC log CS and (D) PIC EQ.
Discussion
Accurate and robust characterization and analyses of neuroanatomical variation are important facets of comparative neurobiology. By integrating shape data with traditional metrics of encephalization, our results illustrate several key aspects of using GM in this field. First, CS, the univariate metric used in GM to remove the effect of isometric scaling, is a reliable proxy for brain size, brain mass, and body mass (Fig. 5). Although these results are not surprising given that size measurements are often highly correlated among one another (Klingenberg, 1996), log CS, brain and body masses produce only slightly different scaling factors. Thus, use of CS of endocasts is justified for investigating the effect of size on brain morphology and other neurological variables (Striedter, 2005).
In addition, our study corroborates previous observations that avian brains mostly differ in the proportional size of the forebrain (Portmann, 1947a, Portmann, 1947b; Iwaniuk & Nelson, 2002; Balanoff et al. 2013) and the degree of brain flexion (Marugán‐Lobón & Buscalioni, 2009; Kawabe et al. 2013). The results also indicate that allometry is not a dominant predictor of the morphological disparity in the avian brain, accounting for only ~10% of endocranial shape variance. However, although the contribution of size to brain variation across birds is remarkably low, its impact is not negligible. For instance, allometry can engender homoplasy (Lockwood & Fleagle, 1999) due to greater instances of phenotypic convergence based on size, and this phenomenon is empirically demonstrated here by Galloanserae, which is convergent in endocranial shape to many other birds in our sample (Fig. 6A), but became distinct from the rest when the dataset was corrected for allometric signal (Fig. 6B).
The main source of avian brain disparity is relative forebrain expansion, yet our results clearly indicate that this trend is also influenced by shared phylogenetic history. Although there is considerable overlap in the occupation of morphospace among broad taxonomic groups, the specimens generally cluster within these clades (Fig. 6). The landbirds contribute to the broader phylogenetic structure by polarizing the general trend of forebrain expansion among birds. This clade comprises parrots, crows, and raptors, all of which are birds that have been traditionally perceived as the most encephalized birds (Portmann, 1947a,b; Jerison, 1973; Iwaniuk & Nelson, 2003; Iwaniuk & Hurd, 2004; Jarvis et al. 2005; Jarvis, 2009). When analyzing PICs of endocranial shape, we find that evolutionary allometry (i.e. allometric signal after correcting for phylogenetic signal), albeit significant, only accounts for little more than 10% of the total shape variation. Therefore, nearly 90% of endocranial shape disparity remains unaccounted by allometry and phylogenetic history.
By statistically linking EQ with GM, key properties of univariate measurements of encephalization become apparent. Multivariate regression on endocranial shape onto EQs shows that differences in EQ are, not surprisingly, associated with relative size of the forebrain, but also with minor morphological changes in the overall extent of the optic lobes (Fig. 7F). EQ, however, does not substantially account for brain flexion. Regressions on PIC shape and PIC EQ indicate that PIC EQ correlates significantly with PIC shape, but loses predictive power when the allometric signal is removed from PIC shape (Table 1). Taken together, these results imply that EQ inherently contains size information with respect to overall brain morphology. The reason for the inclusion of allometric shape component in EQ could simply be attributed to the highly multivariate shape data containing additional information that is unaccounted for by univariate measurement. Besides this large gap in the amount of morphological information, however, the bivariate plot based on a regression of endocranial shape onto log body mass (Fig. 7B) shows that waterbirds, which tend to have greater body mass, collectively exhibit positively divergent shape relative to the overall trend of shape against log body mass. Thus, body mass, which is used for calculating EQs, not only contains phylogenetic structure, but also size‐dependent deviations from the predicted endocranial shape driven by the waterbird clade. Most striking finding, however, is that EQ fails to characterize the remaining 90% of the total endocranial shape variation unaccounted for by size and phylogenetic relationships.
Identifying the processes underlying the pattern of size‐independent avian brain evolution is outside the scope of this study, but our results may reveal that changes in structural design could be important features of neuroanatomical evolution. The structural and functional evolution of the vertebrate brain involves a balanced regional allocation of neurons across brain structures (Herculano‐Houzel et al. 2014), and many landbirds have evolved complex cognitive functions which, rather than size, relate to their particular forebrain neuroarchitecture and connectivity (Jarvis, 2009). Accordingly, geometric differences in features of brain organization in these birds, such as more compact and flexed whole brains, could indicate large‐scale changes in the neuronal network of the brain (Lieberman et al. 2000; Bruner et al. 2014). This hypothesis provides important incentive to further investigate avian brain evolution using GM.
Conclusions
The GM paradigm provides important perspectives to comparative neuroanatomy that overcome the limitations of univariate measurements of encephalization. Its key advantages include full characterization and visualization of the variation in brain morphology, and these capabilities allow investigations of localized morphological variation in the brain that is typically obscured or difficult to interpret with univariate metrics. In addition, Procrustes alignment used for extracting shape information mathematically removes the effect of isometry based on the size of the brain itself as defined by the coordinate data. As such, the correction for isometry is accomplished consistently with the same coordinate data, removing the need to collect size data of additional structures or entire bodies. Although size is still a valuable and informative metric, we demonstrate the utility of GM for studying both general and localized variation in brain morphology.
To this end, we find novel insights into the study of comparative neuroanatomy by linking GM with traditional metrics of encephalization. First, log‐transformed centroid size, a size metric typically used in GM studies, is highly correlated with log brain and body mass. The use of CS for removing the effect of isometry and allometry is thus justified at least for avian endocasts. Secondly, traditional encephalization metrics, such as EQ, still contain size‐dependent shape variation. This result implies that EQs and univariate residuals still contain appreciable amount of allometric morphological signal. Thirdly, contrary to expectations, EQ does not predict the vast majority of neuroanatomical shape changes independent of evolutionary allometry, or shape variation due to allometry and shared phylogenetic history. In fact, GM analyses indicate that evolutionary allometry only accounts for ~10% of the total shape variation. The remaining 90%, therefore, contain an incredible source of morphological variation that is yet to be tested against factors that may have driven avian brain evolution – an endeavor suited for geometric morphometrics.
Conflict of interests
The authors declare no conflict of interest.
Supporting information
Fig. S1. PCA and allometric regression using PIC with estimated branch lengths; predictions are nearly identical as utilizing branch length equal to one.
Appendix S1. Endocranial morphometrics (Non‐shape)
Acknowledgements
This paper is a product of a Catalysis meeting funded by the National Evolutionary Synthesis Center (NSF EF‐0905606). We thank Amy Balanoff (Stony Brook), Daniel Ksepka (Bruce Museum), and Adam Smith (Field Museum) for organizing the meeting; Julia Clarke (University of Texas, Austin) for the invitation to contribute to the special issue; and Mark Norell (AMNH) for travel support. This research was funded by project CGL2013‐42643‐P (Ministerio de Ciencia e Innovación, Spain) to J.M.‐L., the NSF Graduate Research Fellowship to A.W., Comparative Biology program at the Richard Gilder Graduate School and Division of Paleontology (American Museum of Natural History) to A.W. We also thank two anonymous reviewers for providing constructive comments that improved the quality of the manuscript.
References
- Adams DC, Rohlf FJ, Slice DE (2013) A field comes of age: geometric morphometrics in the 21st Century. Hystrix 24, 7–14. [Google Scholar]
- Ashwell KW, Scofield RP (2007) Big birds and their brains: paleoneurology of the New Zealand moa. Brain Behav Evol 71, 151–166. [DOI] [PubMed] [Google Scholar]
- Atchley WR, Gaskins CT, Anderson D (1976) Statistical properties of ratios. I. Empirical results. Syst Biol 25, 137–148. [Google Scholar]
- Balanoff AM, Bever GS, Rowe TB et al. (2013) Evolutionary origins of the avian brain. Nature 501, 933–936. [DOI] [PubMed] [Google Scholar]
- Bastir M, Rosas A, Stringer C et al. (2010) Effects of brain and facial size on basicranial form in human and primate evolution. J Hum Evol 58, 424–431. [DOI] [PubMed] [Google Scholar]
- Bookstein FL (1991) Morphometric Tools for Landmark Data: Geometry and Biology. Cambridge: Cambridge University Press. [Google Scholar]
- Bruner E (2004) Geometric morphometrics and paleoneurology: brain shape evolution in the genus Homo . J Hum Evol 47, 279–303. [DOI] [PubMed] [Google Scholar]
- Bruner E (2014) Functional craniology and brain evolution In: Human Paleoneurology (ed. Bruner E.), pp. 57–94, Cham: Spring International Publishing. [Google Scholar]
- Bruner E, Jeffery N (2007) Extracting functional, phylogenetic and structural data from the subcortical brain: an exploratory geometric morphometric survey. J Anthropol Sci 85, 125–138. [Google Scholar]
- Bruner E, Manzi G, Arsuaga JL (2003) Encephalization and allometric trajectories in the genus Homo: evidence from the Neanderthal and modern lineages. Proc Natl Acad Sci U S A 100, 15335–15340. [DOI] [PMC free article] [PubMed] [Google Scholar]
- van Dongen BAM (1998) Brain size in vertebrates In: The Central Nervous System of Vertebrates. (eds Nieuwenhuys R, Donkelaar HJT, Nicholson C.), pp. 2099–2134, Berlin: Springer‐Verlag. [Google Scholar]
- Dominguez Alonso P, Milner AC, Ketchman RA, Cookson MJ, Rowe TB (2004) The avian nature of the brain and inner ear of Archaeopteryx. Nat 430, 666–669. [DOI] [PubMed] [Google Scholar]
- Dryden IL, Mardia KV (1998) Statistical Shape Analysis. Chichester: John Wiley & Sons. [Google Scholar]
- Dubois E (1897) Über die Abhängigkeit des Hirngewichtes von der Körpergrösse bei den Säugetieren. Arch Anthropol 25, 1–28. [Google Scholar]
- Dunbar RIM (2006) Putting humans in their proper place. Behav Brain Sci 29, 15–16. [Google Scholar]
- Dunning JB (2007) CRC Handbook of Avian Body Masses, 2nd edn Boca Raton: CRC Press. [Google Scholar]
- Felsenstein J (1985) Phylogenies and the comparative method. Am Nat 125, 1–15. [Google Scholar]
- Gómez‐Robles A, Hopkins WD, Sherwood CC (2014) Modular structure facilitates mosaic evolution of the brain in chimpanzees and humans. Nat Comm 5, 4469. doi: 10.1038/ncomms5469 [DOI] [PMC free article] [PubMed] [Google Scholar]
- Gould SJ (1971) Geometric similarity in allometric growth: a contribution to the problem of scaling in the evolution of size. Am Nat 105, 113–136. [Google Scholar]
- Gould SJ (1975) Review: evolution of the brain and intelligence. Curr Anthropol 16, 403–426. [Google Scholar]
- Gould SJ (1981) The Mismeasure of Man. New York: W. W. Norton & Co. [Google Scholar]
- Gower JC (1975) Generalized Procrustes analysis. Psychometrika 40, 33–51. [Google Scholar]
- Gunz P (2014) Computed tools for paleoneurology In: Human Paleoneurology (ed. Bruner E.), pp. 39–56, Cham: Spring International Publishing. [Google Scholar]
- Hackett SJ, Kimball RT, Reddy S et al. (2008) A phylogenomic study of birds reveals their evolutionary history. Science 320, 1763–1767. [DOI] [PubMed] [Google Scholar]
- Hammer Ø, Harper DAT, Ryan PD (2001) PAST: paleontological statistics software package for education and data analysis. Palaeontol Electronica 4, 9 pp. http://palaeo-electronica.org/2001_1/past/issue1_01.htm [Google Scholar]
- Herculano‐Houzel S, Collins CE, Wong P et al. (2007) Linear, economical cellular scaling rules apply to primate brains. Proc Natl Acad Sci U S A 104, 3562–3567. [DOI] [PMC free article] [PubMed] [Google Scholar]
- Herculano‐Houzel S, Manger PR, Kaas JH (2014) Brain scaling in mammalian evolution as a consequence of concerted and mosaic changes in numbers of neurons and average neuronal cell size. Front Neuroanat 8, 1–28. [DOI] [PMC free article] [PubMed] [Google Scholar]
- Hopson JA (1979) Paleoneurology In: Biology of Reptilia: Volume 9, Neurology (eds Gans C, Northcutt RG, Ulinski P.), pp. 39–146, London: Academic Press. [Google Scholar]
- Iwaniuk AN, Hurd PL (2004) The evolution of cerebrotypes in birds. Brain Behav Evol 65, 215–230. [DOI] [PubMed] [Google Scholar]
- Iwaniuk AN, Nelson JE (2002) Can endocranial volume be used as an estimate of brain size in birds? Can J Zool 80, 16–23. [Google Scholar]
- Iwaniuk AN, Nelson JE (2003) Developmental differences are correlated with relative brain size in birds: a comparative analysis. Can J Zool 81, 1913–1928. [Google Scholar]
- Jarvis ED (2009) Evolution of the pallium in birds and reptiles In: New Encyclopedia of Neuroscience (eds Binder MD, Hirokawa N, Windhorst U.), pp. 209–215, Berlin: Springer‐Verlag GmbH. [Google Scholar]
- Jarvis ED, Güntürkün O, Bruce L et al. (2005) Avian brains and a new understanding of vertebrate evolution. The Avian Brain Nomenclature Consortium. Nat Rev Neurosci 6, 151–159. [DOI] [PMC free article] [PubMed] [Google Scholar]
- Jarvis ED, Mirarab S, Aberer AJ et al. (2014) Whole‐genome analyses resolve early branches in the tree of life of modern birds. Science 346, 1320–1331. [DOI] [PMC free article] [PubMed] [Google Scholar]
- Jasienski M, Bazzaz FA (1999) The fallacy of ratios and the testability of models in biology. Oikos 84, 321–326. [Google Scholar]
- Jerison HJ (1955) Brain to body ratios and the evolution of intelligence. Science 121, 447–449. [DOI] [PubMed] [Google Scholar]
- Jerison HJ (1961) Quantitative analysis of evolution of the brain in mammals. Science 33, 1012–1014. [DOI] [PubMed] [Google Scholar]
- Jerison HJ (1973) Evolution of the Brain and Intelligence. New York: Academic Press. [Google Scholar]
- Jetz W, Thomas GH, Joy JB et al. (2012) The global diversity of birds in space and time. Nature 491, 444–448. [DOI] [PubMed] [Google Scholar]
- Jolicoeur P, Mosimann J (1960) Size and shape variation in the painted turtle. A principal component analysis. Growth 24, 339–354. [PubMed] [Google Scholar]
- Kawabe S, Shimokawa T, Miki H et al. (2013) Variation in avian brain shape: relationship with size and orbital shape. J Anat 223, 495–508. [DOI] [PMC free article] [PubMed] [Google Scholar]
- Kawabe S, Matsuda S, Naoki T et al. (2015) Ontogenetic shape change in the chicken brain: implications for paleontology. PLoS ONE 10, e0129939. doi: 10.1371/journal.pone.0129939 [DOI] [PMC free article] [PubMed] [Google Scholar]
- Klingenberg CP (1996) Multivariate allometry In: Advances in Morphometrics (eds Marcus LF, Corti M, Loy A, Naylor GJP, Slice DE.), pp. 23–49, New York: Plenum Press. [Google Scholar]
- Klingenberg CP (2011) MorphoJ: an integrated software package for geometric morphometrics. Mol Ecol Resour 11, 353–357. [DOI] [PubMed] [Google Scholar]
- Klingenberg CP, Gidaszewski NA (2010) Testing and quantifying phylogenetic signals and homoplasy in morphometric data. Syst Biol 59, 245–261. [DOI] [PubMed] [Google Scholar]
- Klingenberg CP, Marugán‐Lobón J (2013) Evolutionary covariation in geometric morphometric data: analyzing integration, modularity and allometry in a phylogenetic context. Syst Biol 62, 591–610. [DOI] [PubMed] [Google Scholar]
- Lieberman DE, Ross CR, Ravosa MJ (2000) The primate cranial base: ontogeny, function and integration. Yearb Phys Anthropol 43, 117–169. [DOI] [PubMed] [Google Scholar]
- Lockwood CA, Fleagle JG (1999) The recognition and evaluation of homoplasy in primate and human evolution. Am J Phys Anthropol 110(Suppl. 29), 182–232. [DOI] [PubMed] [Google Scholar]
- Lüps P (2010) ‘Haller's law’ (1762): the observation of a relation between brain weight and body weight by Albrecht von Haller (1708–1777). Mamm Biol 75, 577–579. [Google Scholar]
- Maddison WP (1991) Squared‐change parsimony reconstructions of ancestral states for continuous‐valued characters on a phylogenetic tree. Syst Zool 40, 304–314. [Google Scholar]
- Mardia KV, Bookstein FL, Moreton IJ (2000) Statistical assessment of bilateral symmetry of shapes. Biometrika 87, 285–300. [Google Scholar]
- Marugán‐Lobón J, Buscalioni AD (2009) New insight on the anatomy and architecture of the avian neuocranium. Anat Rec 292, 364–370. [DOI] [PubMed] [Google Scholar]
- Marugán‐Lobón J, Blanco‐Miranda D, Chamero B et al. (2014) On the importance of examining the relationship between shape data and biologically meaningful variables. An example studying allometry with geometric morphometrics. Span J Paleontol 28, 139–148. [Google Scholar]
- Mitteroecker P, Gunz P, Windhager S et al. (2013) A brief review of shape, form, and allometry in geometric morphometrics, with applications to human facial morphology. Hystrix 24, 59–66. [Google Scholar]
- Mlikovsky J (1989a) Brain size in birds: 1. Tinamiformes through Ciconiiformes. Věst Česk Společ Zool 53, 33–47. [Google Scholar]
- Mlikovsky J (1989b) Brain size in birds: 2. Falconiformes through Gaviiformes. Věst Česk Společ Zool 53, 200–213. [Google Scholar]
- Mlikovsky J (1989c) Brain size in birds: 3. Columbiformes through Piciformes. Věst Česk Společ Zool 53, 252–264. [Google Scholar]
- Mlikovsky J (1990) Brain size in birds: 4. Passeriformes. Acta Soc Zool Bohem 54, 27–37. [Google Scholar]
- Monteiro LR (1999) Multivariate regression models and geometric morphometrics: the search for causal factors in the analysis of shape. Syst Biol 48, 192–199. [DOI] [PubMed] [Google Scholar]
- Portmann A (1947a) Études sur la cérébralisation chez les oiseaux 1. Alauda 14, 2–20. [Google Scholar]
- Portmann A (1947b) Études sur la cérébralisation chez les oiseaux 2. Alauda 15, 1–15. [Google Scholar]
- Rohlf FJ, Slice DE (1990) Extensions of the Procrustes method for the optimal superimposition of landmarks. Syst Biol 39, 40–59. [Google Scholar]
- Sidlauskas B (2008) Continuous and arrested morphological diversification in sister clades of characiform fishes: a phylomorphospace approach. Evolution 62, 3135–3156. [DOI] [PubMed] [Google Scholar]
- Slice DE (2005) Modern morphometrics In: Modern Morphometrics in Physical Anthropology (ed. Slice DE.), pp. 1–45, New York: Kluwer Academic Publishers. [Google Scholar]
- Smaers JB, Dechmann DKN, Goswami A et al. (2012) Comparative analyses of evolutionary rates reveal different pathways to encephalization in bats, carnivorans, and primates. Proc Natl Acad Sci U S A 109, 1806–18011. [DOI] [PMC free article] [PubMed] [Google Scholar]
- Snell O (1891) Das Gewiellt des Gehirnes und des Hirnmantels der Säugetiere in Beziehung zu deren geistigen Fähigkeiten. Sitzungsber Ges Morphol Physiol München 7, 90–94. [Google Scholar]
- Stevens CF (2009) Principles of brain scaling In: Evolutionary Neuroscience (ed. Kaas JH.), pp. 111–122, Oxford: Academic Press. [Google Scholar]
- Striedter GF (2005) Principles of Brain Evolution. Sunderland: Sinauer Associates, 436 pp. [Google Scholar]
- Striedter GF (2009) History of ideas on brain evolution In: Evolutionary Neuroscience (ed. Kaas JH.), pp. 3–18, Oxford: Academic Press. [Google Scholar]
- Witmer LM, Ridgely RC, Dufeau DL et al. (2008) Using CT to peer into the past: 3D visualization of the brain and ear regions of birds, crocodiles, and nonavian dinosaurs In: Anatomical Imaging: Towards a New Morphology (eds Endo H, Frey R.), pp. 67–88, Berlin: Springer‐Verlag. [Google Scholar]
Associated Data
This section collects any data citations, data availability statements, or supplementary materials included in this article.
Supplementary Materials
Fig. S1. PCA and allometric regression using PIC with estimated branch lengths; predictions are nearly identical as utilizing branch length equal to one.
Appendix S1. Endocranial morphometrics (Non‐shape)


