

Abstract
With aging, the skeleton experiences a number of changes, which include reductions in mass and changes in matrix composition, leading to fragility and ultimately an increase of fracture risk. A number of aspects of bone physiology are controlled by genetic factors, including peak bone mass, bone shape, and composition; however, forward genetic studies in humans have largely concentrated on clinically available measures such as bone mineral density (BMD). Forward genetic studies in rodents have also heavily focused on BMD; however, investigations of direct measures of bone strength, size, and shape have also been conducted. Overwhelmingly, these studies of the genetics of bone strength have identified loci that modulate strength via influencing bone size, and may not impact the matrix material properties of bone. Many of the rodent forward genetic studies lacked sufficient mapping resolution for candidate gene identification; however, newer studies using genetic mapping populations such as Advanced Intercrosses and the Collaborative Cross appear to have overcome this issue and show promise for future studies. The majority of the genetic mapping studies conducted to date have focused on younger animals and thus an understanding of the genetic control of age-related bone loss represents a key gap in knowledge.
Introduction
Osteoporosis is defined as “a skeletal disorder characterized by compromised bone strength and predisposing to an increased risk of fracture” (1) and while this disease can technically affect people at any age, prevalence increases with aging (http://www.niams.nih.gov/Health_Info/Bone/Osteoporosis/overview.asp). Current best estimates suggest that each year there are between 1.5 and 2 million osteoporotic fractures that occur in the US alone, and that half of all women and one quarter of all men over the age of 50 are expected to suffer at least one fracture in their remaining lifespan. This results in over $16 billion in total health care costs just in the US (2). Aside from cost, the consequences of fracture are severe. While not the most common osteoporotic fracture, breaking the hip (i.e. femoral neck) is easily the one that is clinically the most concerning. One in 3 men die within 1 year after a hip fracture, and another 1 in 3 will experience a second fracture (3, 4). Similarly, 1 in 5 women who fracture a hip die within 1 year (5). Further, morbidity and mortality increases following all major fractures in patients over 55, and with major and minor fractures in patients over 75 (6).
Bone mineral density (BMD) is inversely correlated with fracture risk, and is used widely to diagnose disease. It is estimated that over 50% of the variation in BMD is attributed to genetic factors (7), and in humans fracture risk is also heritable (8). As a result, BMD is the most studied phenotype in bone from a forward genetics point of view. Indeed, in humans both common and rare genetic variants for this phenotype have been identified by GWAS, yet as is often the case with this type of study, the amount of variance collectively explained remains small (9–11). While these GWAS-identified loci have provided interesting and novel insights into the regulation of bone mass, BMD as a phenotype is an inadequate surrogate for bone strength or resistance to fracture, as we know from clinical studies that BMD is an imperfect predictor of fracture (12). For this reason, there has been much work focused on direct studies of bone strength from a genetics point of view. Herein, we will discuss the genetic mapping studies conducted to establish the etiology of bone mass and strength and the benefits and challenges associated with using rodents to model this human age-related disease.
Bone Composition and Changes in Matrix with Aging
Bone is a mineralized connective tissue able to withstand substantial loading. The majority of the protein in the matrix of bone is Type I Collagen (13). Each collagen fibril is a triple helix spun from two chains of α1 and one chain of α2 Type I Collagen that have been extensively post-translationally modified via hydroxylation, glycosylation, the addition of mannose or galactose residues, and by the formation of intra- and intermolecular crosslinking (14). The collagen fibrils are arranged in an anti-parallel fashion to form fibers, which are in turn arranged in lamellae forming a layered and highly ordered structure (15). In humans, lamellar bone is organized into Haversian systems, or osteons, in which lamellar bone is arranged in concentric rings around a central vascular channel (16). This level of organization within bone matrix contributes to maintaining strength and function. In mice, a Haversian system of organization is not seen (16), but a lamellar organization is still observed (Figure 1).
Figure 1. Organization of long bones.

A. The structure of the mouse femur is shown by longitudinal section of a three-dimensional X-ray microtomography image, showing prominent cortical and trabecular bone regions. B. Cortical morphometry, as measured by microtomography, typically is defined at mid-diaphysis by measurement of total area, marrow area, cortical area and thickness, major and minor dimensions, and geometric indices of flexural and torsional stiffness and strength. Strength of long bones, as measured by flexure testing, usually involves breaking the bone at the mid-shaft. C. Trabecular morphometry, also measured by microtomography, is defined by measurement of trabecular bone volume as a percent of total volume inside the cortical envelope, trabecular thickness and number. Other measures describing geometry typically are collected, as are listed in the image. D. A hematoxylin and eosin stained section from the distal femur (top) shows cortical bone to the left with a trabeculum in the middle. Osteoclasts and osteoblasts are found on bone surfaces whereas osteocytes are embedded in the bone. The lamellar structure of bone can be seen as bands of darker versus weaker staining.
With aging, non-enzymatic glycosylation of collagen results in the accumulation of advanced glycation end products (AGEs). These modifications inhibit bone resorption and as such the accumulation of AGEs in the bone becomes self-perpetuating as the presence of AGEs prevent or impair resorption, leading to more accumulation (17). The degree of this accumulation is inversely associated with mechanical strength of cortical bone and it has been speculated that AGEs impact bone fragility by changing the stiffness and brittleness of the bone matrix (18–20). A variety of non-collagen proteins are also found in the matrix, and can constitute up to 15% of the total protein found in bone. These are categorized into three main classes: serum derived proteins, proteoglycans and glycosylated proteins. Extensive work using transgenic mice carrying mutations in various non-collagen, extra-cellular matrix proteins has been done. The reader is directed to an excellent review by Boskey (14) for a complete discussion of this topic. It should be noted that many of these proteins are known to play critical roles in establishing bone mechanical integrity during bone formation and may play a role in resistance to fracture (21–23). Osteonectin (Sparc) is the most abundant of the non-collagen proteins in bone and mice lacking this gene have severe osteopenia due to suppression of both bone formation and resorption. As these mice age, mineral content of the bone increases, but the bones also become increasingly brittle (24).
Mineral is associated with each collagen fibril in the form of imperfect crystals of hydroxyapatite. Studies in rats and cows have shown that, with age, the size of the mineral crystals (referred to as crystallinity) associated with the collagen fibrils increases as a function of the length of time that the crystal has been in the bone (25, 26). Bone that is turned over quickly and therefore made mostly of “new” material has smaller crystal size compared to bone that is remodeled slowly (14). Over time, cyclic loading (i.e., fatigue) from everyday activities results in slow accumulation of damage within the bone matrix. If this damaged material is not remodeled, the cumulative damage will weaken the bone matrix. In a very small study of human cadaver bones, an association between aging and increases in crystallinity was observed (27). Fatigue loading can be simulated in the laboratory setting, and was applied to these same cadaver samples. With increasing matrix crystallinity, stiffness increased and ductility decreased, and this accounted for up to 63% of the variation in cyclic fatigue properties. Further, samples with low crystallinity broke sooner under fatigue loading (27). In a separate study, however, no differences in crystallinity were observed in patients who suffered a fracture versus patients who did not (28). It is unclear how to interpret this second study, given the influence of age on crystallinity and the fact that not everyone who has poor bone quality actually fractures. Very large numbers of test subjects are likely needed to clarify the effect of crystallinity on fracture risk. In mice that have low turnover, such as the Osteonectin null mice, crystallinity increases with age, which presumably contributes to the brittle bone phenotype observed in these animals (24). These data provide an example whereby material composition is related to strength and that there are aging-associated changes in composition.
While much of what we know about the genetic regulation of bone matrix integrity has been learned from targeted knockouts (14) or from severe mutations leading to Mendelian diseases such as Osteogenesis Imperfecta (29), natural allelic variation in bone also impacts composition and thereby strength. Courtland and colleagues showed that there are significant differences in composition of cortical bone in young (8 wks of age) female mice (30) from three classical inbred strains: C3H/HeJ (C3H); A/J; and C57BL/6J (B6). Fourier Transform Infrared spectroscopy Imaging (FTIRI) was used to measure bone composition and these data were compared to mechanical integrity of the bones. The greatest differences were found between the A/J and the B6 mice in mineral to matrix ratio, which is largely analogous to the percent mineral content, and this corresponded to differences in elastic modulus. The C3H animals had a higher degree of crosslinking of the collagen, which as measured by FTIRI largely reflects the maturity of the collagen matrix. There was a trend for higher tissue strength in the C3H femurs as well. No differences among the strains were observed in crystallinity, but the animals were very young and differences in crystallinity may not yet have manifested.
While selected transgenic mice have been studied to examine the genetic regulation of compositional changes in bone as a function of aging, there have been no forward genetic studies of bone composition in aging. The evidence for allelic differences (i.e. not necessarily disease causing mutations) controlling bone composition, has come from the study of a small number of mouse strains or in small studies of human cadaver samples which were not designed to test for interactions between aging processes and genetics. More work is needed in this field.
Impact of Aging on Bone Mass
Bone is constantly subjected to the opposing actions of two different cell types. The osteoblast, which is mesenchymal in origin, forms matrix of bone and mineralizes it. The osteoclast, which is myeloid in origin, is the cell responsible for resorption. The efforts of these two cell types are closely coordinated and there is cross talk such that osteoblasts influence resorption and vice versa. The coordinated activities of the osteoblast and osteoclast result in what is referred to as bone remodeling or turnover. When remodeling is in balance, the net amount of bone remains unchanged, but when out of balance results in gains or loss of bone mass.
The osteocyte, the third major cell type of bone, is a former osteoblast that is much reduced in volume and is embedded inside the bone matrix (Figure 1). Only a fraction of the osteoblasts (<40%) become osteocytes, but these cells are the most abundant cells in bone due to their long lifespan and retention. In humans, the osteocyte is thought to have a lifespan of up to 50 years for cells entombed deep in the cortical bone. This is in contrast to osteoclasts which live up to 25 days and osteoblasts which live up to 200 days (31). The osteocytes are connected to one another and to the bone surface cells via processes residing in cannaliculi. These cells are largely thought to serve as networked load sensors in the bone and are a significant source of factors that regulate formation and resorption activities on bone surfaces. Loss of osteocytes with aging in humans and transgenic mice is coincident with decreased bone strength. This is thought to be due to a combination factors including alterations in remodeling signals from the osteocytes that accompanies osteocyte loss, the observation that bone lacking osteocytes has impaired micro-damage repair and the decreases in bone hydration and vascularity that are coincident with loss of osteocytes (review in detail in (31)).
With aging there are alterations in the maturation and function of the osteoblast as well as the osteoclast (which is reviewed in greater detail elsewhere in this issue). In postmenopausal osteoporosis, there is a shortening in the period of bone formation by the osteoblast and an increase in the resorptive period, coincident with the withdrawal of estrogen (32), and this results in a net loss of bone mass. Men also lose bone with aging, and as in women the age-related loss appears to be primarily be a function of estrogen, and not the dominant male sex steroid testosterone (32).
Aging Changes in Cortical Bone
Cortical bone, also known as compact bone, provides structural support to the skeleton and comprises the largest amount of bone by weight and volume (Figure 1). During growth in both boys and girls, there is apposition of bone on the periosteal surface and removal of bone on the endosteaI surface, resulting in a bone that is remodeled to increase in size as the child grows. These actions are coordinated with the activities of the growth plates to increase bone length. At puberty, there is a divergence in cortical bone modeling and remodeling, such that girls increase cortical bone thickness via endosteal formation while largely halting periosteal formation, whereas in boys periosteal expansion continues, resulting in a larger, thicker bone at adulthood (33). Cortical bone gain essentially peaks in early adulthood in both men and women, and a steep loss in cortical bone mass begins at menopause in women and after the age of 75 years old in men (34). The reason for this is that periosteal expansion, while still occurring, is outpaced by endosteal resorption, resulting in a net loss of bone mass in both genders. However, loss of bone in men and women is not equal, with men generally maintaining greater periosteal apposition, thereby losing less total bone mass with age than women (33). This change in distribution of cortical matrix impacts the strength of the bone. First principles of mechanics show that the overall strength and stiffness of a long bone is dictated by the size and shape of its tubular cross section as well as the constitutive matrix mechanical properties (Figure 2). Appositional bone formation at the periosteal surface increases strength and stiffness to the 4th power of bone diameter (i.e. αD4). Thus, periosteal expansion is thought to be a critical compensatory mechanism of aging necessary to maintain mechanical strength in the face of age-related decreases in actual bone mass and tissue material quality (35–37). This putative mechanical compensation eventually slows, as in advancing aging there is a reduction in periosteal bone apposition and ultimately bone mass. This, coupled with reduced matrix quality, results in bone that may succumb to moderate forces such as those associated with falls, resulting in fracture (37, 38). The most detrimental fragility fractures occur when this structural compensation for reduced material quality and quantity is no longer adequate to withstand even “normal” skeletal loading associated with routine activities.
Figure 2. The influence of bone size and composition on density and strength.
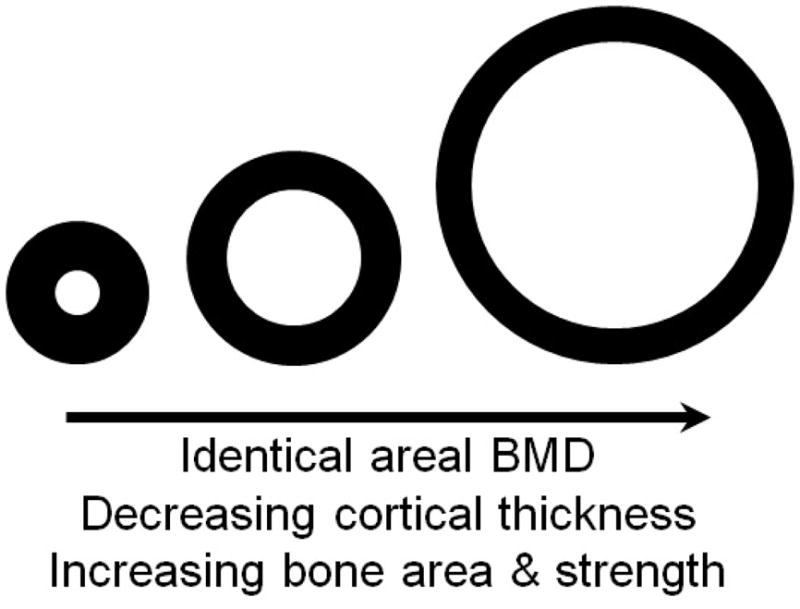
Idealized diaphyseal cross-sections of equivalent area-projected bone mineral density. Although BMD is numerically identical, the amount of cortical bone, thickness of cortex, and geometrical strength in bending or twisting are not equivalent. Further BMD is not the same as Tissue Density (see Figure 5). Note the resemblance to actual mouse femur mid-diaphysis cross-sections shown in Figure 4.
A similar age-related cortical expansion occurs in mice and is coupled with deterioration in bone matrix quality. This makes mice ideal for modeling this phenomenon and for demonstrating how the strength of bone is ultimately impacted. In male C57BL/6J mice, it has been shown that with aging, cortical bone cross-sectional area of the femur at midshaft plateaus at about 20 weeks of age, but both periosteal circumference and endosteal circumference increase though 104 weeks (39). As a result, geometrical parameters dictating resistance to bending and twisting (2nd moments of area) increase with age. Thus, from a structural perspective, the bone should maintain mechanical integrity. However, in this same study, it was shown that mineral content of the bone matrix (% mineral of total bone weight) plateaus at about 28 weeks for the femur diaphysis, suggesting age-related changes in bone material quality. As expected, the stiffness and strength plateaued in these mice despite the continuing changes in shape and size (39). The sum of all of this is that at some point bone mass accrual ceases, and at approximately the same age bone matrix quality begins to deteriorate. The changes in cross-sectional size and shape maintain the strength of the bone for a while, but eventually this is no longer sufficient and bones become weaker with age. It should be noted that male C57BL/6J mice have a median lifespan of approximately 128 weeks (40) so many of these changes in bone are happening well before the onset of “old age.”
Aging Changes in Trabecular Bone
Residing within the internal marrow space and enclosed by the cortical bone is the trabecular, or cancellous bone (Figure 1) and it serves a dual role as both a key structural element of the skeleton as well as a critical metabolic tissue. Trabecular bone provides vital added strength to the ends of weight bearing bones and generally corresponds in orientation to the primary direction of loading (41–47). In contrast to cortical bone, trabecular bone loss begins in early adulthood in humans, irrespective of gender (34). As occurs for cortical bone, alterations in trabecular bone mass and architecture are associated with fracture (48). Trabecular bone architecture is a critical dictator of its mechanical integrity; however, changes in architecture are more difficult to monitor in a patient setting as these changes can occur independent of the information captured by the typical areal-projected BMD measurements that are made clinically to diagnose and monitor osteoporosis (48).
The Collaborative Cross (CC) is a genetic reference population of recombinant inbred strains of mice wherein each line is descended from eight inbred strains (C57BL/6J (B6), A/J, 129S1/SvImJ (129), NZO/H1LtJ (NZO), NOD/LtJ (NOD), WSB/EiJ (WSB), PWK/PhJ (PWK) and CAST/EiJ (CAST)). Preliminary studies of this population have shown that trabecular bone volume fraction, a measure of the amount of trabecular bone present inside the cortical envelope, is a highly heritable phenotype in young mice (49). This study was limited to a subset of the available CC lines and is an encouraging work in progress, suggesting that these strains will be useful for a variety of studies of bone genetics. Studies of aging in the CC, including bone aging, are ongoing. As each generation of CC mice is essentially identical to each preceding generation, like other recombinant inbred (RI) panels, the CC mice are ideal for studies for which more than one mouse is needed to establish a phenotype.
The Diversity Outbred population (DO) is a sister population to the CC. It is descended from the same eight inbred strains, but unlike the CC, the DO is maintained as an outbred population and as such each mouse is, in theory, genetically unique relative to all other DO mice. The 8 progenitor strains of the DO and CC represent three sub-species of mus musculus and as such capture up to four times the number of polymorphism represented in traditional or “classic” inbred strains (50, 51). As would be expected in such a genetically diverse population, there is extensive phenotypic diversity observed for traits such as trabecular bone in the distal femur (Figure 3).
Figure 3. Trabecular bone volume fraction (BV/TV) in DO mice.

BV/TV was measured in the distal femur in 6, 12 and 18 month old male and female DO mice by μCT by using standard methods. Even at six months of age some of the DO mice presented with a BV/TV of zero, indicating that all trabecular bone had been resorbed in these animals. The BV/TV was lowest in the oldest cohort of animals, which is reminiscent of the decrease in trabecular bone seen with aging in humans.
As in humans, there is also loss of trabecular bone in mice, but this is less a function of the “aging” process as the most significant loss of trabecular bone occurs before sexual maturation in both males and females (52). In order to study changes of trabecular bone with aging at the level of “population”, we examined 6, 12, and 18 month old DO mice. In this population, with aging, we observed a population average decrease in the amount of trabecular bone in the distal femur. However, unlike humans, eventually all trabecular bone can be resorbed at this site in an individual mouse, resulting in a hollow cortical shell (Figure 3 and 4). This typically does not result in spontaneous fractures in mice in a normal laboratory-caging environment and thus the contribution of trabecular bone to overall long bone structural integrity in mice may be minimal. This is in contrast to the human condition where loss of trabecular bone is the cause of fracture with osteoporosis.
Figure 4. Representative images of DO mice femurs as captured by microcomputed tomography.

Cross-sections of the mid-diaphysis (A) and the distal trabecular compartment (B) of femurs. All images are from 6 month old females. Images from A and B are not from the same animals. These representative animals highlight the vast diversity in bone phenotypes observed in this genetic mapping population.
Genetic Loci Mapped for Bone Mineral Density in Mice
In mice, there are two primary methods by which BMD has been measured for genetic mapping. The first method, Dual X-ray Absorptiometry (DXA), is essentially identical to the method for measuring BMD in humans. DXA measures the bone external silhouette area and bone mineral content (BMC) by planar projected X-ray. From these two measures, BMD is calculated as BMC (mass) divided by area, reflecting a two dimensional measure. Data are collected either for the whole body sans the head or for any desired regions of interest. Excised skeletal elements such as individual femurs may also be analyzed. The majority of GWAS for loci controlling bone mass in humans have been based on these DXA measurements of BMD (9–11), and usually the focus is on either the lumbar spine or proximal femur (hip). In mice it is common to collect data for whole body BMD, as well as regions of interest encompassing several vertebrae or the entire femur. The most utilized instrument for small animal DXA has a spatial resolution of 0.18 mm, providing relatively low resolution. In our DO study, the average thickness of individual trabeculae was 0.07 mm and thus, at this resolution, DXA is unable to capture any information on the architecture in the trabecular compartment alone. Rather, whole body BMD from a mouse largely reflects cortical bone, as this constitutes the majority of bone mass in a mouse. As BMD is calculated mathematically as mineral content divided by projected area, this measure is still largely influenced by apparent animal skeletal size. Increases or decreases in BMD as measured by DXA may not reflect an accrual of denser bone tissue (Figure 2 & 5). This is important when interpreting the genetic loci mapped for whole body DXA measured BMD.
Figure 5. Bone size effect on bone mineral density (BMD) measures made by dual X-ray absorptiometry (DXA).

Whole body BMD (A) and bone area (B) were measured by DXA in 17 week old male WSB/EiJ and NZO/H1LtJ mice. The head region was excluded from these measures. The density of the cortical bone of the tibia was measured by microcomputed tomography in these same mice (C). As expected, BMD was higher in the NZO/H1LtJ mice, which is largely a function of the much larger skeletal size of these mice. However, the true matrix mineral density of the cortical bone of these mice is not different. These data highlight that what is considered BMD for a whole animal does not reflect the true density of the actual bone tissue. The difference between BMD and matrix mineral density is an important consideration when interpreting candidate genes for BMD.
The second method that was widely used for BMD genetic mapping is Peripheral Quantitative Computed Tomography (pQCT). This method was exclusively applied to excised skeletal specimens such as individual lumbar vertebrae or femurs in the published genetic mapping studies (53). Unlike DXA, this method approximates a true volumetric density. In short, mineral content and cross-sectional area are measured at regular and precisely spaced intervals over the length of the bone. The distance between data collection sites is known and information for a given slice is extrapolated to represent a defined length of bone, creating a mineral content per unit volume measure of BMD (54). While the resolution of the pQCT is better than for the DXA instruments, this instrument is still not used to capture information on the trabecular compartment in rodent samples. Bone mineral density obtained by pQCT correlates strongly with bone mineral content as determined by ashing the bone but is heavily influenced by the cortical bone thickness. As a result, mouse strains with thick cortical bone, such as C3H have higher BMD than thin walled B6 bones (55), but this is not a tissue level density. The phenotype data collected by both pQCT and DXA is highly valuable for genetic mapping; however, the limitations and/or biases of the data must be considered for proper interpretation of any mapped genetic loci.
Given the high heritability of BMD in humans (7), there has been much interest in finding the genes that control this phenotype and other traits associated with the cause and progression of bone diseases such as osteoporosis. To date, there have been 11 large (100 or more mice) forward genetic mapping studies conducted that utilized the standard F2 intercross schema to find quantitative trait loci (QTL) for BMD (53). The differences between these 11 studies are largely due to differences in the method used to measure BMD and in the anatomic region of interest for which BMD was measured. Of these, five used DXA or a similar measure to obtain areal BMD phenotypes and all but one of these studies mapped traits for both whole body BMD plus a region of interest. Three studies used pQCT to obtain volumetric BMD measures of the femur and one of these three also measured vertebral volumetric BMD. Lastly, three studies measured a spectrum of bone mass phenotypes including both areal (DXA measured) and volumetric (pQCT measured) BMD measures. Collectively, 155 QTL for BMD measures were mapped in these 11 studies. While there are many genetic loci that control BMD irrespective of where it is measured, the studies in which QTL for BMD for more than one anatomic site were mapped show that the genetic control of BMD is not completely the same for the femur and the spine. Further, of these 155 loci, some appeared to be mapped in multiple crosses in which different strains where used. After filtering for these co-mapping events, these 155 loci can be conservatively binned into 85 discrete genetic regions.
Of these 11 studies, only one phenotyped animals older than six months of age, and this is the smallest of the mapping studies. Further, this small study used phenotyping methods that are not comparable to any of the other 11 studies. As a result, there is a paucity of data regarding genetic loci controlling BMD in aged animals and most of the available genetic data is for peak or near-peak BMD. This is an important deficiency in the available data, as we know from studies in humans that bone loss is partially a genetic phenomenon (56). In other words, the amount and rate of bone loss is not a universal constant and thus the information that would be learned from a genetic mapping study conducted in young versus older animals is likely not redundant with studies conducted on young animals. However, bone aging in mice does not follow the same pattern as in humans, so it may be possible to capture critical information about the genetics of the aging process in bone without aging the mice to the true equivalent of “elderly.”
While these 11 studies suffer from the same poor mapping resolution as do most two-generation intercross mapping studies, excellent concordance was observed between GWAS loci as mapped in humans and peak location for these mouse QTL (53). This is encouraging and suggests that despite the biases introduced from the phenotyping methods, these loci are likely caused by allelic variation in genes relevant to the human condition. A problem that lingers with GWAS for most complex disease traits is that only a small amount of the variance can be explained by the loci discovered in any one study. One theory proposed to explain why there is so much unexplained heritability is that GWAS is too stringent with regards to the significance thresholds applied. It is possible that less significant, yet biologically important, loci discarded. We used a series of bioinformatics methods applied to co-mapping loci on mouse Chr 15 to narrow this loci down to a single gene, Trichorhinophalengeal syndrome I (Trps1) (57). This gene is an attractive candidate as a BMD controlling gene, as in vitro studies suggest that it plays a role in regulating mineralization of the matrix by the osteoblast (58). A complementary study conducted by a different research team used the BXD recombinant inbred mice to determine that allelic differences in Trps1 interacted with gender to impact BMD (59). Both of these studies used this information regarding candidate gene location as a prior to focus genetic analyses using human data, and it was determined that the homologous gene in humans likely is also important for regulating BMD. The genotype-phenotype association at TRPS1 has not been high enough to surpass the large multiple testing penalty that is applied in GWAS when all of the genome is considered, but was significant in both of these targeted studies (57). In this manner, these mouse loci may be highly informative to identify a portion of the missing heritability for BMD after GWAS.
Moving past the intercross, a range of other study designs have been employed for mice to find the key genes controlling BMD. This includes studies using advanced intercross (AI) mice (60) and the hybrid mouse diversity panel (61). Not unexpectedly, these mapping populations resulted in better mapping resolution and have yielded a number of exciting candidate genes such as Additional sex combs like 2 (Asxl2) (61), BicC family RNA binding protein 1 (Bicc1) (62) and Cytochrome P450, family 51 (Cyp51) (60). All three of these genes are interesting as none were identified as associated with BMD by GWAS in humans. Each of these genes plays a different role in bone biology. Loss of Asxl2 in vitro in bone marrow cells results in a decrease in fusion of bone marrow macrophages into osteoclasts and it is thereby presumed that this gene is a regulator of bone resorption via a role in osteoclastogenesis regulation (61). The second of these, Bicc1 is thought to play a role in osteoblast maturation and function. Mice lacking one copy of the Bicc1 gene have decreased bone mass and knock down of this gene in vitro results in impaired osteoblastogenesis (62). The exact function of Cyp51 in bone is not known and mice lacking this gene are not viable (63). This gene is expressed in both osteoblasts and osteoclasts (60), and embryos lacking Cyp51 have severe dysmorphology of the limbs suggesting an impact on limb development and putatively bone size (63).
The distal end of mouse Chromosome (Chr) 1 has been extensively studied as this region is highly associated with bone mass. A total of 14 QTL were identified as mapping between 50 and 90 cM using F2 mapping (53) and multiple peaks for bone phenotypes were found using AI mice (60). These QTL do not cluster in discrete groups, but rather cascade down this interval (53). Extensive studies of nested congenics have shown that this region is actually a complicated cluster of smaller effect size loci affecting BMD, cortical geometry, and bone size. Further, some of these smaller effect size loci interact with gender (64–66). Candidate genes for some of these loci have been proposed. The first of these was originally identified as AC084073.22, which has been since renamed as Predicted Gene 4955 (Gm4955), and was identified using nested B6xC3H congenic mice (64). This region of the genome has been extensively re-annotated since the original publication of this finding and the exact nature of this gene remains unknown. A transcript for this gene shows differential expression between B6 and C3H but much remains unknown about a putative functional role. Interestingly, C3H-like alleles in this region interact with dietary fat to impact bone mass, and this may provide a critical clue regarding how this locus as a whole impacts bone (64). A second gene that was also identified using nested congenics is Duffy antigen receptor for chemokines (Darc). This gene impacts BMD via its regulation of osteoclast function (67). Other candidate genes proposed for some of these sub-loci include twist basic helix-loop-helix transcription factor 2 (Twist2), Interferon activated gene 202B (Ifi202b) and Gremlin 2 (Grem2) (68).
Genetic regulation of trabecular bone
From a forward genetics point of view trabecular bone has been much less studied than bone mass. Trabecular bone volume fraction (BV/TV) is the proportion of space within a defined trabecular compartment comprising bone, and has been mapped for QTL along with trabecular thickness and number. In a large study of B6xC3H mice, Bouxsein et al showed via X-ray microtomography (μCT) that genetic loci controlling overall volume of the trabecular compartment in the vertebral body do not overlap with loci controlling the volume of trabecular bone (69). This research group had previously mapped QTL for BMD of both the femur and the vertebrae using pQCT for these exact same animals (70, 71). What is most telling from this trabecular bone study is that there are unique loci for phenotypes defining the trabecular compartment versus whole bone BMD. The authors speculate that the existence of these unique trabecular QTL reflect that BMD in a mouse overwhelmingly reflects cortical bone volume, and that the contribution of trabecular bone was relatively too small to have been completely accounted for in their previous studies (69). It must also be remembered, however, that trabecular bone and cortical bone do have different rates of turnover, and trabecular phenotypes are highly informative regarding bone physiology independent of bone mass phenotypes such as total bone BMD.
A more recent forward mapping study examined trabecular bone mass and architecture in a very small study of CC mice (49). As expected, the per-loci intervals were substantially narrower than is observed for the traditional F2 intercross. None of the QTL found in CC mice overlap with those mapped in the B6xC3H cross, which is not unexpected given the possible differences in allele distribution in the CC relative to a B6 x C3H intercross and the small size of CC study. The heritability estimates for trabecular bone volume fraction and architecture calculated from the CC are encouraging and suggest that many more loci would be discovered when using a larger sample size. Both of these studies were conducted in young mice. Given that there is little to no trabecular bone left in the femur of older mice (Figure 3 and 4), care must be taken when designing and interpreting a study of the genetic control of the trabecular compartment. It is possible to measure trabecular bone mass in vivo in mice, but the available instruments are capable of only moderate resolution and the amount of X-ray exposure that the mouse is subjected to is a serious factor that must be considered as part of the experimental design. These instruments are improving and longitudinal studies of the genetics of trabecular bone loss may soon be accomplishable.
Genetic mapping for bone strength
While bone mass and bone density studies are illuminating regarding the etiology of disease, ultimately, the goal of identifying genes that regulate skeletal integrity and aging-related changes in bone is to provide new candidate therapeutic targets for treating and preventing osteoporotic loss of bone mass and bone matrix quality that lead to fragility fractures. As has been stated herein previously, BMD is correlated to strength, but it is not a perfect predictor of strength (Figure 2). Skeletal strength is achieved via integration of the mass, architectural distribution, and compositional quality of its constituent matrix material (72). Although deficiency in any of these contributors to maintaining integrity reduces bone strength, genetic mapping has foremost associated skeletal strength with bone mass and morphology. Using BMD as a surrogate to strength, genes have been identified that regulate important aspects of bone biology. Human GWAS has been successful in mapping to measures of BMD and geometry obtained via noninvasive imaging (73), but the genetic correlations of BMD to the incidence of vertebral fracture are modest (8). Since mapping directly to phenotypic measures of bone quality and strength requires destructive testing, animal models are required for compositional and mechanical analysis of bone matrix, with mice and rats providing important genetic findings that are often concordant with human data (74).
The mechanical integrity of a whole bone structure includes the aforementioned consideration of geometry (analogous to structural design in engineering) and constituent matrix material integrity. Since rodent bones are small, most genetic studies have relied on whole bone structural tests rather than attempting to prepare uniform and even smaller test specimens from heterogeneous bone matrix. The simplest choice has been used most widely, subjecting long bone diaphyseal cortex to flexural loading (i.e., bending). Together with measurement of cross-sectional (transverse) geometry of each specimen via volumetric imaging, such as provided by X-ray microtomography, estimates of the tissue- or material-level mechanical integrity can be calculated (72, 74). Without these geometrical measurements, the structural tests often reflect bone size and shape, as borne out in mapping studies that reveal coincident QTL for whole bone strength and measures of bone size (72).
In mice, genetic mapping studies that include direct measures of bone strength have identified approximately 50 QTL, but in many instances such attributions to strength were merely reflecting bone size and the geometrical indices that dictate structural resistance to bending (reviewed in (72)). A prime example of this is the locus mapped to Chr 4 and centered at ~60 cM, demonstrating a high degree of coincidence between the geometrical predictions and direct measures of whole bone structural performance. Specifically, at this genomic region, a locus for femoral BMD (70) was found in a B6 x C3H intercross population that co-mapped with loci for polar moment of inertia (geometrical stiffness) as well as flexural strength and work-to-failure (71). Congenic mice carrying C3H-like alleles on a B6 background show that this region also controls bone size (75). Given that this locus controls bone shape and size, it is not surprising that it also controls strength and thus when looking for the candidate gene, knowing how the locus impacts the larger phenotype is critical for understanding the biology impacted. While no candidate gene for this locus has been proposed, both wingless-type MMTV integration site family, member 4 (Wnt4) and zinc finger and BTB domain containing 40 (Zbtb40), genes repeatedly identified as associated with BMD in GWAS (76), are located in this interval.
In rats, approximately 41 discrete loci have been identified for phenotypes measuring whole bone strength and/or geometry (reviewed in (72)), with 23 loci mapping only to phenotypes describing geometry and/or size and 7 co-mapping strength and geometry phenotypes. The remaining 11 loci, which do not report co-mapping of a geometry phenotype, may include loci that regulate matrix-level quality but none had sufficient resolution to reduce identified QTLs to gene level. All of these studies used relatively young animals, yet we know that bone composition changes with age. Inclusion of older animals in future studies may identify genes that regulate bone matrix composition and quality to affect bone strength, and the current lack of such genetic data represents a key gap in knowledge.
Increasingly, genetically diverse rodent models are being used to refine mapping resolution to near-gene level, including the aforementioned DO population in mice and the more established heterogeneous stock (HS) rat outbred population. The HS descends from eight genetically diverse strains: ACI/N, BN/SsN, BUF/N, F344/N, M520/N, MR/N, WKY/N, and WN/N (77). This genetic mapping population revealed a high degree of heritability for femoral strength phenotypes measured at mid-diaphysis and the femoral neck (78). With increasing genetic mapping resolution afforded by higher density of genetic recombinations, this HS population was used to identify QTLs for structural dimensions and measures of femoral strength (79). QTLs were identified to approximately 1 Mb resolution for structural phenotypes on chromosomes 3, 8, 10, 12, 17, and 20, and for strength phenotypes on chromosomes 5, 10, and 11. At this time, these authors have only reported loci, and further work is needed to push this work to the level of candidate genes. The next logical steps would be to establish what genes control these traits, how and where these genes act in bone physiology and if these genes underlie human disease. Most QTL are not caused by polymorphisms in coding regions of genes, but rather are in regions that control subtle alterations in gene expression and or functionality (80). Thus, establishing that a gene is key for an aspect of bone physiology, such as can be done by knocking out a gene, is not the same as establishing how a gene is responsible for a genetic loci. It is unclear how many, if any, genetic loci mapped in mice harbor the same polymorphism as are disease-associated in humans (80), but understanding how genetic variation in regions of high sequence conservation impacts gene function may be very informative for the human condition as well (81).
Challenges face forward genetics studies of bone aging
As has been outlined in this paper, there remain many challenges with regards to the study of the genetics of bone aging. One challenge is that many phenotypes of interest, such as bone strength, are invasive or can only be collected once per animal. Technology for in vivo measure of phenotypes such as morphology continues to improve, but any study that involves the serial exposure of a mouse to X-radiation must consider the dose of the exposure and the impact (if any) of that exposure. Genetically stable (i.e. inbred) strains such as RI lines and or classical laboratory strains of mice are helpful to study changes that occur with aging in phenotypes that can only be measured once per mouse, as the genotype of an inbred is essentially identical in all mice of that strain. Thus, on a strain-by-strain average basis (compared to a within individual basis), the pattern of growth and aging changes in bone can be established using a cross-sectional study design. Care must be taken in these cross-sectional studies as bone is acutely sensitive to environmental factors such as stress and housing density (82). For these study designs to be successful, the environment to which all mice in a study are exposed to must be as invariant as possible. A second issue is that inbred mice have a wide range in expected lifespan (40) and in our experience, phenotypic data collected in the three month window immediately preceding death reflects the impact of pathology burden, not aging per se (83). Further, the rate of “bone aging” is not likely a universal event, but rather likely one that is highly dictated by genetic factors. Rate of bone aging can be explored within inbred strains in a cross sectional design readily by capturing phenotype data at regular intervals through adulthood and senesce.
Inbred populations such as RI’s can be used for genetic mapping. A key advantage of these populations is that repeat measures per genotype can be made, thereby reducing the dilution of true genetic signal by measurement error for so called “noisy” phenotypes (84–86). However, inbred populations, such as RI panels, are usually too small for detection of low effect size loci and mapping resolution is dependent on the density of viable recombination. The crossing of recombinant inbred mice (so called RIX design) has been proposed to increase the number of allelic combinations for genetic mapping, yet retain the ability for repeated measures (85).
Outbred populations remain attractive for genetic mapping studies, and this is especially true for the newer multi-generational crosses. For a thorough discussion of the genetic mapping advantages of these populations, the reader is referred to the two reviews referenced (87, 88). The disadvantage of these mice is that in theory each allelic combination is only seen once per study, so invasive or terminal phenotyping protocols cannot be repeatedly measured per genome with aging. Further, the maximum lifespan of any one mouse cannot be known and at the population level, lifespan ranges widely. The advantages of these populations include the increased mapping resolution and large phenotypic diversity present and as such, outbreds remain very attractive for certain study designs.
Conclusions
While BMD has been the mainstay phenotype of skeletal genetics studies, it is not an ideal surrogate for bone strength. Many aspects of bone that contribute to strength change with aging, including bone composition and size. While these phenotypes can affect the measurement of BMD, their genetic control is independent of BMD. The majority of genetic studies of bone have been conducted in young rodents, and although novel regulators of bone biology have been identified, a paucity of information is available regarding the genetic regulation of aging-associated changes in bone. Bone does not age the same in mice as it does in humans as is evidenced by the fact that substantial trabecular bone loss precedes sexual maturation in mice (52), and that all trabecular bone can be lost at some anatomical sites in mice at a relatively young age. These differences must be considered when designing studies of bone aging in model organisms.
Successes in genetic mapping for non-bone phenotypes using these newer genetic mapping populations (51, 89) suggest that future studies of the genetic regulation of bone will not stall at the locus stage, but rather will be able to proceed all the way to establishing which genes and polymorphisms are associated with variation in these traits. While there are differences in how bone ages in the mouse relative to the human, the genetic mapping studies conducted in younger mice are concordant with human GWAS studies and provide valuable insight into the genetic etiology of osteoporosis in humans.
Acknowledgments
Research reported in this publication was supported by the National Institute of Arthritis and Musculoskeletal and Skin Diseases of the National Institutes of Health under Award Numbers AR064941 (to DR) and AR060234 (to CLAB).
References Cited
- 1.Leali PT, Muresu F, Melis A, Ruggiu A, Zachos A, Doria C. Skeletal fragility definition. Clin Cases Miner Bone Metab. 2011 May;8(2):11–3. Epub 2012/03/31. [PMC free article] [PubMed] [Google Scholar]
- 2.Blume SW, Curtis JR. Medical costs of osteoporosis in the elderly Medicare population. Osteoporos Int. 2011 Jun;22(6):1835–44. doi: 10.1007/s00198-010-1419-7. [DOI] [PMC free article] [PubMed] [Google Scholar]
- 3.von Friesendorff M, McGuigan FE, Besjakov J, Akesson K. Hip fracture in men-survival and subsequent fractures: a cohort study with 22-year follow-up. J Am Geriatr Soc. 2011 May;59(5):806–13. doi: 10.1111/j.1532-5415.2011.03399.x. [DOI] [PubMed] [Google Scholar]
- 4.Willson T, Nelson SD, Newbold J, Nelson RE, LaFleur J. The clinical epidemiology of male osteoporosis: a review of the recent literature. Clin Epidemiol. 2015;7:65–76. doi: 10.2147/CLEP.S40966. [DOI] [PMC free article] [PubMed] [Google Scholar]
- 5.Brauer CA, Coca-Perraillon M, Cutler DM, Rosen AB. Incidence and mortality of hip fractures in the United States. JAMA. 2009 Oct 14;302(14):1573–9. doi: 10.1001/jama.2009.1462. [DOI] [PMC free article] [PubMed] [Google Scholar]
- 6.Bliuc D, Nguyen ND, Milch VE, Nguyen TV, Eisman JA, Center JR. Mortality risk associated with low-trauma osteoporotic fracture and subsequent fracture in men and women. JAMA. 2009 Feb 4;301(5):513–21. doi: 10.1001/jama.2009.50. [DOI] [PubMed] [Google Scholar]
- 7.Ralston SH, Uitterlinden AG. Genetics of osteoporosis. Endocr Rev. 2010 Oct;31(5):629–62. doi: 10.1210/er.2009-0044. [DOI] [PubMed] [Google Scholar]
- 8.Liu CT, Karasik D, Zhou Y, Hsu YH, Genant HK, Broe KE, et al. Heritability of prevalent vertebral fracture and volumetric bone mineral density and geometry at the lumbar spine in three generations of the Framingham study. J Bone Miner Res. 2012 Apr;27(4):954–8. doi: 10.1002/jbmr.1537. [DOI] [PMC free article] [PubMed] [Google Scholar]
- 9.Alonso N, Ralston SH. Unveiling the mysteries of the genetics of osteoporosis. J Endocrinol Invest. 2014 Oct;37(10):925–34. doi: 10.1007/s40618-014-0149-7. Epub 2014/08/26. [DOI] [PubMed] [Google Scholar]
- 10.Estrada K, Styrkarsdottir U, Evangelou E, Hsu YH, Duncan EL, Ntzani EE, et al. Genome-wide meta-analysis identifies 56 bone mineral density loci and reveals 14 loci associated with risk of fracture. Nat Genet. 2012 May;44(5):491–501. doi: 10.1038/ng.2249. Epub 2012/04/17. [DOI] [PMC free article] [PubMed] [Google Scholar]
- 11.Zheng HF, Forgetta V, Hsu YH, Estrada K, Rosello-Diez A, Leo PJ, et al. Whole-genome sequencing identifies EN1 as a determinant of bone density and fracture. Nature. 2015 Oct 1;526(7571):112–7. doi: 10.1038/nature14878. [DOI] [PMC free article] [PubMed] [Google Scholar]
- 12.Marshall D, Johnell O, Wedel H. Meta-analysis of how well measures of bone mineral density predict occurrence of osteoporotic fractures. BMJ. 1996 May 18;312(7041):1254–9. doi: 10.1136/bmj.312.7041.1254. Epub 1996/05/18. [DOI] [PMC free article] [PubMed] [Google Scholar]
- 13.Burgeson RE, Nimni ME. Collagen types. Molecular structure and tissue distribution. Clin Orthop Relat Res. 1992 Sep;(282):250–72. [PubMed] [Google Scholar]
- 14.Boskey AL, Robey PG. The composition of Bone. In: Rosen CJ, editor. Primer on the Metabolic Bone Diseases and Disorders of Mineral Metabolis,\m. 8. Wiley-Blackwell; 2013. pp. 49–58. [Google Scholar]
- 15.Zimmermann EA, Busse B, Ritchie RO. The fracture mechanics of human bone: influence of disease and treatment. Bonekey Rep. 2015;4:743. doi: 10.1038/bonekey.2015.112. [DOI] [PMC free article] [PubMed] [Google Scholar]
- 16.Jilka RL. The relevance of mouse models for investigating age-related bone loss in humans. J Gerontol A Biol Sci Med Sci. 2013 Oct;68(10):1209–17. doi: 10.1093/gerona/glt046. Epub 2013/05/22. [DOI] [PMC free article] [PubMed] [Google Scholar]
- 17.Valcourt U, Merle B, Gineyts E, Viguet-Carrin S, Delmas PD, Garnero P. Non-enzymatic glycation of bone collagen modifies osteoclastic activity and differentiation. J Biol Chem. 2007 Feb 23;282(8):5691–703. doi: 10.1074/jbc.M610536200. Epub 2006/12/05. [DOI] [PubMed] [Google Scholar]
- 18.Abraham AC, Agarwalla A, Yadavalli A, McAndrew C, Liu JY, Tang SY. Multiscale Predictors of Femoral Neck In Situ Strength in Aging Women: Contributions of BMD, Cortical Porosity, Reference Point Indentation, and Nonenzymatic Glycation. J Bone Miner Res. 2015 Dec;30(12):2207–14. doi: 10.1002/jbmr.2568. Epub 2015/06/11. [DOI] [PMC free article] [PubMed] [Google Scholar]
- 19.Hernandez CJ, Tang SY, Baumbach BM, Hwu PB, Sakkee AN, van der Ham F, et al. Trabecular microfracture and the influence of pyridinium and non-enzymatic glycation-mediated collagen cross-links. Bone. 2005 Dec;37(6):825–32. doi: 10.1016/j.bone.2005.07.019. Epub 2005/09/06. [DOI] [PMC free article] [PubMed] [Google Scholar]
- 20.Lynch K, Pei M. Age associated communication between cells and matrix: a potential impact on stem cell-based tissue regeneration strategies. Organogenesis. 2014;10(3):289–98. doi: 10.4161/15476278.2014.970089. Epub 2014/12/09. [DOI] [PMC free article] [PubMed] [Google Scholar]
- 21.Marini JC, Reich A, Smith SM. Osteogenesis imperfecta due to mutations in non-collagenous genes: lessons in the biology of bone formation. Curr Opin Pediatr. 2014 Aug;26(4):500–7. doi: 10.1097/MOP.0000000000000117. [DOI] [PMC free article] [PubMed] [Google Scholar]
- 22.Maruyama N, Shibata Y, Mochizuki A, Yamada A, Maki K, Inoue T, et al. Bone micro-fragility caused by the mimetic aging processes in alpha-klotho deficient mice: in situ nanoindentation assessment of dilatational bands. Biomaterials. 2015 Apr;47:62–71. doi: 10.1016/j.biomaterials.2015.01.004. Epub 2015/02/16. [DOI] [PubMed] [Google Scholar]
- 23.Poundarik AA, Diab T, Sroga GE, Ural A, Boskey AL, Gundberg CM, et al. Dilatational band formation in bone. Proc Natl Acad Sci U S A. 2012 Nov 20;109(47):19178–83. doi: 10.1073/pnas.1201513109. Epub 2012/11/07. [DOI] [PMC free article] [PubMed] [Google Scholar]
- 24.Boskey AL, Moore DJ, Amling M, Canalis E, Delany AM. Infrared analysis of the mineral and matrix in bones of osteonectin-null mice and their wildtype controls. J Bone Miner Res. 2003 Jun;18(6):1005–11. doi: 10.1359/jbmr.2003.18.6.1005. [DOI] [PubMed] [Google Scholar]
- 25.Akkus O, Adar F, Schaffler MB. Age-related changes in physicochemical properties of mineral crystals are related to impaired mechanical function of cortical bone. Bone. 2004 Mar;34(3):443–53. doi: 10.1016/j.bone.2003.11.003. [DOI] [PubMed] [Google Scholar]
- 26.Kuhn LT, Grynpas MD, Rey CC, Wu Y, Ackerman JL, Glimcher MJ. A comparison of the physical and chemical differences between cancellous and cortical bovine bone mineral at two ages. Calcif Tissue Int. 2008 Aug;83(2):146–54. doi: 10.1007/s00223-008-9164-z. Epub 2008/08/08. [DOI] [PMC free article] [PubMed] [Google Scholar]
- 27.Yerramshetty JS, Akkus O. The associations between mineral crystallinity and the mechanical properties of human cortical bone. Bone. 2008 Mar;42(3):476–82. doi: 10.1016/j.bone.2007.12.001. [DOI] [PubMed] [Google Scholar]
- 28.Boskey AL, Donnelly E, Boskey E, Spevak L, Ma Y, Zhang W, et al. Examining the Relationships between Bone Tissue Composition, Compositional Heterogeneity and Fragility Fracture: A Matched Case Controlled FTIRI Study. J Bone Miner Res. 2015 Dec 4; doi: 10.1002/jbmr.2759. [DOI] [PMC free article] [PubMed] [Google Scholar]
- 29.Bishop N, Sprigg A, Dalton A. Unexplained fractures in infancy: looking for fragile bones. Arch Dis Child. 2007 Mar;92(3):251–6. doi: 10.1136/adc.2006.106120. Epub 2007/03/06. [DOI] [PMC free article] [PubMed] [Google Scholar]
- 30.Courtland HW, Nasser P, Goldstone AB, Spevak L, Boskey AL, Jepsen KJ. Fourier transform infrared imaging microspectroscopy and tissue-level mechanical testing reveal intraspecies variation in mouse bone mineral and matrix composition. Calcif Tissue Int. 2008 Nov;83(5):342–53. doi: 10.1007/s00223-008-9176-8. [DOI] [PMC free article] [PubMed] [Google Scholar]
- 31.Manolagas SC, Parfitt AM. What old means to bone. Trends Endocrinol Metab. 2010 Jun;21(6):369–74. doi: 10.1016/j.tem.2010.01.010. [DOI] [PMC free article] [PubMed] [Google Scholar]
- 32.Drake MT, Khosla S. Male osteoporosis. Endocrinol Metab Clin North Am. 2012 Sep;41(3):629–41. doi: 10.1016/j.ecl.2012.05.001. Epub 2012/08/11. [DOI] [PMC free article] [PubMed] [Google Scholar]
- 33.Seeman E. Periosteal bone formation--a neglected determinant of bone strength. N Engl J Med. 2003 Jul 24;349(4):320–3. doi: 10.1056/NEJMp038101. Epub 2003/07/25. [DOI] [PubMed] [Google Scholar]
- 34.Riggs BL, Melton LJ, Robb RA, Camp JJ, Atkinson EJ, McDaniel L, et al. A population-based assessment of rates of bone loss at multiple skeletal sites: evidence for substantial trabecular bone loss in young adult women and men. J Bone Miner Res. 2008 Feb;23(2):205–14. doi: 10.1359/JBMR.071020. Epub 2007/10/17. [DOI] [PMC free article] [PubMed] [Google Scholar]
- 35.Lanyon L, Skerry T. Postmenopausal osteoporosis as a failure of bone’s adaptation to functional loading: a hypothesis. J Bone Miner Res. 2001 Nov;16(11):1937–47. doi: 10.1359/jbmr.2001.16.11.1937. Epub 2001/11/08. [DOI] [PubMed] [Google Scholar]
- 36.Martin RB, Atkinson PJ. Age and sex-related changes in the structure and strength of the human femoral shaft. J Biomech. 1977;10(4):223–31. doi: 10.1016/0021-9290(77)90045-8. Epub 1977/01/01. [DOI] [PubMed] [Google Scholar]
- 37.Szulc P, Seeman E, Duboeuf F, Sornay-Rendu E, Delmas PD. Bone fragility: failure of periosteal apposition to compensate for increased endocortical resorption in postmenopausal women. J Bone Miner Res. 2006 Dec;21(12):1856–63. doi: 10.1359/jbmr.060904. Epub 2006/09/28. [DOI] [PubMed] [Google Scholar]
- 38.Lauretani F, Bandinelli S, Griswold ME, Maggio M, Semba R, Guralnik JM, et al. Longitudinal changes in BMD and bone geometry in a population-based study. J Bone Miner Res. 2008 Mar;23(3):400–8. doi: 10.1359/JBMR.071103. Epub 2007/11/14. [DOI] [PMC free article] [PubMed] [Google Scholar]
- 39.Ferguson VL, Ayers RA, Bateman TA, Simske SJ. Bone development and age-related bone loss in male C57BL/6J mice. Bone. 2003 Sep;33(3):387–98. doi: 10.1016/s8756-3282(03)00199-6. Epub 2003/09/19. [DOI] [PubMed] [Google Scholar]
- 40.Yuan R, Tsaih SW, Petkova SB, Marin de Evsikova C, Xing S, Marion MA, et al. Aging in inbred strains of mice: study design and interim report on median lifespans and circulating IGF1 levels. Aging Cell. 2009 Jun;8(3):277–87. doi: 10.1111/j.1474-9726.2009.00478.x. [DOI] [PMC free article] [PubMed] [Google Scholar]
- 41.Barak MM, Lieberman DE, Hublin JJ. A Wolff in sheep’s clothing: trabecular bone adaptation in response to changes in joint loading orientation. Bone. 2011 Dec;49(6):1141–51. doi: 10.1016/j.bone.2011.08.020. Epub 2011/09/07. [DOI] [PubMed] [Google Scholar]
- 42.Fox JC, Keaveny TM. Trabecular eccentricity and bone adaptation. J Theor Biol. 2001 Sep 21;212(2):211–21. doi: 10.1006/jtbi.2001.2371. Epub 2001/09/05. [DOI] [PubMed] [Google Scholar]
- 43.Jacobs CR. The mechanobiology of cancellous bone structural adaptation. J Rehabil Res Dev. 2000 Mar-Apr;37(2):209–16. Epub 2000/06/13. [PubMed] [Google Scholar]
- 44.Keaveny TM, Morgan EF, Niebur GL, Yeh OC. Biomechanics of trabecular bone. Annu Rev Biomed Eng. 2001;3:307–33. doi: 10.1146/annurev.bioeng.3.1.307. Epub 2001/07/12. [DOI] [PubMed] [Google Scholar]
- 45.Mittra E, Rubin C, Qin YX. Interrelationship of trabecular mechanical and microstructural properties in sheep trabecular bone. J Biomech. 2005 Jun;38(6):1229–37. doi: 10.1016/j.jbiomech.2004.06.007. Epub 2005/05/03. [DOI] [PubMed] [Google Scholar]
- 46.Pontzer H, Lieberman DE, Momin E, Devlin MJ, Polk JD, Hallgrimsson B, et al. Trabecular bone in the bird knee responds with high sensitivity to changes in load orientation. J Exp Biol. 2006 Jan;209(Pt 1):57–65. doi: 10.1242/jeb.01971. Epub 2005/12/16. [DOI] [PubMed] [Google Scholar]
- 47.Ruff C, Holt B, Trinkaus E. Who’s afraid of the big bad Wolff?: “Wolff’s law” and bone functional adaptation. Am J Phys Anthropol. 2006 Apr;129(4):484–98. doi: 10.1002/ajpa.20371. Epub 2006/01/21. [DOI] [PubMed] [Google Scholar]
- 48.Sornay-Rendu E, Boutroy S, Munoz F, Delmas PD. Alterations of cortical and trabecular architecture are associated with fractures in postmenopausal women, partially independent of decreased BMD measured by DXA: the OFELY study. J Bone Miner Res. 2007 Mar;22(3):425–33. doi: 10.1359/jbmr.061206. Epub 2006/12/22. [DOI] [PubMed] [Google Scholar]
- 49.Levy R, Mott RF, Iraqi FA, Gabet Y. Collaborative cross mice in a genetic association study reveal new candidate genes for bone microarchitecture. BMC Genomics. 2015;16(1):1013. doi: 10.1186/s12864-015-2213-x. Epub 2015/11/28. [DOI] [PMC free article] [PubMed] [Google Scholar]
- 50.Gatti DM, Svenson KL, Shabalin A, Wu LY, Valdar W, Simecek P, et al. Quantitative trait locus mapping methods for diversity outbred mice. G3 (Bethesda) 2014 Sep;4(9):1623–33. doi: 10.1534/g3.114.013748. [DOI] [PMC free article] [PubMed] [Google Scholar]
- 51.Svenson KL, Gatti DM, Valdar W, Welsh CE, Cheng R, Chesler EJ, et al. High-resolution genetic mapping using the Mouse Diversity outbred population. Genetics. 2012 Feb;190(2):437–47. doi: 10.1534/genetics.111.132597. [DOI] [PMC free article] [PubMed] [Google Scholar]
- 52.Glatt V, Canalis E, Stadmeyer L, Bouxsein ML. Age-related changes in trabecular architecture differ in female and male C57BL/6J mice. J Bone Miner Res. 2007 Aug;22(8):1197–207. doi: 10.1359/jbmr.070507. Epub 2007/05/10. [DOI] [PubMed] [Google Scholar]
- 53.Ackert-Bicknell CL, Karasik D, Li Q, Smith RV, Hsu YH, Churchill GA, et al. Mouse BMD quantitative trait loci show improved concordance with human genome-wide association loci when recalculated on a new, common mouse genetic map. J Bone Miner Res. 2010 Aug;25(8):1808–20. doi: 10.1002/jbmr.72. Epub 2010/03/05. [DOI] [PMC free article] [PubMed] [Google Scholar]
- 54.Beamer WG, Donahue LR, Rosen CJ, Baylink DJ. Genetic variability in adult bone density among inbred strains of mice. Bone. 1996 May;18(5):397–403. doi: 10.1016/8756-3282(96)00047-6. Epub 1996/05/01. [DOI] [PubMed] [Google Scholar]
- 55.Brodt MD, Pelz GB, Taniguchi J, Silva MJ. Accuracy of peripheral quantitative computed tomography (pQCT) for assessing area and density of mouse cortical bone. Calcif Tissue Int. 2003 Oct;73(4):411–8. doi: 10.1007/s00223-002-0006-0. Epub 2004/01/28. [DOI] [PubMed] [Google Scholar]
- 56.Moayyeri A, Hammond CJ, Hart DJ, Spector TD. Effects of age on genetic influence on bone loss over 17 years in women: the Healthy Ageing Twin Study (HATS) J Bone Miner Res. 2012 Oct;27(10):2170–8. doi: 10.1002/jbmr.1659. Epub 2012/05/17. [DOI] [PubMed] [Google Scholar]
- 57.Ackert-Bicknell CL, Demissie S, Tsaih SW, Beamer WG, Cupples LA, Paigen BJ, et al. Genetic variation in TRPS1 may regulate hip geometry as well as bone mineral density. Bone. 2012 May;50(5):1188–95. doi: 10.1016/j.bone.2012.01.011. Epub 2012/02/07. [DOI] [PMC free article] [PubMed] [Google Scholar]
- 58.Piscopo DM, Johansen EB, Derynck R. Identification of the GATA factor TRPS1 as a repressor of the osteocalcin promoter. J Biol Chem. 2009 Nov 13;284(46):31690–703. doi: 10.1074/jbc.M109.052316. [DOI] [PMC free article] [PubMed] [Google Scholar]
- 59.Wang L, Lu W, Zhang L, Huang Y, Scheib R, Liu X, et al. Trps1 differentially modulates the bone mineral density between male and female mice and its polymorphism associates with BMD differently between women and men. PLoS One. 2014;9(1):e84485. doi: 10.1371/journal.pone.0084485. Epub 2014/01/15. [DOI] [PMC free article] [PubMed] [Google Scholar]
- 60.Leamy LJ, Kelly SA, Hua K, Farber CR, Pomp D. Quantitative trait loci for bone mineral density and femoral morphology in an advanced intercross population of mice. Bone. 2013 Jul;55(1):222–9. doi: 10.1016/j.bone.2013.02.014. Epub 2013/03/15. [DOI] [PMC free article] [PubMed] [Google Scholar]
- 61.Farber CR, Bennett BJ, Orozco L, Zou W, Lira A, Kostem E, et al. Mouse genome-wide association and systems genetics identify Asxl2 as a regulator of bone mineral density and osteoclastogenesis. PLoS Genet. 2011 Apr;7(4):e1002038. doi: 10.1371/journal.pgen.1002038. [DOI] [PMC free article] [PubMed] [Google Scholar]
- 62.Mesner LD, Ray B, Hsu YH, Manichaikul A, Lum E, Bryda EC, et al. Bicc1 is a genetic determinant of osteoblastogenesis and bone mineral density. J Clin Invest. 2014 Jun;124(6):2736–49. doi: 10.1172/JCI73072. Epub 2014/05/03. [DOI] [PMC free article] [PubMed] [Google Scholar]
- 63.Keber R, Motaln H, Wagner KD, Debeljak N, Rassoulzadegan M, Acimovic J, et al. Mouse knockout of the cholesterogenic cytochrome P450 lanosterol 14alpha-demethylase (Cyp51) resembles Antley-Bixler syndrome. J Biol Chem. 2011 Aug 19;286(33):29086–97. doi: 10.1074/jbc.M111.253245. [DOI] [PMC free article] [PubMed] [Google Scholar]
- 64.Beamer WG, Shultz KL, Coombs HF, 3rd, DeMambro VE, Reinholdt LG, Ackert-Bicknell CL, et al. BMD regulation on mouse distal chromosome 1, candidate genes, and response to ovariectomy or dietary fat. J Bone Miner Res. 2011 Jan;26(1):88–99. doi: 10.1002/jbmr.200. Epub 2010/08/06. [DOI] [PMC free article] [PubMed] [Google Scholar]
- 65.Edderkaoui B, Baylink DJ, Beamer WG, Shultz KL, Wergedal JE, Mohan S. Genetic regulation of femoral bone mineral density: complexity of sex effect in chromosome 1 revealed by congenic sublines of mice. Bone. 2007 Sep;41(3):340–5. doi: 10.1016/j.bone.2007.05.013. Epub 2007/07/10. [DOI] [PubMed] [Google Scholar]
- 66.Edderkaoui B, Baylink DJ, Beamer WG, Wergedal JE, Dunn NR, Shultz KL, et al. Multiple genetic loci from CAST/EiJ chromosome 1 affect vBMD either positively or negatively in a C57BL/6J background. J Bone Miner Res. 2006 Jan;21(1):97–104. doi: 10.1359/JBMR.051008. Epub 2005/12/16. [DOI] [PubMed] [Google Scholar]
- 67.Edderkaoui B, Baylink DJ, Beamer WG, Wergedal JE, Porte R, Chaudhuri A, et al. Identification of mouse Duffy antigen receptor for chemokines (Darc) as a BMD QTL gene. Genome Res. 2007 May;17(5):577–85. doi: 10.1101/gr.6009507. Epub 2007/04/10. [DOI] [PMC free article] [PubMed] [Google Scholar]
- 68.Farber CR, van Nas A, Ghazalpour A, Aten JE, Doss S, Sos B, et al. An integrative genetics approach to identify candidate genes regulating BMD: combining linkage, gene expression, and association. J Bone Miner Res. 2009 Jan;24(1):105–16. doi: 10.1359/JBMR.080908. Epub 2008/09/05. [DOI] [PMC free article] [PubMed] [Google Scholar]
- 69.Bouxsein ML, Uchiyama T, Rosen CJ, Shultz KL, Donahue LR, Turner CH, et al. Mapping quantitative trait loci for vertebral trabecular bone volume fraction and microarchitecture in mice. J Bone Miner Res. 2004 Apr;19(4):587–99. doi: 10.1359/JBMR.0301255. [DOI] [PubMed] [Google Scholar]
- 70.Beamer WG, Shultz KL, Donahue LR, Churchill GA, Sen S, Wergedal JR, et al. Quantitative trait loci for femoral and lumbar vertebral bone mineral density in C57BL/6J and C3H/HeJ inbred strains of mice. J Bone Miner Res. 2001 Jul;16(7):1195–206. doi: 10.1359/jbmr.2001.16.7.1195. Epub 2001/07/14. [DOI] [PubMed] [Google Scholar]
- 71.Koller DL, Schriefer J, Sun Q, Shultz KL, Donahue LR, Rosen CJ, et al. Genetic effects for femoral biomechanics, structure, and density in C57BL/6J and C3H/HeJ inbred mouse strains. J Bone Miner Res. 2003 Oct;18(10):1758–65. doi: 10.1359/jbmr.2003.18.10.1758. Epub 2003/10/31. [DOI] [PubMed] [Google Scholar]
- 72.Adams DJ, Ackert-Bicknell CL. Genetic regulation of bone strength: a review of animal model studies. Bonekey Rep. 2015;4:714. doi: 10.1038/bonekey.2015.83. [DOI] [PMC free article] [PubMed] [Google Scholar]
- 73.Hsu YH, Kiel DP. Clinical review: Genome-wide association studies of skeletal phenotypes: what we have learned and where we are headed. J Clin Endocrinol Metab. 2012 Oct;97(10):E1958–77. doi: 10.1210/jc.2012-1890. Epub 2012/09/12. [DOI] [PMC free article] [PubMed] [Google Scholar]
- 74.Jepsen KJ, Silva MJ, Vashishth D, Guo XE, van der Meulen MC. Establishing biomechanical mechanisms in mouse models: practical guidelines for systematically evaluating phenotypic changes in the diaphyses of long bones. J Bone Miner Res. 2015 Jun;30(6):951–66. doi: 10.1002/jbmr.2539. [DOI] [PMC free article] [PubMed] [Google Scholar]
- 75.Shultz KL, Donahue LR, Bouxsein ML, Baylink DJ, Rosen CJ, Beamer WG. Congenic strains of mice for verification and genetic decomposition of quantitative trait loci for femoral bone mineral density. J Bone Miner Res. 2003 Feb;18(2):175–85. doi: 10.1359/jbmr.2003.18.2.175. Epub 2003/02/06. [DOI] [PubMed] [Google Scholar]
- 76.Rivadeneira F, Styrkarsdottir U, Estrada K, Halldorsson BV, Hsu YH, Richards JB, et al. Twenty bone-mineral-density loci identified by large-scale meta-analysis of genome-wide association studies. Nat Genet. 2009 Nov;41(11):1199–206. doi: 10.1038/ng.446. Epub 2009/10/06. [DOI] [PMC free article] [PubMed] [Google Scholar]
- 77.Hansen C, Spuhler K. Development of the National Institutes of Health genetically heterogeneous rat stock. Alcohol Clin Exp Res. 1984 Sep-Oct;8(5):477–9. doi: 10.1111/j.1530-0277.1984.tb05706.x. [DOI] [PubMed] [Google Scholar]
- 78.Alam I, Koller DL, Sun Q, Roeder RK, Canete T, Blazquez G, et al. Heterogeneous stock rat: a unique animal model for mapping genes influencing bone fragility. Bone. 2011 May 1;48(5):1169–77. doi: 10.1016/j.bone.2011.02.009. Epub 2011/02/22. [DOI] [PMC free article] [PubMed] [Google Scholar]
- 79.Alam I, Koller DL, Canete T, Blazquez G, Mont-Cardona C, Lopez-Aumatell R, et al. Fine mapping of bone structure and strength QTLs in heterogeneous stock rat. Bone. 2015 Dec;81:417–26. doi: 10.1016/j.bone.2015.08.013. [DOI] [PMC free article] [PubMed] [Google Scholar]
- 80.Flint J, Mackay TF. Genetic architecture of quantitative traits in mice, flies, and humans. Genome Res. 2009 May;19(5):723–33. doi: 10.1101/gr.086660.108. [DOI] [PMC free article] [PubMed] [Google Scholar]
- 81.Yalcin B, Flint J, Mott R. Using progenitor strain information to identify quantitative trait nucleotides in outbred mice. Genetics. 2005 Oct;171(2):673–81. doi: 10.1534/genetics.104.028902. [DOI] [PMC free article] [PubMed] [Google Scholar]
- 82.Meakin LB, Sugiyama T, Galea GL, Browne WJ, Lanyon LE, Price JS. Male mice housed in groups engage in frequent fighting and show a lower response to additional bone loading than females or individually housed males that do not fight. Bone. 2013 May;54(1):113–7. doi: 10.1016/j.bone.2013.01.029. [DOI] [PMC free article] [PubMed] [Google Scholar]
- 83.Ackert-Bicknell CL, Anderson LC, Sheehan S, Hill WG, Chang B, Churchill GA, et al. Aging Research Using Mouse Models. Curr Protoc Mouse Biol. 2015;5(2):95–133. doi: 10.1002/9780470942390.mo140195. [DOI] [PMC free article] [PubMed] [Google Scholar]
- 84.Belknap JK. Effect of within-strain sample size on QTL detection and mapping using recombinant inbred mouse strains. Behav Genet. 1998 Jan;28(1):29–38. doi: 10.1023/a:1021404714631. [DOI] [PubMed] [Google Scholar]
- 85.Zou F, Gelfond JA, Airey DC, Lu L, Manly KF, Williams RW, et al. Quantitative trait locus analysis using recombinant inbred intercrosses: theoretical and empirical considerations. Genetics. 2005 Jul;170(3):1299–311. doi: 10.1534/genetics.104.035709. [DOI] [PMC free article] [PubMed] [Google Scholar]
- 86.Broman KW, Sen S. A guide to QTL MApping with R/qtl. Springer; 2009. [Google Scholar]
- 87.Churchill GA, Gatti DM, Munger SC, Svenson KL. The Diversity Outbred mouse population. Mamm Genome. 2012 Oct;23(9–10):713–8. doi: 10.1007/s00335-012-9414-2. [DOI] [PMC free article] [PubMed] [Google Scholar]
- 88.Gonzales NM, Palmer AA. Fine-mapping QTLs in advanced intercross lines and other outbred populations. Mamm Genome. 2014 Aug;25(7–8):271–92. doi: 10.1007/s00335-014-9523-1. [DOI] [PMC free article] [PubMed] [Google Scholar]
- 89.French JE, Gatti DM, Morgan DL, Kissling GE, Shockley KR, Knudsen GA, et al. Diversity Outbred Mice Identify Population-Based Exposure Thresholds and Genetic Factors that Influence Benzene-Induced Genotoxicity. Environ Health Perspect. 2015 Mar;123(3):237–45. doi: 10.1289/ehp.1408202. [DOI] [PMC free article] [PubMed] [Google Scholar]