Significance
The 26S proteasome is a giant protease assembled from at least 32 different canonical subunits. In eukaryotic cells it is responsible for the regulated degradation of proteins marked for destruction by polyubiquitin tags. Mainly because of the conformational heterogeneity of the 26S holocomplex, its structure determination has been challenging. Using cryo-electron microscopy single-particle analysis we were able to obtain a high-resolution structure of the human 26S proteasome allowing us to put forward an essentially complete atomic model. This model provides insights into the proteasome’s mechanism of operation and could serve as a basis for structure-based drug discovery.
Keywords: proteostasis, cryo-electron microscopy, AAA-ATPase, integrative modeling
Abstract
Protein degradation in eukaryotic cells is performed by the Ubiquitin-Proteasome System (UPS). The 26S proteasome holocomplex consists of a core particle (CP) that proteolytically degrades polyubiquitylated proteins, and a regulatory particle (RP) containing the AAA-ATPase module. This module controls access to the proteolytic chamber inside the CP and is surrounded by non-ATPase subunits (Rpns) that recognize substrates and deubiquitylate them before unfolding and degradation. The architecture of the 26S holocomplex is highly conserved between yeast and humans. The structure of the human 26S holocomplex described here reveals previously unidentified features of the AAA-ATPase heterohexamer. One subunit, Rpt6, has ADP bound, whereas the other five have ATP in their binding pockets. Rpt6 is structurally distinct from the other five Rpt subunits, most notably in its pore loop region. For Rpns, the map reveals two main, previously undetected, features: the C terminus of Rpn3 protrudes into the mouth of the ATPase ring; and Rpn1 and Rpn2, the largest proteasome subunits, are linked by an extended connection. The structural features of the 26S proteasome observed in this study are likely to be important for coordinating the proteasomal subunits during substrate processing.
The 26S proteasome is an ATP-dependent multisubunit protease degrading polyubiquitylated proteins (1, 2). It operates at the executive end of the Ubiquitin-Proteasome System (UPS) and has a key role in cellular proteostasis. The 26S proteasome selectively removes misfolded proteins or proteins no longer needed and it is critically involved in numerous cellular processes such as protein quality control, regulation of metabolism, cell cycle control, or antigen presentation. Malfunctions of the UPS are associated with various pathologies, including neurodegenerative diseases and cancer. Therefore, the proteasome is an important pharmaceutical target, and a high-resolution structure is a prerequisite for structure-based drug design (3).
The 26S proteasome comprises the 20S cylindrical core particle (CP), where proteolysis takes place, and 19S regulatory particles (RPs). In cellular environments, 26S holocomplexes with either one or two RPs bound to the ends of the cylinder-shaped CP coexist (4). The role of the RPs is to recruit ubiquitylated substrates, to cleave off their polyubiquitin tags, and to unfold and translocate them into the CP for degradation into short peptides. Whereas X-ray crystallography has revealed the atomic structures first of archaeal 20S proteasome (5) and subsequently of the yeast (6) and mammalian proteasome (7), only lower-resolution structures were available for the 26S holocomplex. Given the compositional and conformational heterogeneity of the RP, single-particle cryo-electron microscopy (cryo-EM) has been the most successful approach to determining the structure of the 26S holocomplex (8). At this point, the most detailed insights have been obtained for the yeast 26S proteasome (9–13), allowing model building to be accurate on the secondary structure level. Single-particle cryo-EM studies of the isolated RP lid subcomplex surpassed 4 Å resolution in some structurally invariable segments, allowing for more accurate model building for the corresponding areas (14). However, the structure of the 26S holocomplex has not been resolved at the same level of detail.
The consensus of the cryo-EM studies of the yeast 26S proteasome is that the motor core of the RP is a ring-shaped heterohexameric AAA+ (ATPase Associated with diverse Activities) ATPase, which binds to the CP. Depending on their nucleotide-bound states, the six different RP Triple-A ATPase (Rpt) subunits 1–6 adopt different conformations, which induce changes in the organization of the surrounding RP Non-ATPases (Rpns) (11, 15, 16). At least three distinct conformational states, s1–s3, underlie the three key steps of the functional cycle: substrate recruitment, irreversible commitment, and enzymatic processing. These different functions have been inferred from the different placements of ubiquitin receptors [Rpn1 (17), Rpn10 (18), and Rpn13 (19)] and the activation of the deubiquitylating enzyme (DUB) Rpn11 (20, 21), which is positioned near the mouth of the ATPase module. Two of the conformations observed in vitro, the recruitment and processing states s1 and s3, respectively, could also be observed in situ, albeit at lower resolutions by cryo-electron tomography studies (4).
Hitherto, only a medium-resolution structure of the human 26S proteasome was available, which suggested differences in the placement of some subunits in mammals compared with yeast (22). Here, we report an atomic model of the complete human 26S proteasome in the substrate-recruiting state s1 based on a 3.9-Å resolution cryo-EM map. The availability of an atomic structure now allows to scrutinize potential differences between yeast and human proteasomes and provides insights into nucleotide binding.
Results and Discussion
Isolation of Human 26S Proteasomes.
Human 26S proteasomes were purified from erythrocytes essentially as previously described (23). The stoichiometry of proteasome subunits in the sample was analyzed by mass spectrometry in conjunction with intensity-based absolute quantification (iBAQ) (24). All canonical subunits of the CP (α1–α7, β1–β7) and the RP (Rpt1–6, Rpn1–3, Rpn5–12) are present in approximately equimolar amounts, with the exception of Rpn13. Rpn13, which is present in stoichiometric amounts in yeast, has also been found in previous studies to be essentially absent in isolated human 26S proteasomes (25). It is likely that substoichiometrically bound Rpn13 dissociates from the 26S proteasome during the isolation process because cryo-electron tomography studies of 26S proteasomes in rat neurons also indicated a substoichiometric occupancy for this proteasome component (4).
Human 26S Proteasome EM Map at 3.9-Å Resolution.
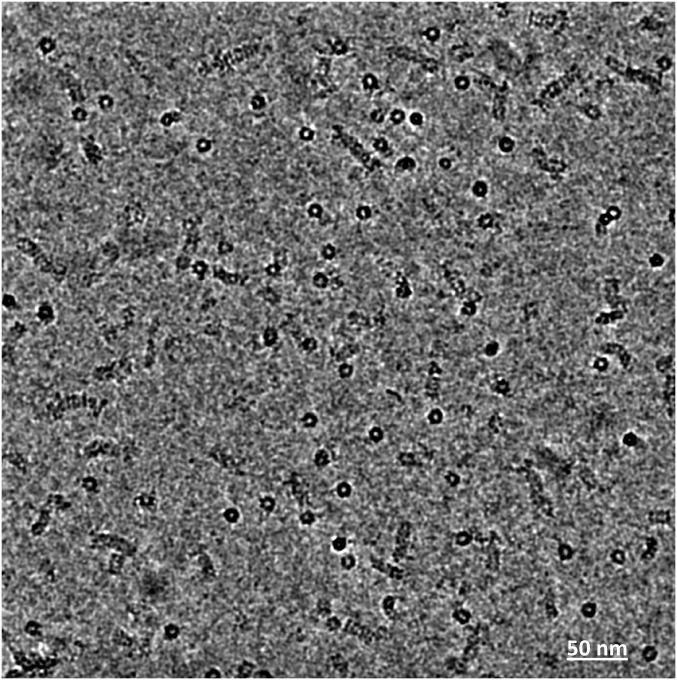
The isolated human 26S proteasomes in an ATP-containing buffer were vitrified and imaged using a FEI Krios transmission electron microscope (TEM) equipped with a Falcon III direct electron detector. In the resulting micrographs (Fig. S1) the more abundant double capped (dc) 26S and the less abundant single capped (sc) 26S particles were automatically detected and subjected to single-particle analysis. Previous structural analysis of yeast dc26S particles indicated that their two RPs can adopt different uncorrelated conformational states (11, 13, 15). To “purify” a specific conformation in silico, the dc26S particles were separated into two pseudoparticles that were processed independently (Material and Methods). The overall reconstructions of both dc26S and sc26S particles showed a s1-like conformation of the RPs (Fig. S2), indicating that the majority of RPs adopt this conformation. Therefore, particles in other states were discarded after 3D classification, which was performed focused on one RP.
Fig. S1.
Representative cryo-EM image of human 26S proteasome dataset. For better visibility the image has been low-pass-filtered to a 0.3-nm resolution. (Scale bar, 50 nm.)
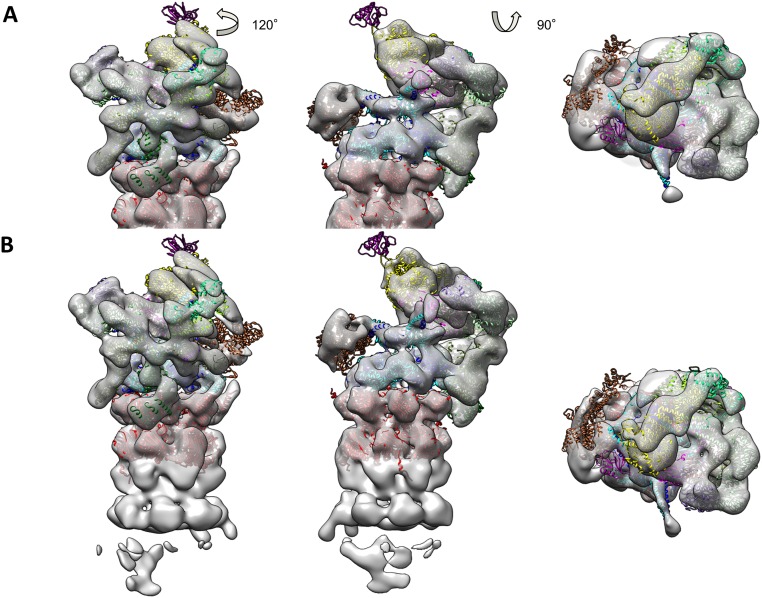
Fig. S2.
Superposition of atomic model of yeast s1 state on reconstructions of human 26S proteasome. (A) Yeast s1 atomic model (PDB ID code 4cr2) superposed on one-half of the C2-symmetrical reconstruction from dc26S particles (60). (B) Yeast s1 atomic model superposed on C1-reconstruction from sc26S particles.
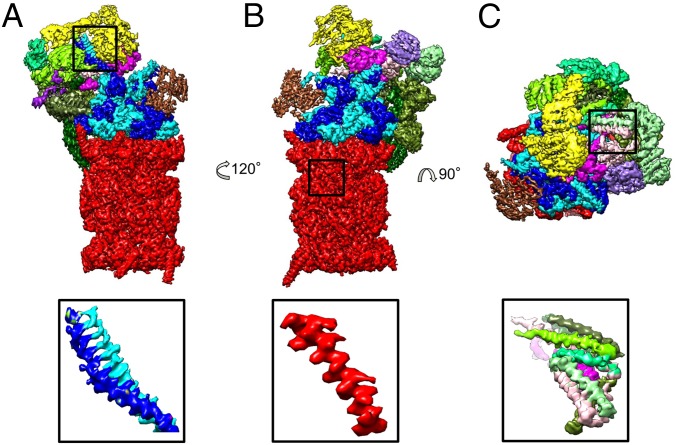
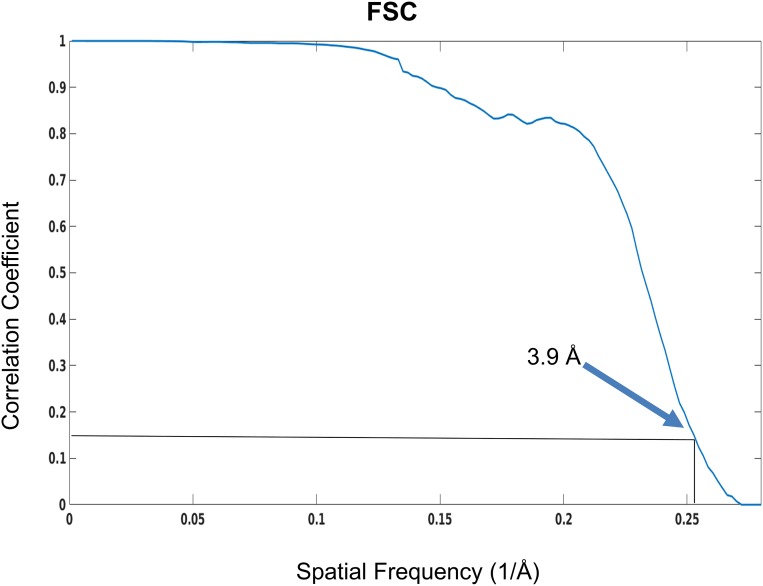
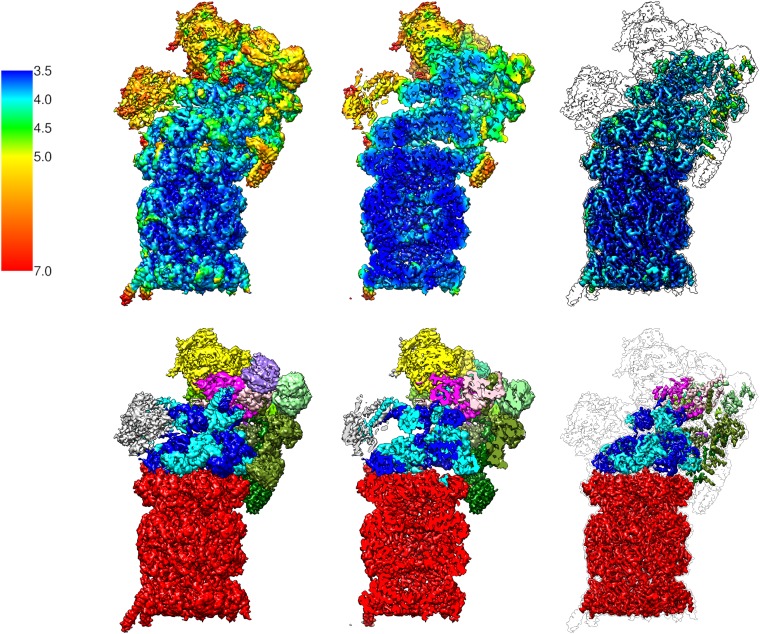
In a final step the 393,936 pseudosc26S particles and the 67,466 sc26S particles were merged and locally refined around the input angles provided as prior values with a soft-edged mask on one RP and the CP, yielding a refined reconstruction with an average resolution of 3.9 Å (Fig. 1 and Fig. S3). Local resolution determination indicated that the resolution is significantly better in the CP, the AAA-ATPase, and the helical bundle of the lid (Figs. S4 and S5).
Fig. 1.
Cryo-EM reconstruction of the human 26S proteasome at 3.9 Å resolution. (A–C) Three different views of the 26S proteasome colored according to its subunits. Red: CP; blue: AAA-ATPase heterohexamer; brown: Rpn1; yellow: Rpn2; green: PCI subunits (Rpn3, -5, -6, -7, -9, -12); magenta: Rpn8, -11; purple: Rpn10. (Bottom) Selected, magnified features (coiled-coil Rpt3/6, helix formed by residues 57–80 of β1, a helical bundle from the lid subcomplex) from the marked areas.
Fig. S3.
Resolution of reconstruction of human 26S proteasome. The FSC of two halves of the data that are independently aligned and reconstructed indicates an average resolution of 3.9 Å according to the FSC = 0.143 criterion.
Fig. S4.
Local resolution of EM map of human 26S proteasome. (Top, Left) The 26S proteasome isosurface rendering colored according to the local resolution (color bar: local resolution in Å). (Top, Center) Same as cut-open view. (Top, Right) Isosurface rendering at higher density value encapsulates only the highest resolution parts. The surroundings of the isosurface at lower density value are indicated. (Bottom, Left) Isosurface colored by subunit (red: CP; blue: AAA-ATPase heterohexamer; gray: Rpn1; yellow: Rpn2; green: Rpn3,- 5, -6, -7, -9, -12; magenta: Rpn8, -11; purple: Rpn10). (Bottom, Center) Cut-open view. (Bottom, Right) Isosurface rendering at higher density value.
Fig. S5.
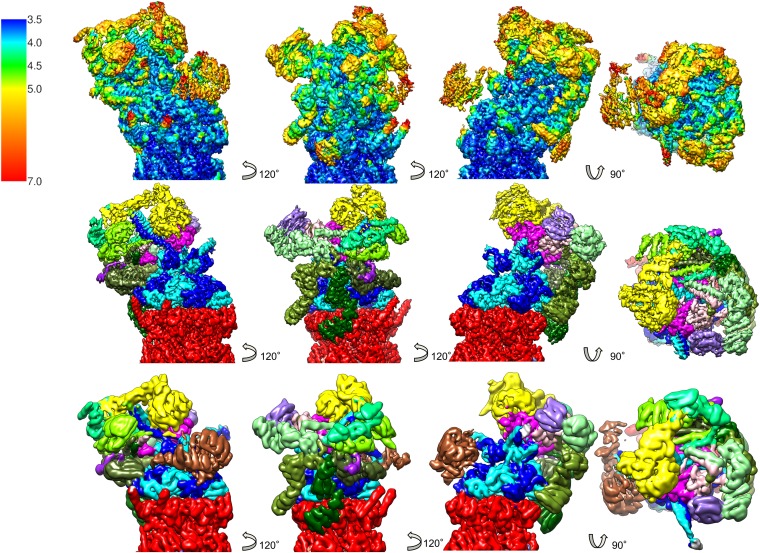
Reconstruction at different resolutions. (Top) Reconstruction of the human 26S proteasome rendered at 3.9 Å resolution and colored according to local resolution. (Center) Same colored by subunits (see Fig. S4 for color code). (Bottom) Reconstruction rendered at 7.7 Å.
Evolutionary Conservation of 26S Proteasome from Yeast to Humans.
To interpret the EM map of the human 26S proteasome in the s1 state, we first fitted the s1 atomic model of the yeast 26S proteasome (11) into the human 26S map (Fig. S2). The excellent fit of the overall subunit structures and even their secondary structures indicates that the structure of the 26S proteasome is highly conserved from yeast to humans, which is consistent with the high sequence conservation of RP subunits (>30% almost throughout). The conserved 26S proteasome architecture does not confirm differences between the human 26S proteasome and the yeast structures as suggested previously (22). In particular, the locations of Rpn12 and Rpn8, which were postulated to locate to different positions, clearly remain largely invariant. The different RP architecture in ref. 22 is likely an artifact of an overestimation of the resolution, which resulted in misinterpretation of the map, as previously suggested (26).
Atomic Structure.
To build an accurate atomic model of the human 26S proteasome, we followed the strategy established for large macromolecular complexes (27, 28). We first built comparative models of the human 26S proteasome subunits, extended template-free segments by de novo modeling, and superposed these human subunit models onto their respective yeast homologs. Although this initial model for the RP is largely accurate on the secondary structure level, it shows significant inaccuracies beyond, such as register shifts in helices and mispositioned loops, as it was derived from medium resolution cryo-EM data (7.7 Å) (11). Thus, differences of the atomic models of the yeast and the human 26S proteasome may reflect both interspecies variation and modeling errors. However, throughout the entire map the secondary structure elements like α-helices could be detected for all RP subunits, although with different accuracy depending on the resolution. In particular within the higher resolved regions (<4 Å) of the map such as the CP, the AAA-ATPase, and the helical bundle, the starts and ends of secondary structure elements could be clearly positioned due to the unambiguous fitting of side chains.
CP and CP-AAA Interface.
The refined structure of the CP displays only minor differences compared with the bovine CP crystal structure (7). Although this conservation is inconsistent with previous low-resolution negative-stain EM analysis of the human proteasome (29), it agrees with the intermediate-resolution cryo-EM studies of the yeast 26S proteasome (9–13). Most notably, the “gate” at the entrance of the CP formed by the N termini of the α-subunits is closed as observed also in the crystal structure.
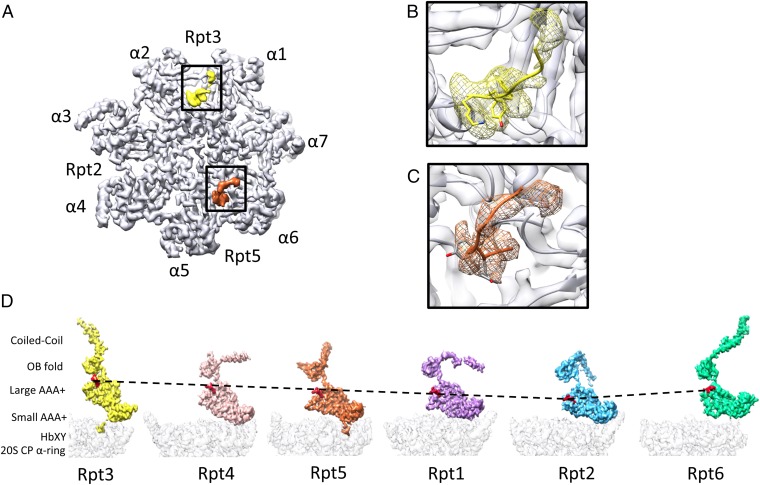
Three of the six AAA-ATPases (Rpt2, Rpt3, and Rpt5) share a C-terminal motif, a hydrophobic residue (Hb), and a tyrosine followed by a residue of any type (HbYX), which can bind to pockets in the CP (30). In the EM map, the C termini of Rpt3 and Rpt5 are clearly resolved, making it possible to discern bulky side chains (Fig. 2). In contrast, the C terminus of Rpt2 is not visible, indicating structural flexibility. Also for the yeast 26S proteasome, flexibility of one Rpt C terminus has been observed, but it has been the Rpt5 HbYX motif (13, 31). At this point we can only hypothesize why only two of three HbYX motifs bind to CP pockets in the s1 conformation of the 26S proteasome. An unbound third C terminus may facilitate rotary and lateral motion of the AAA module on the α-ring during the conformational changes of the 26S proteasome (11).
Fig. 2.
Organization of AAA module. (A) Segmented HbXY motifs of Rpt3 (yellow) and Rpt5 (organge) located in their binding pockets of the α-ring. (B) Cryo-EM–based atomic model of the Rpt3 HbXY motif in the pocket formed by α1 and α7. (C) Atomic model of the Rpt5 HbXY motif in the pocket formed by α5 and α6. (D) Segmented densities of the Rpt subunits successively rotated in 60° steps around the CP axis. The different structural domains are indicated on the left. The Ar-Φ pore loops are rendered in red.
Organization of Rpts in Heterohexamer.
In the yeast 26S proteasome the Rpt subunits assemble as an asymmetrical “split washer” in the hexamer (10). A consequence of this organization is that the aromatic hydrophobic (Ar-Φ) “pore loops,” which project into the central pore of the heterohexamer, arrange in a spiral staircase. These pore loops are thought to pull the substrate into the CP (32).
Although in previous intermediate-resolution studies of the yeast 26S proteasome the precise position of the Ar-Φ pore loops has been inferred from the fitted structures of Rpt homologs, the high-resolution map of the human 26S proteasome now reveals the proteasomal Ar-Φ pore loops directly (Fig. 2D). Five of the six Ar-Φ pore loops position remarkably accuractely on a spiral staircase (Rpt3, -4, -5, -1, and -2, ordered by decreasing elevation), whereas the corresponding segment of Rpt6 is positioned in between.
Nucleotide Loading of AAA-ATPase Module.
AAA-ATPases bind nucleotides through a site formed by the Walker A and Walker B motifs located in the large AAA subdomain (33). In many AAA-ATPases, ATP binding is further stabilized by an arginine (Arg) finger located in the AAA chain that is positioned adjacent in the hexameric ring. In the case of the Rpts, as with essentially all proteins of the classical AAA clade of the AAA+ protein family, this motif even contains two arginine residues. A consequence of the split washer organization is that only five of the six Arg–finger motifs can be engaged; the Arg–finger of Rpt3 cannot point into the binding site of Rpt6 (16).
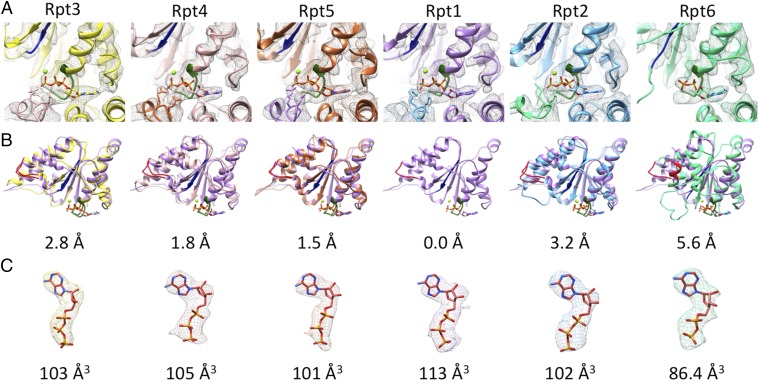
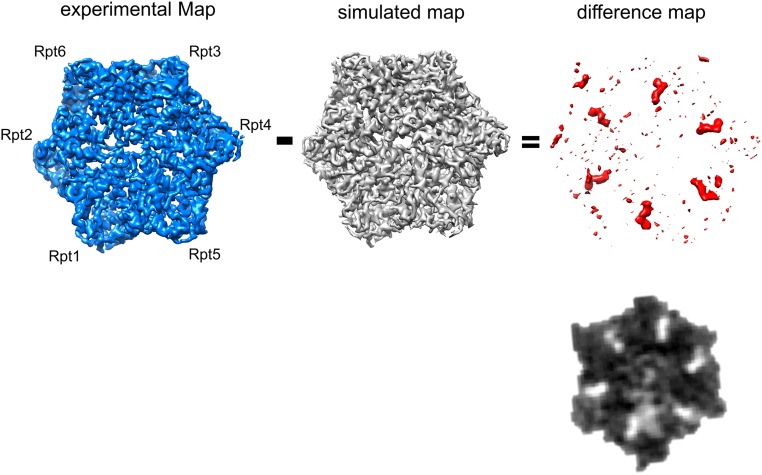
Inspection of the cryo-EM density at the nucleotide-binding sites clearly shows nucleotide binding to each Rpt subunit, which is also apparent in the difference map of the map and the modeled protein (Fig. 3 and Fig. S6). The nucleotide density bound to Rpt6 is the smallest and can be assigned unambiguously to ADP (Fig. 3C). For Rpt6, the Arg–finger is not engaged in the s1 state (16), which is compatible with ADP binding (Fig. 3 A and B). The other five nucleotides are notably larger than that bound to Rpt6, and the binding of the two Arg–fingers can be clearly observed. We tentatively assigned those to ATP, but it could also be the ADP-Pi intermediate-state or an overlay of ADP- and ATP-bound structures. Higher-resolution reconstructions will be required to make this assignment unambiguous.
Fig. 3.
Nucleotide binding and structures of large AAA subdomains. (A) Nucleotide densities and coordinated Mg2+ and Arg–fingers of the neighboring subunits at the Walker A motifs (green) of the Rpts. (B) Structural comparison of the large AAA+ domain of each Rpt with Rpt1 (Walker A green, Walker B dark blue, pore loop red). Below each panel the root mean squared deviation of the respective structure compared with Rpt1 in angstroms is assigned. (C) EM densities of bound nucleotides and modeled nucleotides. Below each panel the volume of the difference map in Å3 (cubic Angstroms) is shown.
Fig. S6.
Visualization of nucleotides in EM density. (Top) Subtraction of the polypeptide density (simulated from atomic model) from the EM data yields the density corresponding to the nucleotides shown as isosurface and gray values (Bottom).
Full occupancy of nucleotides has previously been observed in crystal structures of some prokaryotic homologs of the Rpts. However, these fully loaded states have been considered unphysiological, and mechanistic models for ATPase function rather assume a maximum occupancy of four nucleotides in solution (34, 35). Thus, the nucleotide occupancy found in our study for the 26S proteasome in the presence of an excess of ATP indicates either that these models must be revisited or that the mechanism of the 26S proteasome deviates from its simpler prokaryotic counterparts.
Structural Features of Rpts.
The high resolution throughout the entire AAA module allows the building of a complete atomic model with high confidence (Fig. 3). Interestingly, none of the Rpts shares the β-strand positioned at the N terminus of the crystal structure of the AAA domain of the archaeal Rpt homolog PAN (36). In the Rpts, the corresponding segment forms a short helix or a loop (Rpt3). It is possible that the strand formation and its integration into the adjacent β-sheet in PAN is due to truncation in the crystal structure of the large AAA subdomain of PAN (36).
Comparison of the large Rpt AAA subdomains reveals that the structures of Rpt1–5 are relatively similar, but Rpt6 deviates notably (Fig. 3B). The most striking difference is that the Ar-Φ pore loop of Rpt6 orients differently and adopts a partially helical fold. This helix has pronounced hydrophobic contacts to the small helix at the N terminus at the large AAA subdomain (Leu219-Val140, Val220-Leu137, Phe223-Pro133). The Rpt6 pore loop does not protrude into the pore, which is consistent with Rpt6 not being part of the spiral staircase formed by the other five Ar-Φ pore loops. Further high-resolution studies of the substrate processing state of the AAA module will be required to address to what extent the unique structure of Rpt6 is mostly due to its sequence or its nucleotide-bound state.
Organization of the RP Base Subcomplex.
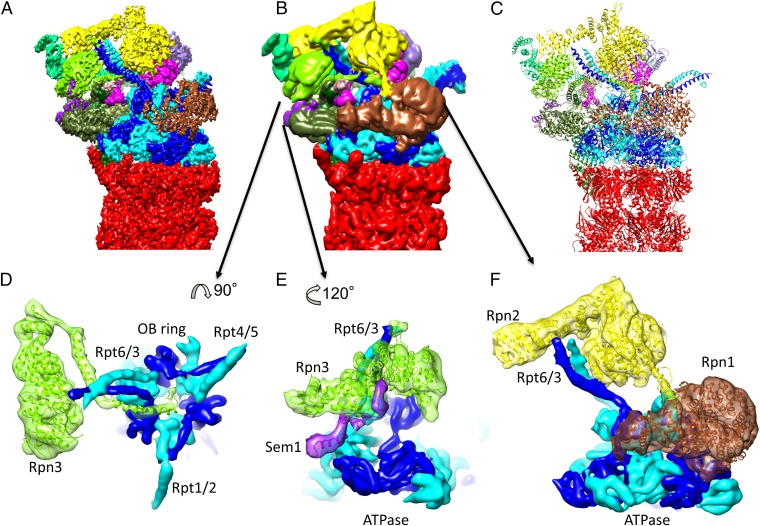
In addition to the six Rpts of the RP, the high-resolution map also allowed modeling the Rpns almost completely (Fig. 4). The resulting structure is highly similar to that observed in the yeast 26S proteasome (8). The RP consists of two independently assembling subcomplexes, the base and the lid (37). The base consists of the Rpts and two non-ATPases: the two largest, structurally related RP subunits Rpn1 and Rpn2. Rpn1 serves as a ubiquitin receptor (17), whereas Rpn2 seems to function solely as a lid-binding scaffold. Rpn1 associates with Rpt1/2 and is the structurally most variable subunit of the RP (Fig. S4). In all intermediate-resolution reconstructions of the yeast 26S proteasome, Rpn1 was completely separate from the other Rpns. Low-pass filtering of our high-resolution map reveals a newly observed connection between Rpn1 and Rpn2 (Fig. 4F). This connection is likely achieved through a helix in Rpn2 ranging approximately from Glu826 to Glu852, which is located at the interface of the N-terminal helix of Rpt2 (Gln57 to Pro87) and Rpn1. The described insertion of Rpn2 connecting Rpn2 with Rpn1 and Rpt2 may facilitate coordination of rotational motions of Rpn1 and all other Rpns during transition from the s1 state to the s2 and s3 conformations (11).
Fig. 4.
Organization of Rpns and previously unresolved features. (A) Reconstruction filtered to 4 Å resolution and colored according to subunits. (B) Reconstruction filtered to 7 Å resolution and colored according to subunits. (C) Atomic model colored according to subunits. (D) Obstruction of OB ring by C terminus of Rpn3. (E) Interaction of Sem1 and Rpn3. (F) Connecting density between Rpn1 and Rpn2.
Structure of the Lid Subcomplex.
The lid consists of a heterohexameric horseshoe of the structurally similar Proteasome-Cyclosome-Initiation factor (PCI) subunits Rpn9, -5, -6, -7, -3, and -12. The small lid subunit Rpn15/Dss1, which was recently suggested to function as a ubiquitin receptor (38), is positioned between Rpn7 and Rpn3 (Fig. 4E) (14, 39). The lid shields the Rpn8/11 heterodimer, which projects the active site of Rpn11 near the mouth of the AAA module.
As previously observed for the isolated yeast lid (14), the best-resolved (better than 4 Å) and hence least flexible part of the lid is the helical bundle formed by the C-terminal segments of the lid subunits (Fig. 1 and Figs. S4 and S5). The C terminus of Rpn3, however, could not be resolved in the isolated lid. In the human 26S holocomplex we could trace it parallel to the Rpt3/6 coiled coil into the mouth of the oligosaccharide binding (OB) fold ring of the AAA module (Fig. 4D). We have previously proposed that this cavity forms a composite active site where substrate deubiquitylation and unfolding occurs (40). The Rpn3 C terminus may be a sensor for substrates engaged in the OB mouth that initiates conformational changes of the lid for activation of Rpn11 and hence the composite active site (15, 16). Consistent with this hypothesis, Rpn3 is located in proximal distance to the region in Rpn11 (Ile163 to His199), which we previously suggested to function as a trigger for substrate recognition (40). This region is not resolved in X-ray structures of the isolated Rpn8/Rpn11 dimer (40, 41), indicating that it is flexible in this context. In the 26S holocomplex this region is resolved and hence stabilized by Rpn2 and Rpn3.
Conclusions.
The high-resolution structure of the human proteasome determined in this study reveals many details that are essential for its cellular function. This structure may serve as a starting point for future structure-guided drug discovery. AAA-ATPases have recently emerged as enzymes that can be allosterically inhibited (42). For example, Rpt6, by virtue of its unique structure and distinguished role in the AAA-heterohexamer, is a possible target for a specific pharmacological agent.
Materials and Methods
26S Proteasome Purification and Characterization.
Human 26S proteasomes were prepared from fresh human blood (23) and characterized using mass spectrometry (SI Materials and Methods). Samples of ∼0.5 mg/mL were quickly frozen for storage at −80 °C until use.
Data Acquisition.
The dataset was collected on a Titan Krios with a Falcon III camera in movie mode using the FEI EPU software at a pixel size of 1.35 Å at the specimen level (SI Materials and Methods).
Image Processing.
Both sc26S and dc26S particles were used to obtain the final 3.9-Å resolution reconstruction (SI Materials and Methods and Fig. S7). Essentially all image processing steps were carried out in TOM (43) and RELION (44).
Fig. S7.
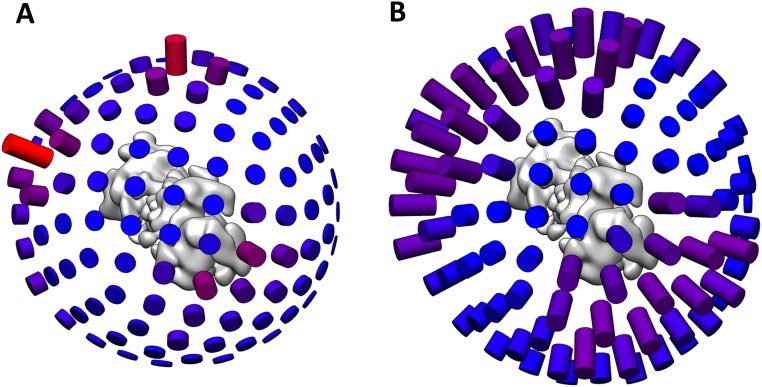
Orientation distribution of 26S particles. (A) Initial angular distribution. (B) Angular distribution after reduction of particle numbers in highly populated orientation classes.
Model Building.
Initial models were obtained by comparative and de novo modeling (SI Materials and Methods). The human 26S proteasome subunits were positioned into the EM map according to their positions of the yeast homologs [PDB ID code 4cr2 (11)] and subsequently refined, first in real space using molecular dynamics flexible fitting (MDFF) (45) and then in reciprocal space. MDFF simulations were prepared using QwikMD (46), analyzed with VMD (47), and carried out with NAMD (48).
SI Materials and Methods
26S Proteasome Purification and Characterization.
Fresh human blood from a healthy donor was collected under medical supervision in the presence of 1.8 mg/mL EDTA. The blood sample was washed three times with PBS containing 5 mM glucose (23). Cooled cells were lysed for 30 min with pure water containing ATP, MgCl2, and β-mercaptoethanol in 8 vol of the initial cell pellet. After lysis the crude cell extract was filled up with water, glycerol, and Tris⋅HCl (pH 7.5–10) volumes of the initial cell pellet to a final concentration of 50 mM Tris⋅HCl pH 7.5, 10% (wt/vol) glycerol, 10 mM MgCl2, 5 mM ATP, and 10 mM β-mercaptoethanol. The crude cell extract was centrifuged at 31,000 × g for 10 min to remove cell debris, and the supernatant was centrifuged again at 100,000 × g for 30 min to pellet cell membranes. Solid ammonium sulfate was added to the supernatant to 40% saturation, and the precipitated material was collected by centrifugation at 31,000 × g for 15 min. The pellet was resuspended in Buffer A [20 mM Tris⋅HCl, pH 7.5, at 21 °C, 10% (wt/vol) glycerol, 10 mM β-mercaptoethanol, 5 mM ATP, 10 mM MgCl2] and centrifuged again at 31,000 × g for 5 min to remove insoluble precipitate. The 26S proteasome was then pelletized at 160,000 × g for 131 min. The supernatant was discarded and the pellet redissolved in Buffer A and pelletized again at 160,000 × g for 131 min. The supernatant was removed and the pellet was redissolved in a minimal volume of Buffer A and centrifuged at 20,000 × g for 1 min to remove insoluble protein. The sample was subjected to preparative sucrose density gradient centrifugation. Gradients were 20–40% (wt/vol) sucrose in Buffer B (20 mM Tris⋅HCl, pH 7.5, at 21 °C, 10 mM β-mercaptoethanol, 5 mM ATP, 10 mM MgCl2; 10 mM creatine phosphate, 0.03 mg/mL creatine kinase) and centrifuged for 17 h at 208,000 × g in a Beckman SW41 rotor. Fractions with 26S proteasome activity were determined by hydrolysis of Suc-Leu-Leu-Val-Tyr-AMC, and 26S proteasome protein was determined by Coomassie blue staining of SDS/PAGE. To estimate the subunit abundance, the sample was subjected to mass spectrometry analysis and label-free quantification according to the iBAQ value (49, 50). Samples of ∼0.5 mg/mL were quickly frozen for storage at −80 °C until use.
Data Acquisition.
Data acquisition was performed essentially as described (51). In brief, the dataset was collected on a Titan Krios with a Falcon III camera using the FEI EPU software. Images were acquired at a pixel size of 1.35 Å at specimen level, a total dose of 45 electrons distributed over 50 frames, and a nominal defocus varying from 0.8 to 3 μm. Typically, the majority of particles on the micrographs were dc26S particles, but some sc26S as well as isolated CPs were additionally found.
Image Processing.
In a first step, the acquired micrograph frames were translationally aligned and summed using an in-house implementation of the algorithm from (52). Both the aligned frame stacks and the summed images were saved for further use. In the next step, the summed images were used for contrast transfer function (CTF) estimation in CTFFIND3 (53). Only images with a CTF fit score above 0.05 and a defocus inside the range of 0.8–3.5 μm were retained for further analysis. This procedure resulted in a dataset of 40,211 images, subsequently subjected to automated particle localization implemented in the TOM package as described previously (13). Then reference-free 2D classification in RELION (44) was applied to filter out low-quality particles and to separate a total of 458,052 dc26S and 230,690 sc26S particles. These particles were extracted at a square size of 384 pixels at full size (pixel size: 1.35 Å) and at a reduced size of 256 pixels (pixel size: 2.03 Å). During all of the following processing steps the reduced sized particles were used except for the particle polishing and refinement.
The dc26S particles were aligned in RELION with applied C2 symmetry. The result indicated an uneven angular distribution (Fig. S7). To decrease the size of the dataset, angular classes with an above-average occupancy were reduced to the mean occupancy by discarding those particles that score worst in terms of the _rlnMaxValueProbDistribution value in RELION, which is a measure for the reliability of the (angular) class assignment of a particle. Evaluation on a subset of initially 183,000 particles showed only a minor decrease in resolution after data reduction. The remaining 267,660 particles were divided into two random subsets for refinement and particle polishing in RELION (54).
In a next step the broken C2 symmetry was addressed as described (11). In this procedure, the two RPs of one dc26S particle were effectively treated as separate particles during image processing; the resulting 535,320 pseudosc26S particles were processed separately by focusing the analysis on a single RP and restricting the angular search range. First, the pseudoparticles were classified into 10 classes in RELION for 34 iterations using a soft-edged spherical mask on the RP region, keeping the previously assigned angles constant. Of the 10 resulting reconstructions 4 were in a well-defined s1-like state, comprising 431,141 RPs. These pseudosc26S particles were subjected to a second round of 3D classification, yielding only one well-defined reconstruction among the 10 classes, which contained over 80% of the particles (361,475 pseudosc26S particles). These particles were chosen for refinement, performed in RELION with a soft-edged mask containing one RP and half of the CP and a local angular search around the initial angles provided as prior values. The resolution of the postprocessed map with the mask used for refinement was 4.1 Å. The sc26S particles were processed similarly as the dc26S particles. After an initial alignment the number of particles was reduced as described above for the dc26S particles. The remaining 128,741 particles were refined and polished in RELION, followed by two runs of 3D classification with a global angular search. The classification procedure identified 67,466 sc26S particles in an s1-like state and 16,840 previously wrongly classified dc26S particles (dc*). The s1-like sc26S particles were refined with a full angular search using the reconstruction resulting from the final refinement of the dc26S particles as an initial reference, resulting in a resolution of 4.8 Å. The dc* particles were refined by applying C2 symmetry, followed by a separation of the RPs into 33,680 pseudosc26S particles. A subsequent step of classification under the same conditions as for the dc26S particles identified 32,461 good s1-like pseudosc26S particles, which were then refined locally onto the final reconstruction of the dc26S particles using a soft-edged mask containing one RP and half of the CP.
The 393,936 pseudosc26S particles from dc26S and dc26S* particles and the 67,466 sc26S particles were merged and locally refined around the input angles provided as prior values with a soft-edged mask on one RP and the CP, leading to a refined reconstruction with an average resolution of 3.9 Å according to Fourier shell correlation. Local resolution determination was determined by B-soft (55).
Model Building.
The precise voxel size of the single-particle reconstruction was determined by a cross-correlation analysis in the University of California at San Francisco Chimera (56), maximizing the fit of the 2.6-Å resolution human CP crystal structure [Protein Data Bank (PDB) ID code 4R3O (57)] for different voxel sizes. This atomic model of the human constitutive 20S proteasome was also used as an initial model for the CP.
The initial model for the RP of the human 26S proteasome was built through comparative modeling using Modeler (58). The RP of the yeast 26S proteasome [PDB ID code 4CR2 (11)] was used as a template, and in the Modeller-implemented alignment scheme was used for sequence alignment. For Rpn1 and Rpn2, the X-ray structure of the isolated yeast Rpn2 [PDB ID code 4ADY (59)] was used as an additional template. Missing segments in the template or sequence regions with a sequence identity lower than 30% were predicted following the de novo structure prediction protocol of Rosetta (60). These missing segments were furnished based on a local fragment library of solved models within the Protein Data Bank. A Metropolis Monte Carlo integration of simulated annealing, guided by a knowledge-based scoring function, was used to exchange and place these fragments into partial models (61).
The RP of the obtained homology model was aligned with the density by superimposing the CP of the yeast 26S proteasome (PDB ID code 4CR2) with the human CP crystal structure (PDB ID code 4R3O) already docked into the density. The human CP and RP models were combined and then fitted into the density using MDFF (45, 62), which employs molecular dynamics to fit initial models into a density in real space and thus permits protein flexibility while maintaining realistic protein conformations. MDFF runs were prepared with QwikMD (46) and analyzed using the MDFF graphical user interface of VMD (47). We used NAMD (48) with the correction map (CMAP)-corrected CHARMM22 force field (63) for conducting MDFF. During MDFF runs, restraints to preserve the secondary structure, chirality, and cis-peptide bonds were applied to avoid overfitting. We used cascade MDFF starting with a density filtered to 7-Å resolution and a grid coupling of 0.3 followed by runs with the 3.9-Å resolution map, increasing the grid coupling up to 1. The coupling of the model to the density was weighted according to the local resolution of the density.
The quality of fit of the secondary structure element was checked through local cross-correlation calculation (64) implemented in VMD. The identified segments of the model that clearly deviated from the density were adapted to the density by combining Rosetta’s FastRelax algorithm (65) with MDFF in an iterative way following a similar strategy as described (66). The FastRelax algorithm optimizes the model by applying a gradient minimization to all torsional degrees of freedom (ϕ, ψ, ω, and χ) followed by a simulated annealing rotamer search (61).
For further refinement of the atomic coordinates in reciprocal space, the EM map and the Fourier shell correlation (FSC) were converted into an MTZ file using the ban_mrc_to_mtz.py script (67). The atomic coordinates were then optimized against the Fourier coefficients using maximum-likelihood refinement in PHENIX (68). Differences between the refined model and the map were analyzed in COOT (69), and the model was adapted accordingly by the tools offered in COOT, followed by a second step of refinement in PHENIX, yielding the final model.
Acknowledgments
We thank Christopher Aylett for providing a script for conversion of EM density and Fourier shell correlation into MTZ files; Andreas Bracher for assistance with reciprocal space refinement; and Maximilian Scheurer for assistance with automating the real space refinement tools. The authors acknowledge the computer time provided by the National Science Foundation (NSF)-funded Extreme Science and Engineering Discovery Environment MCA93S028 and a Blue Waters Illinois allocation, which is part of the Blue Waters sustained-petascale computing project supported by the NSF (Awards OCI-0725070 and ACI-1238993) and the state of Illinois. This work was supported by the German Science Foundation (Excellence Cluster CIPSM and SFB-1035/Project A01); NSF Grant PHY1430124; and National Institutes of Health Grant 9P41GM104601. E.S. is supported by Marie Curie Career Integration Grant. T.R. acknowledges support as a Feodor Lynen von Humboldt Postdoctoral Fellow.
Footnotes
The authors declare no conflict of interest.
Data deposition: The single particle reconstruction and the atomic coordinates have been deposited in the Electron Microscopy Data Bank, www.ebi.ac.uk/pdbe/emdb/ (accession no. EMD-4002) and the Protein Data Bank, www.rcsb.org (PDB ID codes 5L4G and 5L4K), respectively.
This article contains supporting information online at www.pnas.org/lookup/suppl/doi:10.1073/pnas.1608050113/-/DCSupplemental.
References
- 1.Voges D, Zwickl P, Baumeister W. The 26S proteasome: A molecular machine designed for controlled proteolysis. Annu Rev Biochem. 1999;68:1015–1068. doi: 10.1146/annurev.biochem.68.1.1015. [DOI] [PubMed] [Google Scholar]
- 2.Finley D, Chen X, Walters KJ. Gates, channels, and switches: Elements of the proteasome machine. Trends Biochem Sci. 2016;41(1):77–93. doi: 10.1016/j.tibs.2015.10.009. [DOI] [PMC free article] [PubMed] [Google Scholar]
- 3.Śledź P, Baumeister W. Structure-driven developments of 26S proteasome inhibitors. Annu Rev Pharmacol Toxicol. 2016;56:191–209. doi: 10.1146/annurev-pharmtox-010814-124727. [DOI] [PubMed] [Google Scholar]
- 4.Asano S, et al. Proteasomes: A molecular census of 26S proteasomes in intact neurons. Science. 2015;347(6220):439–442. doi: 10.1126/science.1261197. [DOI] [PubMed] [Google Scholar]
- 5.Löwe J, et al. Crystal structure of the 20S proteasome from the archaeon T. acidophilum at 3.4 A resolution. Science. 1995;268(5210):533–539. doi: 10.1126/science.7725097. [DOI] [PubMed] [Google Scholar]
- 6.Groll M, et al. Structure of 20S proteasome from yeast at 2.4 A resolution. Nature. 1997;386(6624):463–471. doi: 10.1038/386463a0. [DOI] [PubMed] [Google Scholar]
- 7.Unno M, et al. The structure of the mammalian 20S proteasome at 2.75 A resolution. Structure. 2002;10(5):609–618. doi: 10.1016/s0969-2126(02)00748-7. [DOI] [PubMed] [Google Scholar]
- 8.Förster F, Unverdorben P, Sledź P, Baumeister W. Unveiling the long-held secrets of the 26S proteasome. Structure. 2013;21(9):1551–1562. doi: 10.1016/j.str.2013.08.010. [DOI] [PubMed] [Google Scholar]
- 9.Luan B, et al. Structure of an endogenous yeast 26S proteasome reveals two major conformational states. Proc Natl Acad Sci USA. 2016;113(10):2642–2647. doi: 10.1073/pnas.1601561113. [DOI] [PMC free article] [PubMed] [Google Scholar]
- 10.Lander GC, et al. Complete subunit architecture of the proteasome regulatory particle. Nature. 2012;482(7384):186–191. doi: 10.1038/nature10774. [DOI] [PMC free article] [PubMed] [Google Scholar]
- 11.Unverdorben P, et al. Deep classification of a large cryo-EM dataset defines the conformational landscape of the 26S proteasome. Proc Natl Acad Sci USA. 2014;111(15):5544–5549. doi: 10.1073/pnas.1403409111. [DOI] [PMC free article] [PubMed] [Google Scholar]
- 12.Lasker K, et al. Molecular architecture of the 26S proteasome holocomplex determined by an integrative approach. Proc Natl Acad Sci USA. 2012;109(5):1380–1387. doi: 10.1073/pnas.1120559109. [DOI] [PMC free article] [PubMed] [Google Scholar]
- 13.Beck F, et al. Near-atomic resolution structural model of the yeast 26S proteasome. Proc Natl Acad Sci USA. 2012;109(37):14870–14875. doi: 10.1073/pnas.1213333109. [DOI] [PMC free article] [PubMed] [Google Scholar]
- 14.Dambacher CM, Worden EJ, Herzik MA, Martin A, Lander GC. Atomic structure of the 26S proteasome lid reveals the mechanism of deubiquitinase inhibition. eLife. 2016;5:e13027. doi: 10.7554/eLife.13027. [DOI] [PMC free article] [PubMed] [Google Scholar]
- 15.Matyskiela ME, Lander GC, Martin A. Conformational switching of the 26S proteasome enables substrate degradation. Nat Struct Mol Biol. 2013;20(7):781–788. doi: 10.1038/nsmb.2616. [DOI] [PMC free article] [PubMed] [Google Scholar]
- 16.Śledź P, et al. Structure of the 26S proteasome with ATP-γS bound provides insights into the mechanism of nucleotide-dependent substrate translocation. Proc Natl Acad Sci USA. 2013;110(18):7264–7269. doi: 10.1073/pnas.1305782110. [DOI] [PMC free article] [PubMed] [Google Scholar]
- 17.Shi Y, et al. Rpn1 provides adjacent receptor sites for substrate binding and deubiquitination by the proteasome. Science. 2016;351(6275):831. doi: 10.1126/science.aad9421. [DOI] [PMC free article] [PubMed] [Google Scholar]
- 18.van Nocker S, et al. The multiubiquitin-chain-binding protein Mcb1 is a component of the 26S proteasome in Saccharomyces cerevisiae and plays a nonessential, substrate-specific role in protein turnover. Mol Cell Biol. 1996;16(11):6020–6028. doi: 10.1128/mcb.16.11.6020. [DOI] [PMC free article] [PubMed] [Google Scholar]
- 19.Husnjak K, et al. Proteasome subunit Rpn13 is a novel ubiquitin receptor. Nature. 2008;453(7194):481–488. doi: 10.1038/nature06926. [DOI] [PMC free article] [PubMed] [Google Scholar]
- 20.Yao T, Cohen RE. A cryptic protease couples deubiquitination and degradation by the proteasome. Nature. 2002;419(6905):403–407. doi: 10.1038/nature01071. [DOI] [PubMed] [Google Scholar]
- 21.Verma R, et al. Role of Rpn11 metalloprotease in deubiquitination and degradation by the 26S proteasome. Science. 2002;298(5593):611–615. doi: 10.1126/science.1075898. [DOI] [PubMed] [Google Scholar]
- 22.da Fonseca PC, He J, Morris EP. Molecular model of the human 26S proteasome. Mol Cell. 2012;46(1):54–66. doi: 10.1016/j.molcel.2012.03.026. [DOI] [PubMed] [Google Scholar]
- 23.Liu CW, et al. ATP binding and ATP hydrolysis play distinct roles in the function of 26S proteasome. Mol Cell. 2006;24(1):39–50. doi: 10.1016/j.molcel.2006.08.025. [DOI] [PMC free article] [PubMed] [Google Scholar]
- 24.Schwanhäusser B, et al. Global quantification of mammalian gene expression control. Nature. 2011;473(7347):337–342. doi: 10.1038/nature10098. [DOI] [PubMed] [Google Scholar]
- 25.Chen X, Lee BH, Finley D, Walters KJ. Structure of proteasome ubiquitin receptor hRpn13 and its activation by the scaffolding protein hRpn2. Mol Cell. 2010;38(3):404–415. doi: 10.1016/j.molcel.2010.04.019. [DOI] [PMC free article] [PubMed] [Google Scholar]
- 26.Lander GC, Martin A, Nogales E. The proteasome under the microscope: The regulatory particle in focus. Curr Opin Struct Biol. 2013;23(2):243–251. doi: 10.1016/j.sbi.2013.02.004. [DOI] [PMC free article] [PubMed] [Google Scholar]
- 27.Goh BC, et al. Computational methodologies for real-space structural refinement of large macromolecular complexes. Annu Rev Biophys. 2016;45:253–278. doi: 10.1146/annurev-biophys-062215-011113. [DOI] [PMC free article] [PubMed] [Google Scholar]
- 28.Perilla JR, et al. Molecular dynamics simulations of large macromolecular complexes. Curr Opin Struct Biol. 2015;31:64–74. doi: 10.1016/j.sbi.2015.03.007. [DOI] [PMC free article] [PubMed] [Google Scholar]
- 29.da Fonseca PC, Morris EP. Structure of the human 26S proteasome: Subunit radial displacements open the gate into the proteolytic core. J Biol Chem. 2008;283(34):23305–23314. doi: 10.1074/jbc.M802716200. [DOI] [PMC free article] [PubMed] [Google Scholar]
- 30.Smith DM, et al. Docking of the proteasomal ATPases’ carboxyl termini in the 20S proteasome’s alpha ring opens the gate for substrate entry. Mol Cell. 2007;27(5):731–744. doi: 10.1016/j.molcel.2007.06.033. [DOI] [PMC free article] [PubMed] [Google Scholar]
- 31.Tian G, et al. An asymmetric interface between the regulatory and core particles of the proteasome. Nat Struct Mol Biol. 2011;18(11):1259–1267. doi: 10.1038/nsmb.2147. [DOI] [PMC free article] [PubMed] [Google Scholar]
- 32.Nyquist K, Martin A. Marching to the beat of the ring: Polypeptide translocation by AAA+ proteases. Trends Biochem Sci. 2014;39(2):53–60. doi: 10.1016/j.tibs.2013.11.003. [DOI] [PMC free article] [PubMed] [Google Scholar]
- 33.Wendler P, Ciniawsky S, Kock M, Kube S. Structure and function of the AAA+ nucleotide binding pocket. Biochim Biophys Acta. 2012;1823(1):2–14. doi: 10.1016/j.bbamcr.2011.06.014. [DOI] [PubMed] [Google Scholar]
- 34.Sauer RT, Baker TA. AAA+ proteases: ATP-fueled machines of protein destruction. Annu Rev Biochem. 2011;80:587–612. doi: 10.1146/annurev-biochem-060408-172623. [DOI] [PubMed] [Google Scholar]
- 35.Smith DM, Fraga H, Reis C, Kafri G, Goldberg AL. ATP binds to proteasomal ATPases in pairs with distinct functional effects, implying an ordered reaction cycle. Cell. 2011;144(4):526–538. doi: 10.1016/j.cell.2011.02.005. [DOI] [PMC free article] [PubMed] [Google Scholar]
- 36.Zhang F, et al. Structural insights into the regulatory particle of the proteasome from Methanocaldococcus jannaschii. Mol Cell. 2009;34(4):473–484. doi: 10.1016/j.molcel.2009.04.021. [DOI] [PMC free article] [PubMed] [Google Scholar]
- 37.Glickman MH, et al. A subcomplex of the proteasome regulatory particle required for ubiquitin-conjugate degradation and related to the COP9-signalosome and eIF3. Cell. 1998;94(5):615–623. doi: 10.1016/s0092-8674(00)81603-7. [DOI] [PubMed] [Google Scholar]
- 38.Paraskevopoulos K, et al. Dss1 is a 26S proteasome ubiquitin receptor. Mol Cell. 2014;56(3):453–461. doi: 10.1016/j.molcel.2014.09.008. [DOI] [PMC free article] [PubMed] [Google Scholar]
- 39.Bohn S, et al. Localization of the regulatory particle subunit Sem1 in the 26S proteasome. Biochem Biophys Res Commun. 2013;435(2):250–254. doi: 10.1016/j.bbrc.2013.04.069. [DOI] [PubMed] [Google Scholar]
- 40.Pathare GR, et al. Crystal structure of the proteasomal deubiquitylation module Rpn8-Rpn11. Proc Natl Acad Sci USA. 2014;111(8):2984–2989. doi: 10.1073/pnas.1400546111. [DOI] [PMC free article] [PubMed] [Google Scholar]
- 41.Worden EJ, Padovani C, Martin A. Structure of the Rpn11-Rpn8 dimer reveals mechanisms of substrate deubiquitination during proteasomal degradation. Nat Struct Mol Biol. 2014;21(3):220–227. doi: 10.1038/nsmb.2771. [DOI] [PubMed] [Google Scholar]
- 42.Banerjee S, et al. 2.3 Å resolution cryo-EM structure of human p97 and mechanism of allosteric inhibition. Science. 2016;351(6275):871–875. doi: 10.1126/science.aad7974. [DOI] [PMC free article] [PubMed] [Google Scholar]
- 43.Nickell S, et al. TOM software toolbox: Acquisition and analysis for electron tomography. J Struct Biol. 2005;149(3):227–234. doi: 10.1016/j.jsb.2004.10.006. [DOI] [PubMed] [Google Scholar]
- 44.Scheres SH. RELION: Implementation of a Bayesian approach to cryo-EM structure determination. J Struct Biol. 2012;180(3):519–530. doi: 10.1016/j.jsb.2012.09.006. [DOI] [PMC free article] [PubMed] [Google Scholar]
- 45.Trabuco LG, Villa E, Schreiner E, Harrison CB, Schulten K. Molecular dynamics flexible fitting: A practical guide to combine cryo-electron microscopy and X-ray crystallography. Methods. 2009;49(2):174–180. doi: 10.1016/j.ymeth.2009.04.005. [DOI] [PMC free article] [PubMed] [Google Scholar]
- 46.Ribeiro JV, et al. QwikMD-Integrative Molecular Dynamics Toolkit for novices and experts. Sci Rep. 2016;6:26536–26540. doi: 10.1038/srep26536. [DOI] [PMC free article] [PubMed] [Google Scholar]
- 47.Humphrey W, Dalke A, Schulten K. VMD: Visual molecular dynamics. J Mol Graph. 1996;14(1):33–38, 27–28. doi: 10.1016/0263-7855(96)00018-5. [DOI] [PubMed] [Google Scholar]
- 48.Phillips JC, et al. Scalable molecular dynamics with NAMD. J Comput Chem. 2005;26(16):1781–1802. doi: 10.1002/jcc.20289. [DOI] [PMC free article] [PubMed] [Google Scholar]
- 49.Cox J, et al. Accurate proteome-wide label-free quantification by delayed normalization and maximal peptide ratio extraction, termed MaxLFQ. Mol Cell Proteomics. 2014;13(9):2513–2526. doi: 10.1074/mcp.M113.031591. [DOI] [PMC free article] [PubMed] [Google Scholar]
- 50.Steen H, Mann M. The ABC’s (and XYZ’s) of peptide sequencing. Nat Rev Mol Cell Biol. 2004;5(9):699–711. doi: 10.1038/nrm1468. [DOI] [PubMed] [Google Scholar]
- 51.Aufderheide A, et al. Structural characterization of the interaction of Ubp6 with the 26S proteasome. Proc Natl Acad Sci USA. 2015;112(28):8626–8631. doi: 10.1073/pnas.1510449112. [DOI] [PMC free article] [PubMed] [Google Scholar]
- 52.Li X, et al. Electron counting and beam-induced motion correction enable near-atomic-resolution single-particle cryo-EM. Nat Methods. 2013;10(6):584–590. doi: 10.1038/nmeth.2472. [DOI] [PMC free article] [PubMed] [Google Scholar]
- 53.Rohou A, Grigorieff N. CTFFIND4: Fast and accurate defocus estimation from electron micrographs. J Struct Biol. 2015;192(2):216–221. doi: 10.1016/j.jsb.2015.08.008. [DOI] [PMC free article] [PubMed] [Google Scholar]
- 54.Scheres SH. Beam-induced motion correction for sub-megadalton cryo-EM particles. eLife. 2014;3:e03665. doi: 10.7554/eLife.03665. [DOI] [PMC free article] [PubMed] [Google Scholar]
- 55.Cardone G, Heymann JB, Steven AC. One number does not fit all: Mapping local variations in resolution in cryo-EM reconstructions. J Struct Biol. 2013;184(2):226–236. doi: 10.1016/j.jsb.2013.08.002. [DOI] [PMC free article] [PubMed] [Google Scholar]
- 56.Goddard TD, Huang CC, Ferrin TE. Visualizing density maps with UCSF Chimera. J Struct Biol. 2007;157(1):281–287. doi: 10.1016/j.jsb.2006.06.010. [DOI] [PubMed] [Google Scholar]
- 57.Harshbarger W, Miller C, Diedrich C, Sacchettini J. Crystal structure of the human 20S proteasome in complex with carfilzomib. Structure. 2015;23(2):418–424. doi: 10.1016/j.str.2014.11.017. [DOI] [PubMed] [Google Scholar]
- 58.Sali A, Blundell TL. Comparative protein modelling by satisfaction of spatial restraints. J Mol Biol. 1993;234(3):779–815. doi: 10.1006/jmbi.1993.1626. [DOI] [PubMed] [Google Scholar]
- 59.He J, et al. The structure of the 26S proteasome subunit Rpn2 reveals its PC repeat domain as a closed toroid of two concentric α-helical rings. Structure. 2012;20(3):513–521. doi: 10.1016/j.str.2011.12.015. [DOI] [PubMed] [Google Scholar]
- 60.Leaver-Fay A, et al. ROSETTA3: An object-oriented software suite for the simulation and design of macromolecules. Methods Enzymol. 2011;487:545–574. doi: 10.1016/B978-0-12-381270-4.00019-6. [DOI] [PMC free article] [PubMed] [Google Scholar]
- 61.Kaufmann KW, Lemmon GH, Deluca SL, Sheehan JH, Meiler J. Practically useful: What the Rosetta protein modeling suite can do for you. Biochemistry. 2010;49(14):2987–2998. doi: 10.1021/bi902153g. [DOI] [PMC free article] [PubMed] [Google Scholar]
- 62.Trabuco LG, Villa E, Mitra K, Frank J, Schulten K. Flexible fitting of atomic structures into electron microscopy maps using molecular dynamics. Structure. 2008;16(5):673–683. doi: 10.1016/j.str.2008.03.005. [DOI] [PMC free article] [PubMed] [Google Scholar]
- 63.Mackerell AD, Jr, Feig M, Brooks CL., III Extending the treatment of backbone energetics in protein force fields: Limitations of gas-phase quantum mechanics in reproducing protein conformational distributions in molecular dynamics simulations. J Comput Chem. 2004;25(11):1400–1415. doi: 10.1002/jcc.20065. [DOI] [PubMed] [Google Scholar]
- 64.Stone JE, McGreevy R, Isralewitz B, Schulten K. GPU-accelerated analysis and visualization of large structures solved by molecular dynamics flexible fitting. Faraday Discuss. 2014;169:265–283. doi: 10.1039/c4fd00005f. [DOI] [PMC free article] [PubMed] [Google Scholar]
- 65.Tyka MD, et al. Alternate states of proteins revealed by detailed energy landscape mapping. J Mol Biol. 2011;405(2):607–618. doi: 10.1016/j.jmb.2010.11.008. [DOI] [PMC free article] [PubMed] [Google Scholar]
- 66.Lindert S, McCammon JA. Improved cryoEM-Guided Iterative Molecular Dynamics: Rosetta protein structure refinement protocol for high precision protein structure prediction. J Chem Theory Comput. 2015;11(3):1337–1346. doi: 10.1021/ct500995d. [DOI] [PMC free article] [PubMed] [Google Scholar]
- 67.Greber BJ, et al. The complete structure of the large subunit of the mammalian mitochondrial ribosome. Nature. 2014;515(7526):283–286. doi: 10.1038/nature13895. [DOI] [PubMed] [Google Scholar]
- 68.Adams PD, et al. PHENIX: Building new software for automated crystallographic structure determination. Acta Crystallogr D Biol Crystallogr. 2002;58(Pt 11):1948–1954. doi: 10.1107/s0907444902016657. [DOI] [PubMed] [Google Scholar]
- 69.Emsley P, Lohkamp B, Scott WG, Cowtan K. Features and development of Coot. Acta Crystallogr D Biol Crystallogr. 2010;66(Pt 4):486–501. doi: 10.1107/S0907444910007493. [DOI] [PMC free article] [PubMed] [Google Scholar]


