Significance
The introduction of genomic selection in dairy cattle improvement programs in 2008 was expected to increase rates of genetic gain, particularly for traits with low heritabilities, such as fertility and longevity. Our analysis of the US national dairy database found that generation intervals have decreased dramatically over the past 6 y, and selection intensity for lowly heritable traits has increased considerably. Genetic trends rapidly increased for fertility, lifespan, and udder health. These results clearly demonstrate the positive impact of genomic selection in US dairy cattle, even though this technology has only been in use for a short time. This progress in US Holsteins will have a favorable impact on other populations worldwide due to the widespread dissemination of US germplasm.
Keywords: genomic selection, genetic improvement, Holstein, dairy cattle, generation interval
Abstract
Seven years after the introduction of genomic selection in the United States, it is now possible to evaluate the impact of this technology on the population. Selection differential(s) (SD) and generation interval(s) (GI) were characterized in a four-path selection model that included sire(s) of bulls (SB), sire(s) of cows (SC), dam(s) of bulls (DB), and dam(s) of cows (DC). Changes in SD over time were estimated for milk, fat, and protein yield; somatic cell score (SCS); productive life (PL); and daughter pregnancy rate (DPR) for the Holstein breed. In the period following implementation of genomic selection, dramatic reductions were seen in GI, especially the SB and SC paths. The SB GI reduced from ∼7 y to less than 2.5 y, and the DB GI fell from about 4 y to nearly 2.5 y. SD were relatively stable for yield traits, although modest gains were noted in recent years. The most dramatic response to genomic selection was observed for the lowly heritable traits DPR, PL, and SCS. Genetic trends changed from close to zero to large and favorable, resulting in rapid genetic improvement in fertility, lifespan, and health in a breed where these traits eroded over time. These results clearly demonstrate the positive impact of genomic selection in US dairy cattle, even though this technology has only been in use for a short time. Based on the four-path selection model, rates of genetic gain per year increased from ∼50–100% for yield traits and from threefold to fourfold for lowly heritable traits.
Genetic improvement of livestock during the second half of the 20th century using pedigree and performance data has been very successful, particularly in dairy cattle populations (e.g., ref. 1). The improvement of dairy cattle has depended heavily on the use of artificial insemination (AI) to maximize the impact of elite bulls globally. Historically, progeny testing (2), or the characterization of these AI bulls by measuring and comparing performance of daughters, has been a critical step in identifying the very best bulls for widespread use. However, traditional genetic improvement schemes in dairy cattle have been limited by time required and expense of the progeny test paradigm. This process remained relatively slow because of the substantial time needed to accumulate sufficient daughter phenotypes to compute genetic evaluations with high accuracy. The recent development of genomic selection (3) programs based on single-nucleotide polymorphism genotypes was expected to increase rates of genetic gain (3, 4) in several ways, including shortened generation interval(s) (GI) (5, 6) and increased reliability of predicted breeding value(s) (PBV) (7). A doubling of rates of genetic gain was predicted when comparing genomic evaluations and traditional progeny testing schemes (5, 6, 8, 9). These advantages have been demonstrated in simulations (10, 11), and increased accuracies have been documented in the US Holstein population (12), but response to the incorporation of genomic data into dairy cattle evaluations has not been characterized.
In April 2008, the United States released its first unofficial genomic PBV, and official evaluations for Holsteins and Jerseys were published in January 2009 (9). Genomic selection was rapidly adopted by the industry, and more than half of all AI matings in the United States are now made to genomically tested young bulls (13). Genomic breeding values have been available for 6 y, so a characterization was conducted of the dynamic changes in rates of genetic gain associated with alterations in GI and selection differential(s) (SD). Rendel and Robertson (14) described a four-path model of genetic improvement in which genetic progress occurs with differing selection dynamics, partitioned into improvement due to genetic changes in sire(s) of bulls (SB), sire(s) of cows (SC), dam(s) of bulls (DB), and dam(s) of cows (DC). The objective of this study was to measure the impact of genomic selection on SD and GI in US Holstein cattle using this four-path model, and to compare these observed results with those results predicted by theory.
Results and Discussion
GI.
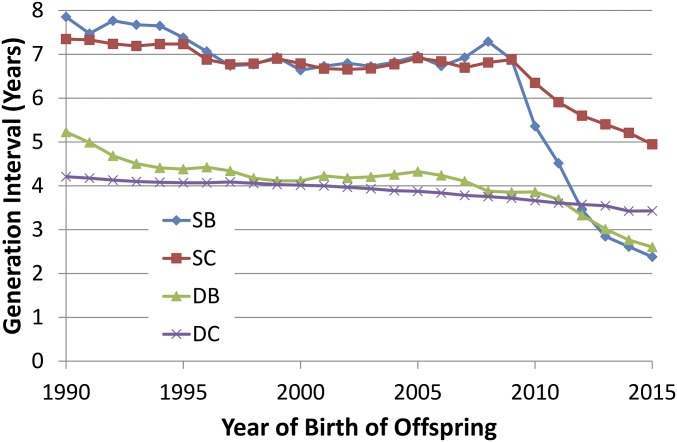
The GI of SB and SC before 2010 were around 7 y, which was the expected optimum under selection based upon progeny test results (15) (Fig. 1 and Table S1). A precipitous decrease for GI of SB and SC began in 2010, the year following the introduction of genomic evaluations. This change is consistent with the prediction of Schaeffer (6). After a modest reduction in the GI for both SB and SC in the early 1990s, both of these selection paths showed very stable intervals of ∼6.8 y until 2009. These GI were reduced by 25–50% over the next 5 y to averages of less than 3 y for SB and ∼5 y for SC. Before genomic selection, both sire analysts and producers were, apparently, reluctant to sacrifice the accuracy of progeny testing for shorter GI. There was a slow decline in GI for the DB pathway, averaging more than 5 y in the late 1980s but declining to about 4.5 y in the early 1990s and finally reaching less than 4 y immediately before the introduction of genomic selection in 2009. The GI for this path have dropped further since 2009, and by 2014, the GI was less than 3 y. The DC path is inherently conflicted by pressure to reduce GI to enhance selection gain against the practical need to increase herd life and profitability. A gradual, but steady, reduction in the GI of the DC path from 4.2 to 3.6 y has taken place over the past 25 y.
Fig. 1.
GI for four paths of selection (SB, SC, DB, and DC) by birth year of offspring for Holsteins.
Table S1.
Averages of GI in years for four paths of selection (SB, SC, DB, and DC) for ranges of birth years of the progeny of that selection path
| Birth year of progeny | |||||||
| Selection path | 1981–1985 | 1986–1990 | 1991–1995 | 1996–2000 | 2001–2005 | 2006–2010 | 2011–2015 |
| SB | 7.7 | 8.0 | 7.3 | 6.8 | 6.8 | 5.5 | 2.6 |
| SC | 6.8 | 7.3 | 7.1 | 6.8 | 6.8 | 6.3 | 5.2 |
| DB | 5.3 | 5.1 | 4.4 | 4.2 | 4.2 | 3.7 | 2.8 |
| DC | 4.2 | 4.2 | 4.1 | 4.0 | 3.9 | 3.7 | 3.5 |
Most paths showed substantial reductions from analogous values reported by Van Tassell and Van Vleck (15). They reported GI of 11.0, 6.4, 8.9, and 4.9 y for SB, SC, DB, and DC, respectively, in data from the late 1970s. Corresponding values from 2009 before genomic evaluations were 6.9, 6.9, 3.9, and 3.8 y. The totals of all four paths were 31.2 y in the 1970s and 21.4 y in 2009, a reduction of over 30% in those 30 y. By contrast, in 2015, the comparable values were 2.4, 5.0, 2.6, and 3.6 for a total of 13.5 y. This change reflects a 37% reduction in the most recent 6 y since the introduction of genomics.
Yield Traits.
Milk, fat, and protein yields have routinely been collected for as long as a century (16). The yield traits have had varying economic weights in total merit indices (17), but progress would be anticipated based on their moderate heritability (∼0.30) (18). The average milk yield has nearly doubled from 6,619 to 12,662 kg in the 50 y from 1963 to 2013, and over 56% of that increase can be attributed to genetic change according to the Council on Dairy Cattle Breeding (www.cdcb.us).
SD.
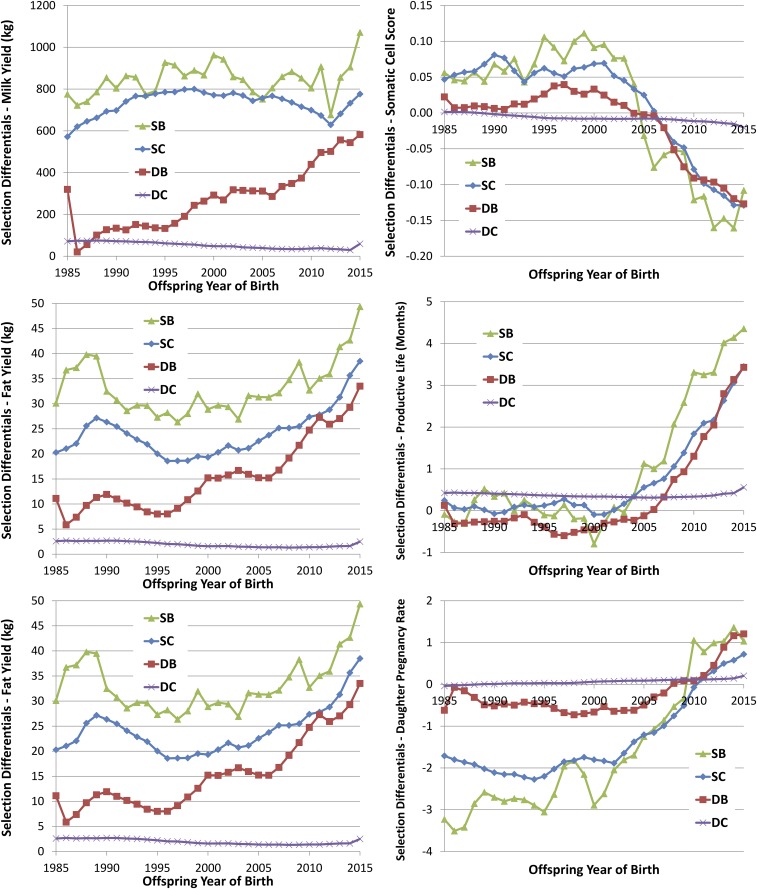
Estimated SD for yield traits (Fig. 2 and Table S2) show similar trends across all three traits for each of the selection paths. The similarity of these trends is likely due, in part, to the high genetic correlations (0.71–0.93) among these traits (19). The trends for milk and protein yields are very similar from 1985 to 2010, and these two traits have the highest genetic correlation (0.93). One notable difference is the relative SD for the SC path compared with the SB path. For milk, the SD for the SC path track very similar to the SB path, but for fat and protein yield, there is a substantial and consistent gap between these two paths, presumably because farmers appear to impose more intense selection on milk yield than on either of the component yields.
Fig. 2.
SD for four paths of selection (SB, SC, DB, and DC) for six traits (milk, fat, and protein yields; SCS; PL; and DPR).
Table S2.
Averages of estimated SD for four paths of selection (SB, SC, DB, and DC) for six traits (milk, fat, and protein yields; SCS; PL; and DPR) for ranges of birth years of the progeny of that selection path
| Birth year of progeny | ||||||||
| Trait | Selection path | 1981–1985 | 1986–1990 | 1991–1995 | 1996–2000 | 2001–2005 | 2006–2010 | 2011–2015 |
| Milk, kg | SB | 823 | 867 | 929 | 990 | 924 | 925 | 919 |
| SC | 522 | 730 | 841 | 867 | 846 | 814 | 752 | |
| DB | 286 | 79 | 142 | 241 | 326 | 400 | 579 | |
| DC | 41 | 58 | 49 | 36 | 41 | 47 | 36 | |
| Fat, kg | SB | 30.2 | 40.9 | 32.1 | 31.6 | 32.8 | 37.5 | 42.9 |
| SC | 18.0 | 26.5 | 25.0 | 20.8 | 23.5 | 28.1 | 33.9 | |
| DB | 9.8 | 9.6 | 9.9 | 11.8 | 17.0 | 22.2 | 30.3 | |
| DC | 1.5 | 2.1 | 1.8 | 1.2 | 1.3 | 1.5 | 1.5 | |
| Protein, kg | SB | 19.9 | 29.5 | 34.3 | 35.8 | 33.8 | 32.8 | 33.8 |
| SC | 11.5 | 19.7 | 24.3 | 25.4 | 26.3 | 25.7 | 25.6 | |
| DB | 7.3 | 5.7 | 8.9 | 12.9 | 15.6 | 17.1 | 22.9 | |
| DC | 1.2 | 1.8 | 1.7 | 1.3 | 1.3 | 1.5 | 1.1 | |
| SCS | SB | 0.06 | 0.06 | 0.08 | 0.10 | 0.06 | −0.08 | −0.16 |
| SC | 0.04 | 0.07 | 0.07 | 0.07 | 0.05 | −0.04 | −0.12 | |
| DB | 0.02 | 0.01 | 0.02 | 0.04 | 0.01 | −0.06 | −0.12 | |
| DC | 0.00 | 0.00 | −0.01 | −0.01 | −0.01 | −0.01 | −0.01 | |
| PL | SB | 0.34 | 0.16 | 0.14 | −0.24 | 0.26 | 2.44 | 4.07 |
| SC | 0.26 | 0.03 | 0.10 | 0.16 | 0.26 | 1.30 | 2.73 | |
| DB | 0.11 | −0.35 | −0.28 | −0.57 | −0.25 | 0.83 | 2.73 | |
| DC | 0.35 | 0.42 | 0.37 | 0.30 | 0.21 | 0.21 | 0.31 | |
| DPR | SB | −2.97 | −3.27 | −3.15 | −2.51 | −2.09 | −0.22 | 1.15 |
| SC | −1.49 | −2.10 | −2.38 | −2.01 | −1.71 | −0.73 | 0.42 | |
| DB | −0.58 | −0.30 | −0.48 | −0.71 | −0.62 | −0.03 | 0.78 | |
| DC | 0.03 | 0.04 | 0.08 | 0.08 | 0.03 | 0.00 | 0.06 | |
Historically, a very large fraction of the selection pressure has been applied to the two sire paths of selection (SB and SC), because the information obtained on bulls enabled the characterization of genetic value of those animals with high accuracy and use of the very best bulls in the population resulted in large SD. This phenomenon was true in the historic data reported here. The fraction of SD associated with the SB (SC) pathway ranged from 42 to 50% (31–43%) between 1990 and 2010 (Table S2). The combined impact of these two paths ranged from 73 to 90%, clearly demonstrating the profound influence of AI in genetic improvement in the dairy industry. The impact of females in the genetic improvement of the Holstein has been limited, on the other hand. For the DB path, the genetic merit of those elite cows has been plagued by overestimation (contributing to so-called “pedigree slippage”) associated with the preferential treatment of these cows (20, 21). This path of selection shows consistent improvement over time, presumably due to improvement in genetic evaluation methodology, data quality control, and expertise and experience in bull procurement. The SD for DC observed over the past 30 y, with a range of 24–56 kg and an average of 41 kg, are strikingly similar to the previously estimated SD for DC of 42 kg (15). The lack of selection on this DC pathway is due to a lack of opportunity. Most cows leave a herd due to involuntary culling, not due to selection for production (22).
Genomic selection has produced a substantial increase in the SD for milk yield across the most recent 4 birth years, with the highest SD ever recorded occurring in the most recent birth year for all pathways except DC. With the exception of the SD for milk yield for SC, the final year of birth was the highest SD ever. Given the turbulence in the breeding programs caused by the availability of genomic breeding values, the time required to locate elite cows and establish contract matings, and the gestation length, it is probably unrealistic to anticipate a change in SD in under 3 y. Alternatively, some AI organizations genotyped “bulls-in-waiting,” or bulls that would have had daughters that would be used to generate traditional estimates of breeding values, to make decisions based on genomic values. It is unclear what impact those selection decisions would have on SD.
The prospect for change in the DC pathway is significant because of increasing adoption of sex-selected semen (23) and embryo transfer (24). The recent growth in the adoption of this technology is coincidental with the adoption of genomics in the dairy industry. Interestingly, as long as 60 y ago, Rendel and Robertson (14) noted that both sex determination and superovulation and transplantation of ova would increase SD, but noted that there “is no immediate prospect of either being applied commercially on a large scale.” Presently, both of these technologies, and even more aggressive reproductive technologies like aspiration of oocytes (25) from prepubertal heifers followed by in vitro fertilization, are being used to complement the use of genomics.
Annual genetic gain.
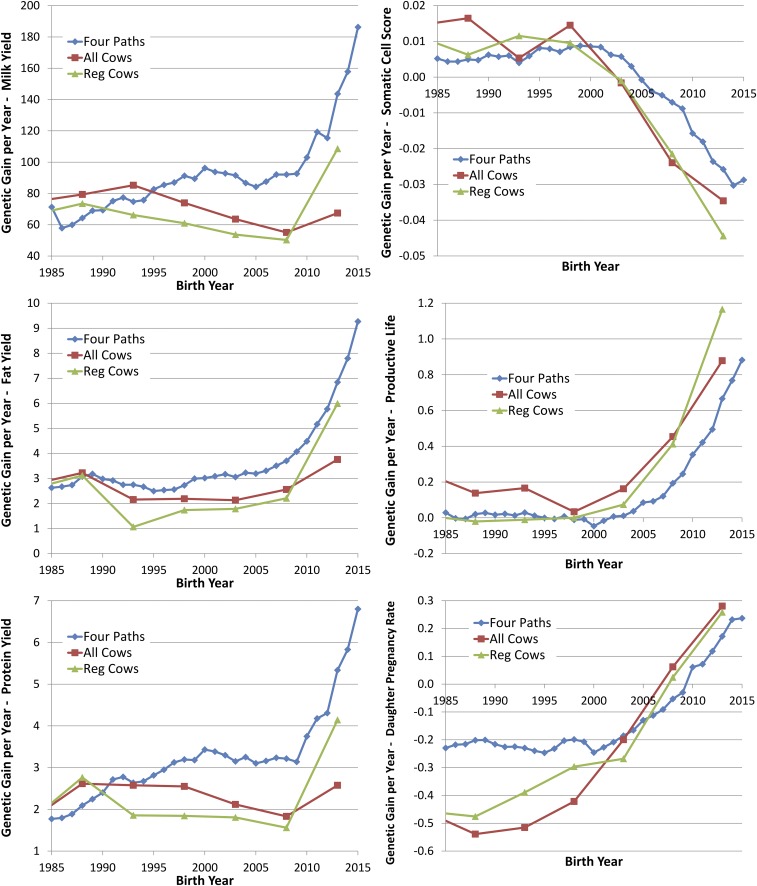
The rate of genetic gain per year was calculated for each birth year as Δg in Eq. 1 by calculating the sum of the SD divided by the sum of the GI for each year (Fig. 3). In addition, genetic trends for cows were estimated using segmented regression values that were calculated in 5-y windows for all cows and separately for cows registered in the Holstein herdbook (Fig. 3 and Table 1). The regression lines were forced to join at the points midway between the ends of the adjacent 5-y windows.
Fig. 3.
Genetic gain per year estimates from four paths of selection (Four Paths) and segmented regressions of trait PBV on birth year for all cows (All Cows) or the subset of cows registered in the national herdbook (Reg Cows) for six traits (milk, fat, and protein yields; SCS; PL; and DPR).
Table 1.
Estimates of genetic change per year from segmented regressions of PBV on birth year for all cows (All Cows) or the subset of cows registered in the national herdbook (Registered cows) for six traits: milk, fat, and protein yields; SCS; PL; and DPR
| Group | Trait | 1981–1985 | 1986–1990 | 1991–1995 | 1996–2000 | 2001–2005 | 2006–2010 | 2011–2015 |
| All cows | Milk | 74 | 79 | 85 | 74 | 64 | 55 | 67 |
| Fat | 2.8 | 3.2 | 2.2 | 2.2 | 2.1 | 2.6 | 3.8 | |
| Protein | 1.8 | 2.6 | 2.6 | 2.6 | 2.1 | 1.8 | 2.6 | |
| SCS | 0.014 | 0.016 | 0.005 | 0.014 | −0.002 | −0.024 | −0.035 | |
| PL | 0.25 | 0.14 | 0.17 | 0.03 | 0.16 | 0.45 | 0.88 | |
| DPR | −0.46 | −0.54 | −0.52 | −0.42 | −0.20 | 0.06 | 0.28 | |
| Registered cows | Milk | 66 | 74 | 66 | 61 | 54 | 50 | 109 |
| Fat | 2.6 | 3.1 | 1.1 | 1.7 | 1.8 | 2.2 | 6.0 | |
| Protein | 1.7 | 2.8 | 1.9 | 1.8 | 1.8 | 1.6 | 4.1 | |
| SCS | 0.011 | 0.006 | 0.012 | 0.010 | −0.001 | −0.021 | −0.044 | |
| PL | 0.01 | −0.02 | −0.01 | 0.00 | 0.07 | 0.41 | 1.17 | |
| DPR | −0.46 | −0.48 | −0.39 | −0.30 | −0.27 | 0.02 | 0.26 |
It is important to recognize that these figures represent differences in rates of genetic change rather than trends in genetic values. The relatively flat trends in yield trait do not represent a lack of genetic change in the population but, instead, reflect stable rates of genetic gain. In contrast, the slopes of many of the traits in Fig. 3 represent accelerating rates of genetic improvement rather than a steady increase of genetic values.
The three estimates of genetic gain generally agree (Fig. 3), but the estimated gains from the segmented regression for all cows compared with only registered cows show differences for most of the traits in the last time segment. Using the segmented regression for registered (all) cow, genetic gains for milk, fat, and protein yields were 50, 2.2, and 1.6 (58, 2.6, and 1.8) kg per year before genomic selection began and increased by over twofold (by about 50%) to 109, 6.0, and 4.1 (67, 3.8, and 2.6) kg per year after genomic selection was introduced (Table 1). The rate of gain in 2014 compared with 2008 showed an increase of 71%, 111%, and 81% for milk, fat, and protein genetic gain, respectively, calculated using the GI and SD of the four paths. The estimates for all three yield traits based on the four paths exceeded the estimates based on the increase estimated from the cows, which was estimated by regressing PBV on birth years for cows using 5-y windows and requiring that the regression lines join at the time between the 5-y segments. This result should not be surprising, because the turnover of the dairy herd is relatively slow. Recent characterization of the UK dairy population (26) found an average lifespan of 6.8 y. It is likely somewhat less in the United States, but, given that the recent GI for SC and DC paths were 5.4 and 3.7 y (Table S1), the lag of genetic improvement from the bull to the cow is considerable. The estimates based on the four paths assume that the breeding program is at equilibrium, and this assumption is not likely met, given the rapid changes that were taking place. For all of the yield traits, the average in the last year shows a reduction in improvement in the last year for the nonregistered cows relative to the registered cows, which may reflect the acceptance of genomic selection by registered breeders. The increases measured here for the yield traits were similar to those increases predicted in a simulation study (11), which were 59–120% greater than progeny testing.
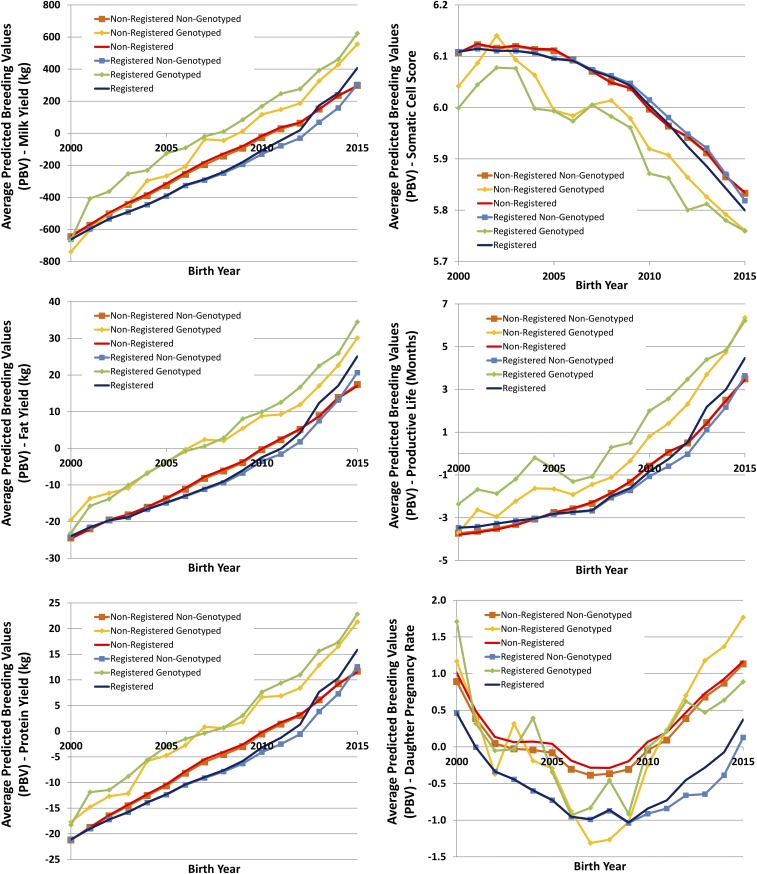
These results are potentially biased by a number of factors. The Rendel and Robertson (14) equation for genetic gain assumes a steady-state system where the flow of genetic gain is in equilibrium. Clearly, the flow in the system has undergone a major change that has not had an opportunity to stabilize. In fact, based on the trends in SD and GI, the rate of gain is still likely to increase. Another anomaly having an impact on these estimates is selective reporting, particularly of females. Unlike AI bulls, which are all genotyped as a prerequisite to distribution of semen, genotyped cows are more likely elite (Fig. S1). Although theoretical results suggest that selective genotyping and selections based on those genetic predictions can bias evaluations (27), in practice, evidence of bias has not been found (28). Newer statistical methods being adopted are believed to accommodate this preselection (29). A bias in predicted genetic merits (i.e., overestimation or underestimation of PBV based on genomic data) would clearly have an impact on genetic trend estimates, especially the most recent estimates using cow data, where PBV are most influenced by genomic values. This outcome seems unlikely, given the scrutiny of the breeders and the refinements made to the evaluation system (e.g., 30). Finally, relative improvement in gains could be underestimated because many “sires-in-waiting” were genotyped and genomic PBV were calculated. These bulls were born and preselected before genomic selection was implemented, and daughters were forthcoming, but many AI companies made decisions to cull or keep these bulls instead of waiting for the daughter information. As a result, the impact of genomic selection was likely earlier than the incorporation of genomic data into genetic prediction.
Fig. S1.
Average PBV for genotyped, nongenotyped, and all cows registered and nonregistered in the national Holstein herdbook with for six traits (milk, fat, and protein yields; SCS; PL; and DPR).
Somatic Cell Score.
Somatic cell score (SCS) is a measure of udder health derived from somatic cell count that is associated with intramammary infection, mastitis. Genetic evaluations for SCS have been calculated in the United States for dairy cattle since 1994 (31). The SCS trait is important because it has a strong relationship with the presence of clinical and subclinical mastitis, and is much easier to measure than mastitis in dairy cattle (32, 33). Mastitis is of great economic importance in the dairy industry because of losses associated with reduced milk production; discarded milk; premature culling; and increased costs for therapeutics, veterinary care, and replacement animals (34).
SD.
From 1985 to 2000, there was no clear trend in any of the four paths for SD of SCS (Fig. 2). In fact, the SD for the three more influential paths were all positive (worsening, because a lower value for the SCS is preferred) until 2005. The DC had slightly favorable SD since about 1990. The consistent but slightly negative SD for DC may have been the result of culling due to mastitis. The SD for SCS were improving between 2001 and 2015; however, the SD increased in the United States Holstein population for SB, SC, and DB despite the unfavorable relationship with milk yield (32) and the simultaneous improvement of yield traits. The change in SD of SCS is likely related to the inclusion of this trait in the US Department of Agriculture (USDA) selection index, Net Merit, in 1994 (35). From 2010 to 2014, when it was possible to observe the effects of genomic selection, the SD for these three paths continued to increase and the DC path showed modest improvement.
Annual genetic change.
One of the promises of genomic selection was to increase the genetic improvement of traits with low heritability. With a heritability of around 0.10 (31, 32), SCS would be considered lowly to moderately heritable. The estimates of genetic trend show dramatic increases in the annual gain for SCS. The estimates from the four paths of selection show a 330% increase in SCS progress, whereas the estimates based on genetic merit predictions of cows suggested an increase of 50–100% (Table 1). The discrepancy between these two methods of measuring genetic gain are influenced greatly by the sudden and dramatic recent changes measured in the four paths of selection and not yet reflected in the cows because of GI.
Productive Life.
Productive life (PL) (36) is a measure of animal longevity based on the amount of time a cow spends producing milk in its life. Longer lived animals typically are more profitable than shorter lived animals, particularly when the cost of raising an animal from birth to the start of lactation is high. The heritability of PL is relatively low (h2 = 0.08), and selection accuracy is typically low for young animals that have few offspring with direct culling information (37). Despite these challenges, the trait has substantial economic value and currently receives 22% of the total emphasis in the combined economic index, Net Merit. Genetic evaluations for PL have been calculated since 1994.
PL has strong correlations with fertility and other fitness traits. In addition to its impact on production economics, increased genetic merit for PL provides advantages to consumers and livestock. Long-lived animals are healthy and robust in the face of stresses of lactation, require fewer veterinary interventions, and are far less likely to experience difficulty in calving. Based on consumer demand for organic milk (38), consumers prefer animal production practices that involve minimal use of pharmaceuticals, regardless of federal rules regarding withholding times, and associate longevity positively with animal well-being (39).
SD.
SD for PL have generally been slightly negative to modestly positive until 2005. The introduction of genomic selection produced a rapid and substantial increase in SD in the SB, SC, and DB paths. Most notably, the SD in the SB path increased by a factor of 10 between 2001–2005 and 2011–2015, from 0.26 to 4.07. This increase is due largely to the influence of a single bull, O-Bee Manfred Justice-ET (O-Man), that received his first official proof in May 2003 and was one of the top bulls in the breed for many years. O-Man was notable as an outlier for Net Merit, the primary economic index promoted by the USDA, in part, because he was also an extreme bull for longevity. Not only did O-Man generate over 100,000 daughters in the United States; he also sired 425 sons that entered service as AI sires. The increase for the SB path may also reflect increased emphasis on longevity. This change in emphasis likely resulted from increased feed costs and a shortage of replacement animals during that time. The effect of O-Man and his sons as sires of cows can be seen in the fivefold increase of SD in the SC path between 2001–2005 and 2006–2010, from 0.26 to 1.30.
SD for DB were consistently negative until 2005 and then increased by over threefold from 2006–2010 to 2011–2015. The SD in the DC path increased from 0.21 to 0.31, but those values are well within the range of values previously observed. It is difficult to attain substantially higher SD in the DC path because limits on the need for replacement animals prevent dairy farmers from increasing the selection intensities to levels comparable to those selection intensities of bulls.
Annual genetic change.
From the results for SD, it follows that there was essentially no trend in PL before 2005 (Fig. 3). However, all three estimates of yearly genetic gain show a substantial change between 2005 and 2010. Estimates from cows show increases of nearly three- to sixfold in the rate of change from 2001–2005 to 2006–2010, followed by an additional approximately two- to threefold increase in 2011–2015. The estimates from the four paths align with estimates from registered cows. Across the methods, the range of increase is four- to 15-fold, much more than previously predicted (5, 6, 11).
Daughter Pregnancy Rate.
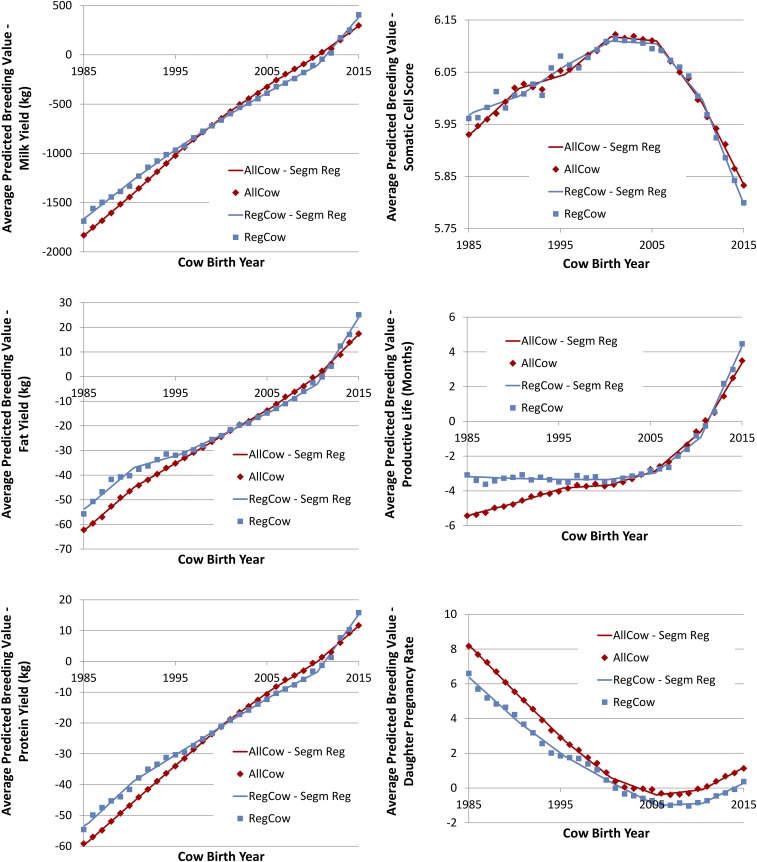
Daughter pregnancy rate (DPR) (40) is a measure of the ability of daughters of a bull to become pregnant, and currently receives 11% of the total emphasis in lifetime Net Merit (35). DPR is expressed on a percentage scale, with positive values representing increased fertility. Cow fertility is an important trait economically because cows must periodically produce calves to initiate lactation. There is a genetic antagonism between fertility and milk yield, and that negative genetic correlation has resulted in a steady decline in fertility in Holsteins (41) until 2005 (Fig. 4). A genetic merit prediction for DPR has been available to farmers and the dairy industry since early 2003. Low-heritability traits like DPR, which has a heritability of 0.04, are expected to benefit the most from the use of genomic information.
Fig. 4.
Average PBV and segmented regression (Segm Reg) fits of these values for all cows (AllCow) and cows registered in the national Holstein herdbook (RegCow) by year of birth for six traits (milk, fat, and protein yields; SCS; PL; and DPR).
SD.
SDs for DPR were generally negative for much of the past 30 y, with the exception of the DC pathway (Fig. 2), which was consistently positive but very small. As a result, cow fertility has steadily decreased in Holsteins over much of this period (Fig. 4). The DC pathway has shown positive SD across time, probably because of the simple fact that cows that were more fertile had more calves or as a veterinarian colleague once said, “If a cow is infertile, the chances are that her daughter will be too!” Because of the relatively small population represented in the sires that had sons in a given birth year, the SD for SB are quite volatile. For example, in 2008, there were 21 sires with 100 or more sons, 92 bulls with 10 or more sons, 324 bulls with more than 1 son, and 576 total SB, representing 4,888, 7,458, 8,356, and 8,608 sons in all, respectively. In contrast, in the same year, there were no dams with 100 or more sons, 29 dams with 10 or more sons, 1,391 cows with more than one son, and 5,455 total DB, with 376, 4,544, and 8,608 total sons, respectively. The trends in SD for the DB pathway are more stable than for the SB pathway. All of these SD showed negative selection pressure until after 2005. There was very little trend in SD for DPR for the SC and DB paths until the early 2000s, when the negative differentials steadily decreased, becoming positive in 2007 and 2008. In the period since the introduction of genomic selection, SD have markedly increased, which supports the expectation that genomic selection will help identify superior animals for lowly heritable traits early in life.
Annual genetic change.
The results for the PBV for DPR provide compelling evidence that selection for a lowly heritable trait can be very effective (Fig. 4). The downward trend in fertility stabilized in the first year that genetic evaluations became available (2003) and demonstrate the tremendous influence that genomic selection can have on such a trait. The genetic gain per year agrees quite well between the two different methods, although the genetic gain estimates based on the cows increase more rapidly than the genetic gains estimates from the four paths (Fig. 3). The ratios and percentage increases of annual change are relatively meaningless for DPR, because the genetic trends at the time of implementation of genomic selection were very close to zero; however, clearly, selection response for DPR has dramatically increased.
Inbreeding.
Inbreeding and relatedness of individuals in a breed are important for understanding the consequences of loss of genetic diversity. Inbreeding is half the relationship of the parents of an individual, and the expected future inbreeding (EFI) is determined as half the mean relationship of an individual to its potential mates (42). Additionally, inbreeding and expected inbreeding can be determined using pedigree or genomic measures of inbreeding and relatedness (43).
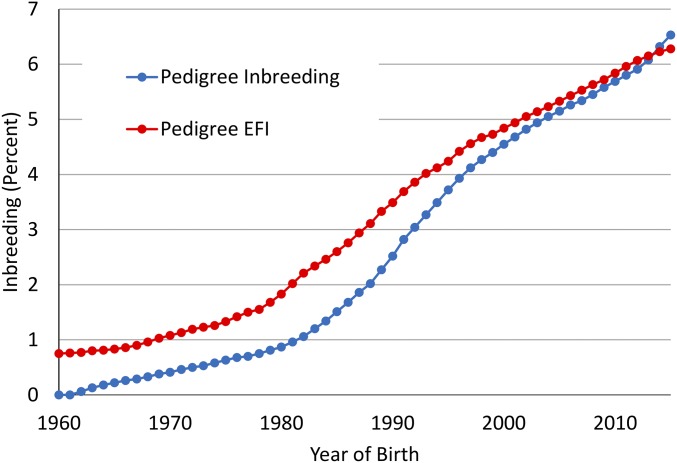
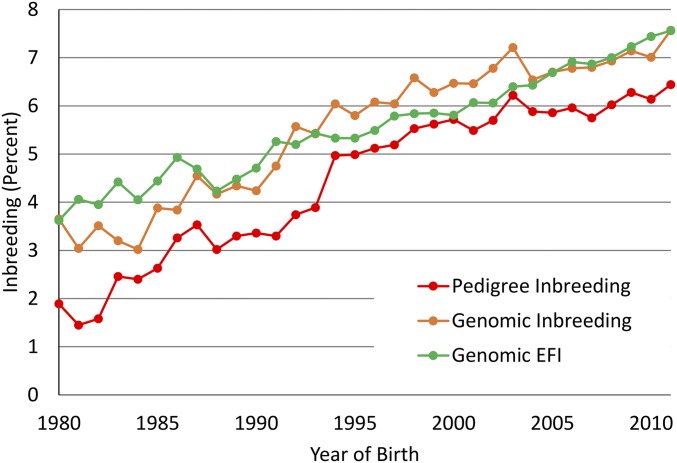
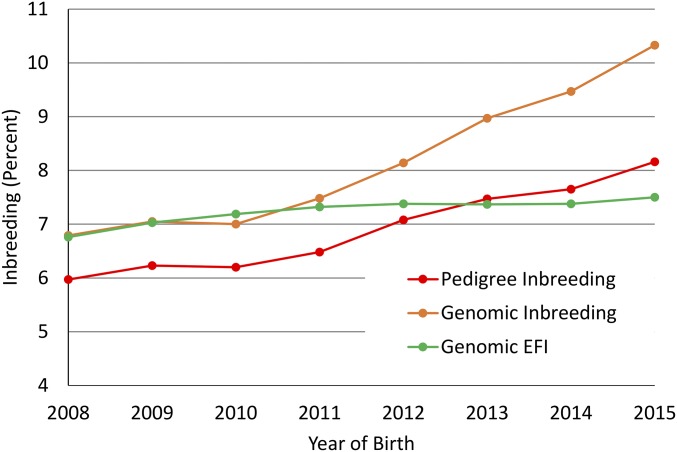
Some studies have argued that inbreeding per generation may decrease but inbreeding rates per year may increase because of the reduction in GI (43); however, most of these conclusions were drawn from simulation studies. Trends for inbreeding in cows (Fig. S2) show little impact on rates of change of inbreeding or EFI derived from pedigrees. Using “joinpoint” (44) to estimate end points and slopes for segmented regression, there was an increase from 0.11 to 0.21% per year in 2012. There was no evidence of a change in the rate of EFI since 1997. Next, considering the genomic future inbreeding (GFI) for genotyped bulls with evaluations that include performance records on daughters (Fig. S3), the joinpoint results showed that a single slope was the most probable fit. The change in genomic inbreeding was stable, with a rate of 0.07% increase per year for this group since 1998. Finally, the change in inbreeding and GFI was considered for bulls that were genotyped but did not have records on daughters (Fig. S4). The striking feature in these data is the very slow rate of increase in GFI, although a high rate of increase in genomic inbreeding took place. After examining a sample of some of the pedigrees, it appears that linebreeding is being used as a means to control inbreeding accumulation in dairy herds by some breeders.
Fig. S2.
Average inbreeding and EFI of cows determined from pedigree by year of birth.
Fig. S3.
Average inbreeding determined from pedigree and genotype and EFI determined from genotype for genotyped bulls with daughter performance data by year of birth.
Fig. S4.
Average inbreeding determined from pedigree and genotype and EFI determined from genotype for young genotyped bulls with no daughter performance data by year of birth.
General Observations.
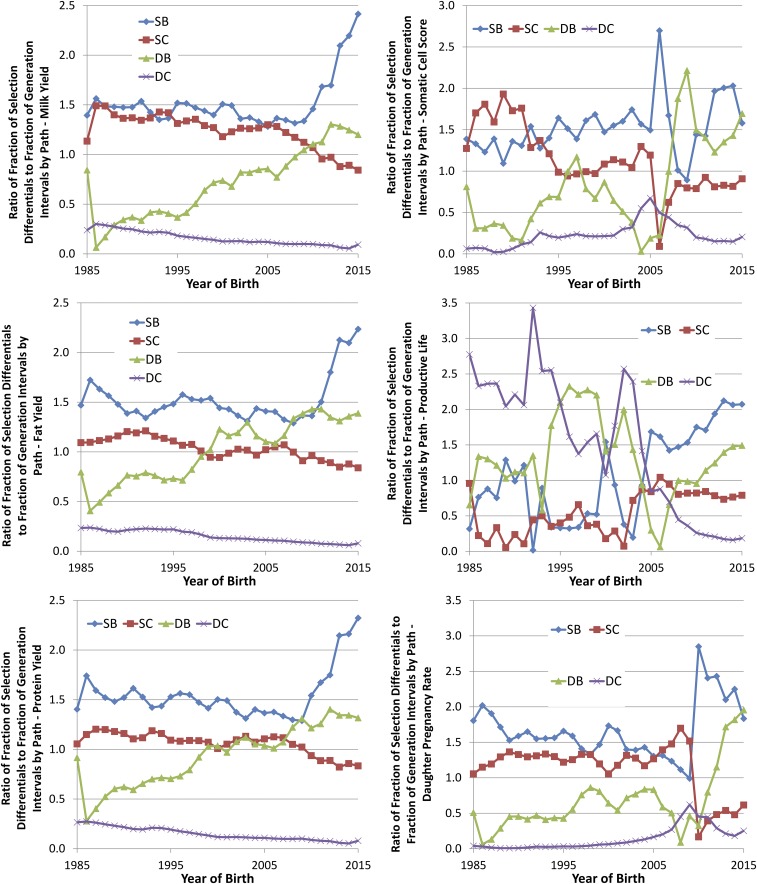
By comparing the fraction of the total SD as a ratio to the fraction of the total GI for each selection path, the relative impact of each path on genetic gain can be assessed. If a selection path has the same fraction of SD as its fraction of GI, the ratio of these fractions would be 1. If all selection paths had ratios of 1, then all paths would be contributing proportionally. If one selection path has a higher value than another, then it contributes proportionally more to the selection gain than the path with a lower value. There are several notable features that can be seen in these ratios (Fig. 5).
Fig. 5.
Fraction of total SD as a ratio to the fraction of total GI for four paths of selection (SB, SC, DB, and DC) for six traits (milk, fat, and protein yields; SCS; PL; and DPR).
First, the influence of SB appears to be the largest driver of genetic gain, with all traits showing twice the fraction of selection pressure as generation fraction (Fig. 5). Much of the change seen in this ratio is driven by the reduction in the age of sires generating AI bulls. This decrease in age will eventually plateau because onset of puberty is necessary for semen production.
Second, the impact of the DB pathway is much greater with genomic selection than before the adoption of this technology. The impact of DB has generally increased over the past 30 y. Like SB, this path has seen a substantial decrease in GI, but there has been a long-term trend of increasing SD for many of the traits. As discussed earlier, this selection path was beset by systematic underperformance rooted in the preferential treatment of elite cows. Through a variety of methods, this problem was improving, but the introduction of genomic selection has reduced the influence of preferential treatment by dramatically reducing the impact of performance data from these very young animals. The use of advanced reproductive technologies will likely accelerate progress in this path by enabling selection by increasing the number or quality of candidates for selection (23, 25, 45–47).
The SC selection path showed a modest reduction in relative impact on genetic gain (Fig. 5), despite SD that showed consistently improving values (Fig. 2) and reducing GI (Fig. 1). The proportional reduction in GI was not as large as for SB and DB. This situation may be due, in part, to a biological limitation on maturity of the bulls and production of sufficient semen from relatively young bulls to breed the national herd of 9 million cows. It is also likely that there was some reluctance from farmers to adopt the use of genomic PBV without historical evidence of their accuracy.
The DC pathway has traditionally been the selection path with the least genetic gain (e.g., 15), and these results suggest that, with genomic selection, the DC pathway will have even less influence. The dairy herd needs a stable supply of replacement cows to enable selection. An increased selection pressure results in an increasing rate of replacement, and a consequence of this higher turnover rate is a reduction in herd life, which quickly erodes farm profitability. Because dairy cattle do not start generating milk until they are about 2 y old, the income from a cow only then starts to pay back the costs of rearing. Therefore, although reducing GI may increase the genetic gain per year, this reduction is counterproductive to the viability of the farm. Advanced reproductive technologies, with the exception of sex-selected semen, have been sufficiently disruptive to the supply of replacement cows, or have proven not to be economically feasible, and they have not had broad adoption in large, commercial dairy farms.
Validation of Genetic Prediction.
Results based on Holstein DPR calculated for the September 2014 Interbull test run were used to assess the accuracy of genetic trend estimates. Trend validation of traditional PBV for DPR was based on evaluations of 31,568 Holstein bulls. The tests of this method showed that the genetic trend including only first lactation data did not differ from the trend including all data (P = 0.34), which indicates that the trend is correctly estimated. This result is important because the traditional PBV are combined with genotype information to predict genomic PBV, and if the genetic trend in the PBV is biased, then the trend in the genomic PBV will also be biased. There were 1,178 bulls included in the cutoff test to determine stability of evaluations over time. Estimated bias in the test was not different from zero, with a 95% confidence interval (−0.032, 0.022), indicating that the addition of phenotypic records from new daughters does not cause systematic bias in the PBV of a bull.
The US evaluations also passed trend validation for genomic PBV of DPR based on data from 2,756 Holstein bulls born in 2006. The estimated regression (b1 = 0.92) was not different from 1 based on a biological test statistic (0.85 ≤ 0.92 ≤ 1.05). These results suggest that the genetic trend observed for DPR after the introduction of genomic selection in the United States is accurate and is not inflated by systematic bias not accounted for in the genetic evaluation system.
Materials and Methods
Data.
The data used in this study consisted of genetic evaluations, PBV of milk yield (MY), fat yield (FY), and protein yield (PY) (48); DPR, a measure of cow fertility (40); PL, a measure of lifespan in the herd (36); and SCS, a metric representing mammary gland health (31). Records for a total of 25,484,363 US cows born since 1975 and 316,485 bulls born since 1950 were used in the analysis. Records were included for both cows registered with the Holstein Association USA and nonregistered cows with AI sires that received PBV in the April 2015 genetic evaluation that incorporates pedigree, genomic, and phenotypic data. The phenotypic data were collected on farms as part of routine herd management and collected in a national data repository.
SD and GI.
Average PBV for each of the seven traits were calculated by birth year for all cows and for registered cows. For each path of selection, average PBV were calculated in a number of ways. In all calculations, values were derived from PBV of the parental generation (i.e., the sires and dams, not the bulls and cows). Averages were computed by grouping on parent or offspring year of birth. For groupings by parental birth year, averages were either unweighted or weighted by the number of progeny. For the weighted average, the contribution of a parent to that birth year was proportional to the number of offspring, whereas for the unweighted averages, all animals contributed equally. For the unweighted averages by offspring birth year, because offspring could be born in multiple years, the offspring birth year assigned to PBV of the parent was the year of the average birth date. The weighted average is more representative of the animals used in the population because it accounts for the number of times an animal was used as a parent in the population (15).
Similarly, average SD were calculated based on parent and offspring birth year for each trait. As with the averages for PBV, these calculations were based on the SD of each parent in the four paths. The SD for each parent was calculated as the difference between the PBV of the parent deviated from the average PBV of the appropriate base group in that same birth year. For the SB, the SC and DS paths were compared with the base group of registered cows because AI bulls and their parents are generally registered. The DC were compared with all cows. Like the PBV calculations, SD were calculated by parent and progeny birth year and were either weighted or not weighted by progeny number.
GI were calculated for each path of selection by year of calf birth, and were defined as the age of the sire or dam of a bull or cow when the offspring was born (15). By calculating the GI by offspring birth year, there should be no bias in these estimates. If, however, GI were calculated by parent birth year, underestimation of GI due to censoring could become problematic because animals born recently would only have had an opportunity to generate offspring if their GI was shorter than the time to the end of data collection. Results were compared with optimum values reported for progeny testing (15) and genomic selection (6).
Genetic Change per Year.
Annual genetic change was estimated using SD and GI for each of the four paths of selection using the method of Rendel and Robertson (14):
| [1] |
where is the estimated genetic superiority of the selected animals over their contemporaries born in the same year, is the average age of the selected animals when their offspring were born, and is annual genetic change. In traditional progeny testing programs, LSB and LSC typically are larger than LDB and LDC.
Genetic Trends.
Genetic trends were calculated using the nonlinear procedure of SAS [Proc NLIN (49)] by segmented linear regression of PBV for each trait on year of birth for all cows and separately for cows registered in the Holstein herdbook. Each segment included a 5-y window, and regressions were constrained so that those regression lines intersected at joinpoints between each segment. Best fits were determined by minimizing mean squared errors. The break points were determined by fitting segmented regressions with variable time points across the six traits using joinpoint (44). These time periods were defined by progeny year of birth. There seemed to be a consensus that 2011 was the point at which the greatest changes took place, especially for the cow PBV. To summarize the effect of time on the rate of genetic improvement, eight time periods were then defined: 1976–1980, 1981–1985, 1986–1990, 1991–1995, 1996–2000, 2001–2005, 2006–2010, and 2011–present. The regression lines were forced to join at the points midway between the ends of the adjacent 5-y windows (1980.5, 1985.5, etc.). These periods were selected to provide historical context and to isolate the impact of genomic selection on dairy cattle breeding.
Genetic Trend Validation.
Interbull trend validation methods were used to verify that estimates of genetic trend based on traditional PBV were accurate, and that breeding values were not overestimated (50). The first test compares the genetic trend in official evaluations that include data from multiple lactations with evaluations that include only first lactation data, and estimates of genetic trend should be similar for both. The second method compares estimates from subsequent evaluations to determine if breeding values change over time. If the PBV are calculated without bias, then the addition of daughter data over time should not change average PBV, just reliability.
Metrics Used.
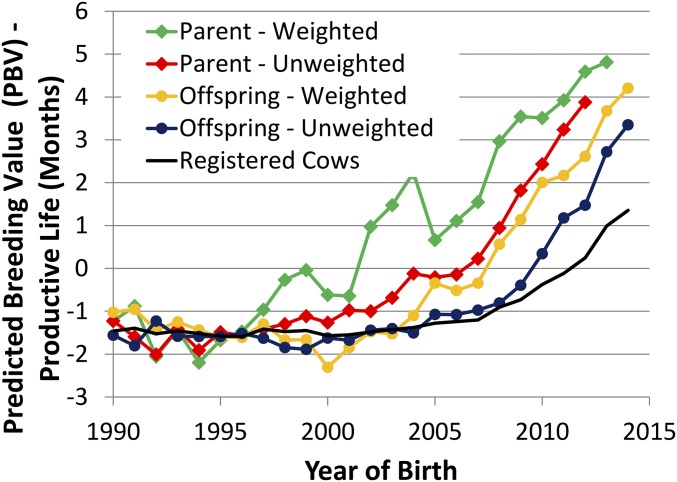
A comparison of genetic merit predictions (PBV) and SD showing the differences between weighted and unweighted averages, as well as the average parental value grouped by parent (sire or dam) or offspring (bull or cow) birth year, was done. To compare these approaches with the display of different averages of the same numbers, a sample based on PL of SB was explored in detail (Fig. S5). Again, all average values are different groupings of the parent generation (i.e., SB) PBV or SD.
Fig. S5.
Average PBV of Holstein SB for PL grouped by parent (sire) or offspring (bull) year of birth and weighted or unweighted by number of sons for each sire and average PL for cows registered in the national Holstein herdbook.
Weighting.
For the weighted average, the contribution of a parent was proportional to the number of offspring, whereas for the unweighted averages, all animals contributed equally. The weighted values were used because these values are more representative of the parents that were used (15). Falconer (51) also observed that weighted SD are the measure that is relevant to the response observed in offspring.
Generation.
The effect of choice of generation to use is a bit more complicated. The use of offspring birth year has a similar property as weighting; the average values better represent the genetic level of a “typical” offspring in that birth year. Examining the average PBV grouped by birth year of parent vs. offspring in Fig. S5, the most notable difference is the evidence of spikes in the values in the average PBV when grouped by parent birth year. Specifically, the sharp increase in the birth year 2004 can be attributed to two of 189 sires, representing 1,642 and 1,429 of a total of 6,986 sons, or 23% and 20% of the total number of offspring. Those two bulls generated sons born across 5 y, and the fractions of sons born to each ranged from <1–10% for both of these sires across the 5 y.
Conclusions
The SD and GI were characterized in Holstein dairy cattle over time in a four-path selection model. Genetic gain was also characterized using segmented regression of PBV on birth year using 5-y segments. In the time since the introduction of genomic selection, sharp declines were made in GI, especially for the SB and SC paths. The SB GI were reduced from 7 to 2.5 y, whereas SB SD were stable to substantially increased. As a result, under genomic selection, the SB was the largest impact path across all of the traits considered. Similarly, the DB GI fell from 4 to 2.5 y, whereas the DB SD increased steadily for the yield traits and increased sharply for the lowly heritable traits. Similar to the SB pathway, under genomic selection, the DB pathway becomes the second largest driver of genetic improvement. SD were relatively stable for the yield traits, although modest gains were noted in recent years. The most dramatic response to genomic selection was observed for the lowly heritable traits DPR, PL, and SCS. Genetic trends improved substantially, resulting in rapid genetic improvement in these fitness traits. It is possible, or even likely, that relative selection emphases changed as genomic selection altered rates of genetic gain. These results clearly demonstrate the positive impact of genomic selection in US dairy cattle, even though this technology has only been in use for a short time. It is unlikely that a state of equilibrium has been reached, and these estimates may not reflect the full impact of genomic selection. Based on the four paths of selection model, rates of genetic gain per year increased from ∼50–100% for yield traits and from three- to fourfold for lowly heritable traits.
Acknowledgments
We acknowledge the significant improvements suggested by the reviewers. We thank the Council on Dairy Cattle Breeding and the Cooperative Dairy DNA Repository for providing data used in this study. J.B.C., P.M.V., and G.R.W. were supported by Agricultural Research Service (ARS)-USDA Appropriated Project 1245-31000-101-00, “Improving Genetic Predictions in Dairy Animals Using Phenotypic and Genomic Information.” C.P.V.T. was supported by ARS-USDA Appropriated Project 1245-31000-104-00, “Enhancing Genetic Merit of Ruminants through Genome Selection and Analysis.” A.G.-R. was supported by the National Council of Science and Technology and the National Autonomous University of Mexico. F.J.R.-L. and A.G.-R. were supported by Instituto Nacional de Investigaciones Forestales Agrícolas y Pecuarias Project 11402733072, “Aplicación de herramientas genómicas en el mejoramiento genético de la fertilidad del ganado Holstein productor de leche.”
Footnotes
The authors declare no conflict of interest.
This article is a PNAS Direct Submission.
Data deposition: The individual animal data summarized in this paper are maintained in the Council on Dairy Cattle Breeding (CDCB) (www.cdcb.us) database. The summarized data described in this paper can be obtained at dx.doi.org/10.15482/USDA.ADC/1256513. The authors confirm that some access restrictions apply to individual animal data, which are owned by a third party, the CDCB. A request to CDCB is necessary to obtain copies of those data, and requests may be sent to: João Dürr, CDCB Chief Executive Officer (joao.durr@cdcb.us).
See Commentary on page 7690.
This article contains supporting information online at www.pnas.org/lookup/suppl/doi:10.1073/pnas.1519061113/-/DCSupplemental.
References
- 1.Brotherstone S, Goddard M. Artificial selection and maintenance of genetic variance in the global dairy cow population. Philos Trans R Soc Lond B Biol Sci. 2005;360(1459):1479–1488. doi: 10.1098/rstb.2005.1668. [DOI] [PMC free article] [PubMed] [Google Scholar]
- 2.Robertson A, Rendel JM. The use of progeny testing with artificial insemination in dairy cattle. J Genet. 1950;50(1):21–31. doi: 10.1007/BF02986791. [DOI] [PubMed] [Google Scholar]
- 3.Meuwissen THE, Hayes BJ, Goddard ME. Prediction of total genetic value using genome-wide dense marker maps. Genetics. 2001;157(4):1819–1829. doi: 10.1093/genetics/157.4.1819. [DOI] [PMC free article] [PubMed] [Google Scholar]
- 4.Nejati-Javaremi A, Smith C, Gibson JP. Effect of total allelic relationship on accuracy of evaluation and response to selection. J Anim Sci. 1997;75(7):1738–1745. doi: 10.2527/1997.7571738x. [DOI] [PubMed] [Google Scholar]
- 5.König S, Simianer H, Willam A. Economic evaluation of genomic breeding programs. J Dairy Sci. 2009;92(1):382–391. doi: 10.3168/jds.2008-1310. [DOI] [PubMed] [Google Scholar]
- 6.Schaeffer LR. Strategy for applying genome-wide selection in dairy cattle. J Anim Breed Genet. 2006;123(4):218–223. doi: 10.1111/j.1439-0388.2006.00595.x. [DOI] [PubMed] [Google Scholar]
- 7.Meuwissen T, Goddard M. Accurate prediction of genetic values for complex traits by whole-genome resequencing. Genetics. 2010;185(2):623–631. doi: 10.1534/genetics.110.116590. [DOI] [PMC free article] [PubMed] [Google Scholar]
- 8.Hayes BJ, Bowman PJ, Chamberlain AJ, Goddard ME. Invited review: Genomic selection in dairy cattle: Progress and challenges. J Dairy Sci. 2009;92(2):433–443. doi: 10.3168/jds.2008-1646. [DOI] [PubMed] [Google Scholar]
- 9.Wiggans GR, Vanraden PM, Cooper TA. The genomic evaluation system in the United States: Past, present, future. J Dairy Sci. 2011;94(6):3202–3211. doi: 10.3168/jds.2010-3866. [DOI] [PubMed] [Google Scholar]
- 10.de Roos AP, Schrooten C, Veerkamp RF, van Arendonk JA. Effects of genomic selection on genetic improvement, inbreeding, and merit of young versus proven bulls. J Dairy Sci. 2011;94(3):1559–1567. doi: 10.3168/jds.2010-3354. [DOI] [PubMed] [Google Scholar]
- 11.Pryce JE, Goddard ME, Raadsma HW, Hayes BJ. Deterministic models of breeding scheme designs that incorporate genomic selection. J Dairy Sci. 2010;93(11):5455–5466. doi: 10.3168/jds.2010-3256. [DOI] [PubMed] [Google Scholar]
- 12.VanRaden PM, et al. Invited review: Reliability of genomic predictions for North American Holstein bulls. J Dairy Sci. 2009;92(1):16–24. doi: 10.3168/jds.2008-1514. [DOI] [PubMed] [Google Scholar]
- 13.Hutchison JL, Cole JB, Bickhart DM. Short communication: Use of young bulls in the United States. J Dairy Sci. 2014;97(5):3213–3220. doi: 10.3168/jds.2013-7525. [DOI] [PubMed] [Google Scholar]
- 14.Rendel JM, Robertson A. Estimation of genetic gain in milk yield by selection in a closed herd of dairy cattle. J Genet. 1950;50(1):1–8. doi: 10.1007/BF02986789. [DOI] [PubMed] [Google Scholar]
- 15.Van Tassell CP, Van Vleck LD. Estimates of genetic selection differentials and generation intervals for four paths of selection. J Dairy Sci. 1991;74(3):1078–1086. [Google Scholar]
- 16.Hodgson RE. Past, present, and future of the dairy herd improvement section. J Dairy Sci. 1964;47(3):310–315. [Google Scholar]
- 17.Miglior F, Muir BL, Van Doormaal BJ. Selection indices in Holstein cattle of various countries. J Dairy Sci. 2005;88(3):1255–1263. doi: 10.3168/jds.S0022-0302(05)72792-2. [DOI] [PubMed] [Google Scholar]
- 18.Van Tassell CP, Wiggans GR, Norman HD. Method R estimates of heritability for milk, fat, and protein yields of United States dairy cattle. J Dairy Sci. 1999;82(10):2231–2237. doi: 10.3168/jds.S0022-0302(99)75470-6. [DOI] [PubMed] [Google Scholar]
- 19.Welper RD, Freeman AE. Genetic parameters for yield traits of Holsteins, including lactose and somatic cell score. J Dairy Sci. 1992;75(5):1342–1348. doi: 10.3168/jds.S0022-0302(92)77885-0. [DOI] [PubMed] [Google Scholar]
- 20.Kuhn MT, Boettcher PJ, Freeman AE. Potential biases in predicted transmitting abilities of females from preferential treatment. J Dairy Sci. 1994;77(8):2428–2437. [Google Scholar]
- 21.Pedersen GA, Christensen LG, Petersen PH. Evaluation of breeding value and selection of bull dams in the Danish dairy breeds: I. Studies on realized efficiency of bull dam and bull sire selection. Acta Agric Scand. 1995;45(1):26–31. [Google Scholar]
- 22.Hadley GL, Wolf CA, Harsh SB. Dairy cattle culling patterns, explanations, and implications. J Dairy Sci. 2006;89(6):2286–2296. doi: 10.3168/jds.S0022-0302(06)72300-1. [DOI] [PubMed] [Google Scholar]
- 23.Johnson LA, Welch GR. Sex preselection: High-speed flow cytometric sorting of X and Y sperm for maximum efficiency. Theriogenology. 1999;52(8):1323–1341. doi: 10.1016/s0093-691x(99)00220-4. [DOI] [PubMed] [Google Scholar]
- 24.Seidel GE., Jr Superovulation and embryo transfer in cattle. Science. 1981;211(4480):351–358. doi: 10.1126/science.7194504. [DOI] [PubMed] [Google Scholar]
- 25.Pieterse MC, Kappen KA, Kruip TA, Taverne MA. Aspiration of bovine oocytes during transvaginal ultrasound scanning of the ovaries. Theriogenology. 1988;30(4):751–762. doi: 10.1016/0093-691x(88)90310-x. [DOI] [PubMed] [Google Scholar]
- 26.Pritchard T, Coffey M, Mrode R, Wall E. Understanding the genetics of survival in dairy cows. J Dairy Sci. 2013;96(5):3296–3309. doi: 10.3168/jds.2012-6219. [DOI] [PubMed] [Google Scholar]
- 27.Vitezica ZG, Aguilar I, Misztal I, Legarra A. Bias in genomic predictions for populations under selection. Genet Res. 2011;93(5):357–366. doi: 10.1017/S001667231100022X. [DOI] [PubMed] [Google Scholar]
- 28.VanRaden PM, Wright JR. Measuring genomic pre-selection in theory and in practice. Interbull Bulletin. 2013;47:147–150. [Google Scholar]
- 29.Aguilar I, et al. Hot topic: A unified approach to utilize phenotypic, full pedigree, and genomic information for genetic evaluation of Holstein final score. J Dairy Sci. 2010;93(2):743–752. doi: 10.3168/jds.2009-2730. [DOI] [PubMed] [Google Scholar]
- 30.Wiggans GR, Cooper TA, Vanraden PM, Cole JB. Technical note: Adjustment of traditional cow evaluations to improve accuracy of genomic predictions. J Dairy Sci. 2011;94(12):6188–6193. doi: 10.3168/jds.2011-4481. [DOI] [PubMed] [Google Scholar]
- 31.Schutz MM. Genetic evaluation of somatic cell scores for United States dairy cattle. J Dairy Sci. 1994;77(7):2113–2129. doi: 10.3168/jds.S0022-0302(94)77154-X. [DOI] [PubMed] [Google Scholar]
- 32.Shook GE, Schutz MM. Selection on somatic cell score to improve resistance to mastitis in the United States. J Dairy Sci. 1994;77(2):648–658. doi: 10.3168/jds.S0022-0302(94)76995-2. [DOI] [PubMed] [Google Scholar]
- 33.Miller RH, Norman HD, Wright JR, Cole JB. Impact of genetic merit for milk somatic cell score of sires and maternal grandsires on herd life of their daughters. J Dairy Sci. 2009;92(5):2224–2228. doi: 10.3168/jds.2008-1653. [DOI] [PubMed] [Google Scholar]
- 34.Hogeveen H, Huijps K, Lam TJ. Economic aspects of mastitis: New developments. N Z Vet J. 2011;59(1):16–23. doi: 10.1080/00480169.2011.547165. [DOI] [PubMed] [Google Scholar]
- 35.VanRaden PM. Invited review: Selection on net merit to improve lifetime profit. J Dairy Sci. 2004;87(10):3125–3131. doi: 10.3168/jds.S0022-0302(04)73447-5. [DOI] [PubMed] [Google Scholar]
- 36.VanRaden PM, Wiggans GR. Productive life evaluations: Calculation, accuracy, and economic value. J Dairy Sci. 1995;78(3):631–638. doi: 10.3168/jds.S0022-0302(95)76674-7. [DOI] [PubMed] [Google Scholar]
- 37.Weigel KA, Lawlor TJ, Jr, Vanraden PM, Wiggans GR. Use of linear type and production data to supplement early predicted transmitting abilities for productive life. J Dairy Sci. 1998;81(7):2040–2044. doi: 10.3168/jds.S0022-0302(98)75778-9. [DOI] [PubMed] [Google Scholar]
- 38.Dimitri C, Venezia KM. Retail and Consumer Aspects of the Organic Milk Market/LDP-M-155-01. US Department of Agriculture; Washington, DC: 2007. [Google Scholar]
- 39.Hurnik JF, Lehman H. Ethics and farm animal welfare. J Agric Ethics. 1988;1(4):305–318. [Google Scholar]
- 40.VanRaden PM, et al. Development of a national genetic evaluation for cow fertility. J Dairy Sci. 2004;87(7):2285–2292. doi: 10.3168/jds.S0022-0302(04)70049-1. [DOI] [PubMed] [Google Scholar]
- 41.Lucy MC. Reproductive loss in high-producing dairy cattle: Where will it end? J Dairy Sci. 2001;84(6):1277–1293. doi: 10.3168/jds.S0022-0302(01)70158-0. [DOI] [PubMed] [Google Scholar]
- 42.VanRaden PM, Smith LA. Selection and mating considering expected inbreeding of future progeny. J Dairy Sci. 1999;82(12):2771–2778. doi: 10.3168/jds.S0022-0302(99)75534-7. [DOI] [PubMed] [Google Scholar]
- 43.VanRaden PM, Olson KM, Wiggans GR, Cole JB, Tooker ME. Genomic inbreeding and relationships among Holsteins, Jerseys, and Brown Swiss. J Dairy Sci. 2011;94(11):5673–5682. doi: 10.3168/jds.2011-4500. [DOI] [PubMed] [Google Scholar]
- 44.Kim HJ, Fay MP, Feuer EJ, Midthune DN. Permutation tests for joinpoint regression with applications to cancer rates. Stat Med. 2000;19(3):335–351. doi: 10.1002/(sici)1097-0258(20000215)19:3<335::aid-sim336>3.0.co;2-z. [DOI] [PubMed] [Google Scholar]
- 45.Georges M, Massey JM. Velogenetics, or the synergistic use of marker assisted selection and germ-line manipulation. Theriogenology. 1991;35(1):151–159. [Google Scholar]
- 46.Haley CS, Visscher PM. Strategies to utilize marker-quantitative trait loci associations. J Dairy Sci. 1998;81(Suppl 2):85–97. doi: 10.3168/jds.s0022-0302(98)70157-2. [DOI] [PubMed] [Google Scholar]
- 47.Campbell KH, McWhir J, Ritchie WA, Wilmut I. Sheep cloned by nuclear transfer from a cultured cell line. Nature. 1996;380(6569):64–66. doi: 10.1038/380064a0. [DOI] [PubMed] [Google Scholar]
- 48.Wiggans GR, Misztal I, Van Vleck LD. Implementation of an animal model for genetic evaluation of dairy cattle in the United States. J Dairy Sci. 1988;71(Suppl 2):54–69. [Google Scholar]
- 49.SAS Institute . SAS/STAT 13.2 User’s Guide. SAS Institute; Cary, NC: 2014. [Google Scholar]
- 50.Boichard D, Bonaiti B, Barbat A, Mattalia S. Three methods to validate the estimation of genetic trend for dairy cattle. J Dairy Sci. 1995;78(2):431–437. doi: 10.3168/jds.S0022-0302(95)76652-8. [DOI] [PubMed] [Google Scholar]
- 51.Falconer DS. Introduction to Quantitative Genetics. Longman; London: 1981. [Google Scholar]


