Significance
Life history theory predicts that organisms can increase their fitness either by producing many offspring or by producing fewer, high-quality offspring. This “quality–quantity” trade-off is expected to be particularly salient for species such as humans that have extended offspring investment, but it may be obscured by cultural mechanisms, such as provisioning. We found strong evidence for quality–quantity trade-offs in chimpanzees, a closely related species with extensive maternal investment. Immature wild chimpanzees that were relatively young when their next sibling was born remained smaller throughout their juvenile years. Chimpanzee mothers with more resources appear to invest in faster reproduction rather than in more robust offspring. This strategy may have set the stage for rapid reproduction and postweaning investment in the human species.
Keywords: life history, growth, reproduction, primates, weaning
Abstract
Life history theory predicts a trade-off between offspring quality and quantity. Among large-bodied mammals, prolonged lactation and infant dependence suggest particularly strong potential for a quality–quantity trade-off to exist. Humans are one of the only such species to have been examined, providing mixed evidence under a peculiar set of circumstances, including extensive nutritional provisioning by nonmothers and extrasomatic wealth transmission. Here, we examine trade-offs between reproductive rate and one aspect of offspring quality (body size) in wild chimpanzees (Pan troglodytes schweinfurthii), a species with long periods of infant dependence and little direct provisioning. Juvenile lean body mass, estimated using urinary creatinine excretion, was positively associated with the interval to the next sibling’s birth. These effects persisted into adolescence and were not moderated by maternal identity. Maternal depletion could not explain poor offspring growth, as older mothers had larger offspring, and low maternal energy balance during lactation predicted larger, not smaller, juvenile size. Instead, our data suggest that offspring growth suffers when mothers wean early to invest in new reproductive efforts. These findings indicate that chimpanzee mothers with the resources to do so prioritize production of new offspring over prolonged investment in current offspring.
Parents face a fundamental life-history trade-off between producing more offspring and investing in the quality of each progeny (1–4). This offspring quality–quantity trade-off, along with a trade-off between reproductive investment and parental survival, means that maximizing reproductive rates is often not the strategy that maximizes fitness (5–7). The quality–quantity trade-off has been empirically demonstrated in species that produce litters or clutches, where large litter size often leads to small offspring size, slow growth rates, and reduced survival, particularly under conditions of ecological stress (8–11). Comparative analyses also support a negative interspecific relationship between reproductive rate and offspring size (12, 13). The quality–quantity trade-off has rarely been examined in species for which single births are the norm, and for which reproductive rate is determined by the interval between successive births. Such species are important tests of the model, as a slow breeding strategy suggests a particularly potent trade-off between offspring investment and reproductive rate. Understanding how individuals negotiate this trade-off can provide important insights into the evolution of reproductive biology and behavior.
Data on humans are valuable because humans invest intensively in offspring, yet have highly variable reproductive rates. Many studies find the predicted negative relationship between reproductive rates and offspring growth or health (14–18) or demonstrate fitness maximization at intermediate levels of fertility (19–21). For example, when a water tap was installed to reduce women’s workload in a rural Ethiopian community, birth rates increased, but child growth rates decreased, and more children were clinically stunted (22). Other studies fail to find evidence for a trade-off, reporting that the production of grandchildren continues to increase even at the highest levels of fertility (23–25). Still others report trade-offs only under certain conditions, such as resource scarcity (26). Even where genetic or physiological trade-offs exist, phenotypic correlations between life history traits may be weak or even positive if individuals vary significantly in their ability to invest (27, 28).
The human case is an unusual one. Although infants of most species are nutritionally independent after weaning, humans wean infants early and continue to provide nutrition for them for many years. Both mothers and their offspring are supplemented with resources from other group members, including fathers, grandparents, older siblings, and unrelated allies (29–32). As a consequence, trade-offs between reproductive rate and offspring quality are likely to be mitigated. In addition, many cases of fertility optimization in humans have an evolutionarily novel explanation: fitness in large families can be reduced not by poor physical health but by the limitations that inheritance places on the ability to marry and reproduce (18). Amid this complex cultural background, it is difficult not only to detect trade-offs but also to understand their effects on population structure and health. It is also unclear whether trade-offs occur because siblings compete for maternal resources or because maternal resources are depleted by rapid reproductive rates (33, 34).
Chimpanzees, which are close evolutionary relatives to humans, also experience prolonged periods of juvenile dependence characterized by intensive maternal investment in a single offspring (35). Chimpanzees are not weaned until ∼4–5 y of age and do not reach sexual maturity until their early teens (36, 37). Unlike humans, chimpanzee infants are rarely provisioned by their mothers or by other group members after weaning. This ancestral pattern of high demands for offspring care with little assistance is expected to generate stronger offspring quality–quantity trade-offs.
Here, we examine whether chimpanzee mothers experience a trade-off between reproductive rates and one particular measure of offspring quality: growth. We assessed this using longitudinal data from a community of wild East African chimpanzees (Pan troglodytes schweinfurthii) in the Kibale National Park, Uganda. We first assessed whether a juvenile chimpanzee’s body size was predicted by the interbirth interval preceding its birth and/or that following its birth. Reproductive rates in this population are strongly dependent on interindividual, as well as temporal, variation in resource access (37–41). Thus, although a trade-off between interbirth interval and juvenile size was predicted, it remained plausible that some mothers could afford to produce higher-quality infants at a faster rate. If so, we expected a negative association between interbirth interval and offspring size and/or a significant moderating effect of maternal identity. Quality–quantity trade-offs for infant growth might arise in two ways: via depletion of maternal resources by prior reproductive efforts, leading to reduced ability to invest in a current offspring, or via withdrawal of investment in the current offspring when a new offspring is born. If maternal depletion was occurring, juvenile size should be positively predicted by the length of the previous birth interval and negatively associated with maternal age. If offspring growth was affected by sibling competition, juvenile size should be reduced by short intervals to the next sibling’s birth. As a further test of whether maternal resources affect offspring growth, we examined whether maternal energy balance during lactation, assessed via urinary C-peptide of insulin, predicts juvenile size.
Methods
We studied the Kanyawara community of 50–60 wild chimpanzees in Kibale National Park, Uganda. Individual chimpanzees were first identified in 1983 (42), and the community has been followed continuously since 1987. The analysis concerned demographic data collected for the duration of the study to the present, and urine samples collected between November 1997 and July 2012. Research permissions were provided by the Ugandan National Council for Science and Technology, Makerere University Biological Field Station, the Uganda Wildlife Authority, and the Institutional Animal Care and Use Committees of Harvard and the University of New Mexico.
Juvenile body size was assessed using lean body mass estimates derived from the modified creatinine method (43). Urinary creatinine excretion over the course of 24 h is a well-validated clinical measure of lean body mass (44–47) that has been used to assess growth in human children (48). Our modification for using spot urine samples works on the principle that muscle mass modifies the relationship between specific gravity and creatinine, which are highly correlated measures of urine concentration. Whereas creatinine derives from creatine and phosphocreatine in muscle tissue (45), specific gravity is independent of muscle mass. In a validation with chimpanzees, we demonstrated that relative creatinine excretion was greater in adult males versus females and in mature versus immature individuals (43). This method enabled us to produce juvenile growth curves that closely mirrored those produced from direct measures of body mass (49).
To derive age-dependent estimates of lean body mass, we used general linear models (GLM) on urine samples from all chimpanzees in the study group to calculate the residuals of urinary creatinine (in mg/mL) against specific gravity (minus 1) and its quadratic transformation (adjusted R2 = 0.843; n = 16,191; P < 0.001). The intercept was set to zero, which is the equivalent of water. We excluded highly dilute samples (specific gravity < 1.003; n = 544), because residual variance was constrained near zero. This is a slight modification of our previous method, which assessed linear slopes for individual chimpanzees (SI Text and Fig. S1).
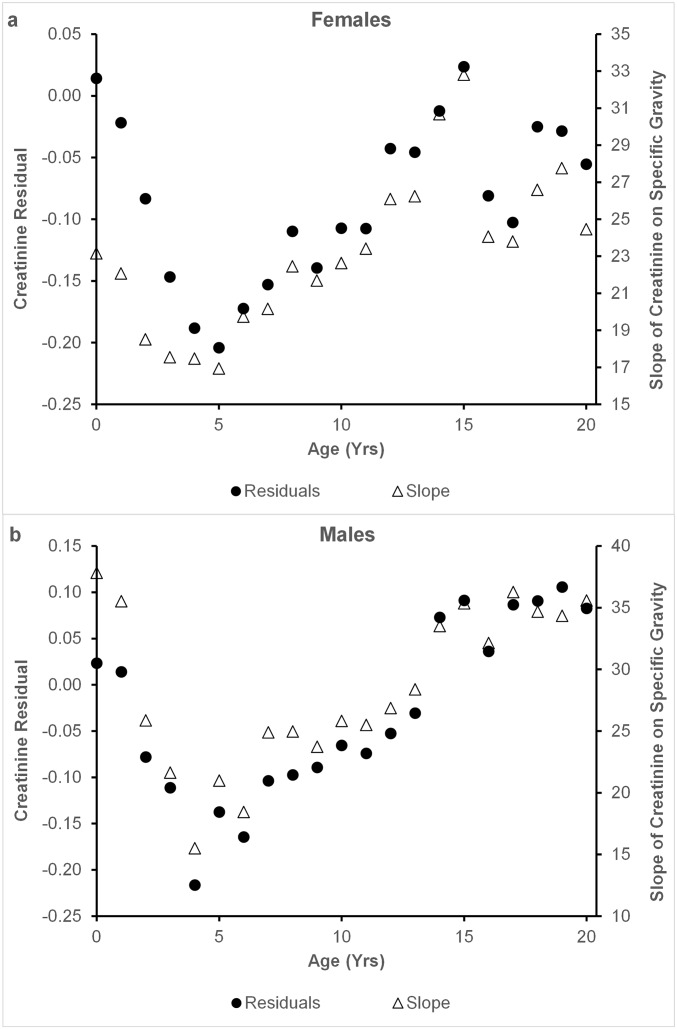
Fig. S1.
Estimates of lean body mass of young female (A) and male (B) chimpanzees derived from the relationship of creatinine to specific gravity in spot urine samples. The method used here, which uses residuals of a curvilinear model, provides comparable estimates to those obtained using linear regression slopes (as in ref. 1). Each point is the mean for individuals of that age.
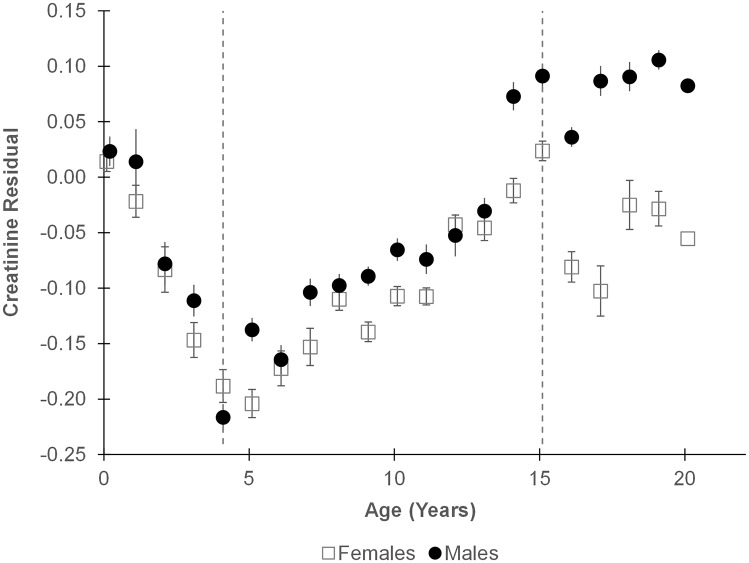
Few urine samples were obtained from infants younger than 4 y, and their residuals were unexpectedly high (Fig. 1). This is likely a limitation of using spot urine samples, as 24-h urinary creatinine excretion provides accurate assessments of growth in human infants, including neonates (50, 51). Infant chimpanzees produced small quantities of highly dilute urine with low creatinine levels and specific gravity (SI Text and Figs. S2–S4). Creatinine content of infants may also be skewed by enhanced protein intake during nursing (52) or by absorption of maternal creatine/creatinine through breastmilk (53, 54). As results for infants younger than 4 y were inconsistent with growth, they were excluded from further analysis. We restricted our analysis to the 5,335 samples obtained from 39 chimpanzees between the ages of 4.0 and 14.9 y (Fig. 1).
Fig. 1.
Age changes in the residual of specific gravity on creatinine during chimpanzee development. Each point represents the mean ± SEM residual for all samples from a 1-y age range. Dotted lines demarcate the range between 4.0 and 14.9 y that was considered in subsequent analyses.
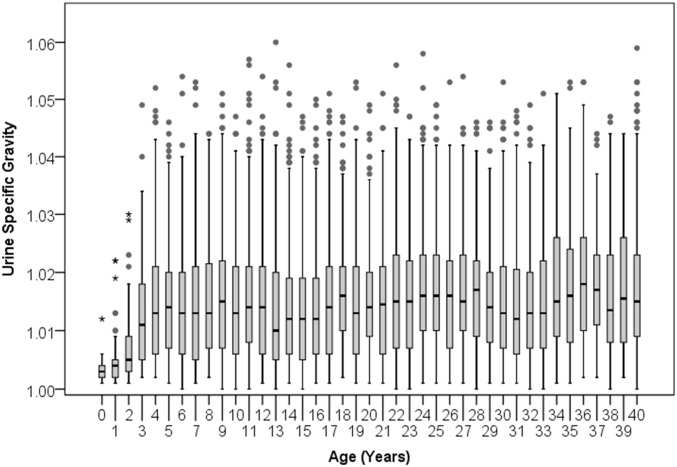
Fig. S2.
Distribution of urine specific gravity readings by chimpanzee age. Boxes span the interquartile range with horizontal line at the median; whiskers indicate 1.5× the interquartile range. Data for individuals aged 40 y and older are collapsed into one box.
Fig. S4.
Distribution of urinary creatinine readings in the subset of highly dilute urine samples (specific gravity < 1.003; n = 544) by chimpanzee age. Boxes span the interquartile range with horizontal line at the median, whiskers indicate 1.5× the interquartile range. Data for individuals aged 40 y and older are collapsed into one box.
Whereas creatinine excretion in a single 24-h urine sample can provide an accurate assessment of lean body mass, the use of spot urine requires repeated measurements (43). To facilitate this in a dataset in which individuals could not be sampled consistently across ages, we derived measures of creatinine excretion that were independent of age and sex. To do so, we remodeled the juvenile creatinine data, adding age and sex as covariates, along with their interaction effects with each other and with the specific gravity terms (GLM; adjusted R2 = 0.856; P < 0.001). Residuals of this model were normally distributed and were no longer correlated with age (r = 0.000; n = 5,335; P = 1.000) or different by sex (t = 0.000; males = 2,863, females = 2,472; P = 1.000). These residuals provide estimates as to whether an individual was larger or smaller than expected, similar to the weight-for-age measures used in many human growth studies.
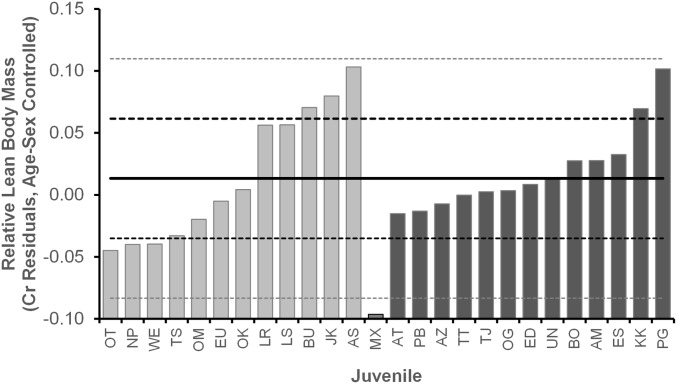
Our final sample consisted of creatinine residuals for 4,812 samples from 25 juveniles (mean = 190; range = 15–570 samples per juvenile). We excluded 14 individuals: eight were immigrant females whose mothers were not in the community, and five were poorly sampled (<10 samples). One additional excluded individual had lost both feet to wire hunting snares as a young juvenile, and he was an extreme outlier (2.3 SD below the mean) for low body size Fig. S5. Most subjects were sampled over at least half of the juvenile period (mean = 6.5 y/individual; range = 2–11 y). Final sample sizes for each analysis vary because of other requirements (e.g., complete birth interval, surviving sibling). To assess the influence of maternal reproductive rate on offspring size, we analyzed variation in the creatinine residuals, using linear mixed models (LMM), with birth intervals and/or maternal age as covariates and juvenile identity nested within mother as a random effect. These confirmed relationships obtained by the simpler method of correlating each individual’s average creatinine residual (across all samples) and the predictors of interest. These correlations are reported in the figures, where individual averages are shown.
Fig. S5.
Mean creatinine residuals of 26 juvenile chimpanzees investigated in the study (males, dark bars; females, light bars). MX had two snare injuries as a juvenile, resulting in the amputation of both feet. He was an outlier for small body size and, thus, excluded from further analysis. Solid black line indicates the mean residual for individual juveniles; dashed lines demarcate 1 and 2 SDs.
Infant birthdates were estimated on the basis of the appearance of the infant at first observation and interval to the last observation of the mother without the infant. Of 21 juveniles in the study with a younger sibling, we can estimate the birth interval for 18 with an error of <1 mo. In the remaining three cases, one (but not both) of the bracketing birthdates was estimated with a potential error of more than a month. Of 15 juveniles with a surviving older sibling, who may have been born before continuous observations of the community, nine of the interceding birth intervals were known to <1 mo. Because female chimpanzees disperse between communities at sexual maturity, all maternal ages were estimated. However, because dispersal occurs within a narrow age range (37), we are confident in the relative ages of our mothers based on their first observations in the community.
To evaluate whether maternal energetic condition influenced offspring body size, we examined urinary C-peptide of insulin levels (standardized to specific gravity) for mothers during the first year of nursing the offspring concerned (methods, ref. 39). C-peptide is a well-validated marker of energy balance in primates (55–59). In lactating mothers, it is a useful tool to assess the metabolic load of milk production relative to the total energy budget (39, 55, 60). Because there are longitudinal changes in insulin secretion over the course of lactation (39), we calculated z-scores that corrected monthly C-peptide levels during each lactation period to the mean and SD for the equivalent month postpartum in other lactation periods (n = 27 reference periods from ref. 39). For mothers with at least 3 mo of data, we averaged across months to obtain the relative C-peptide concentration for the first year of nursing.
Results
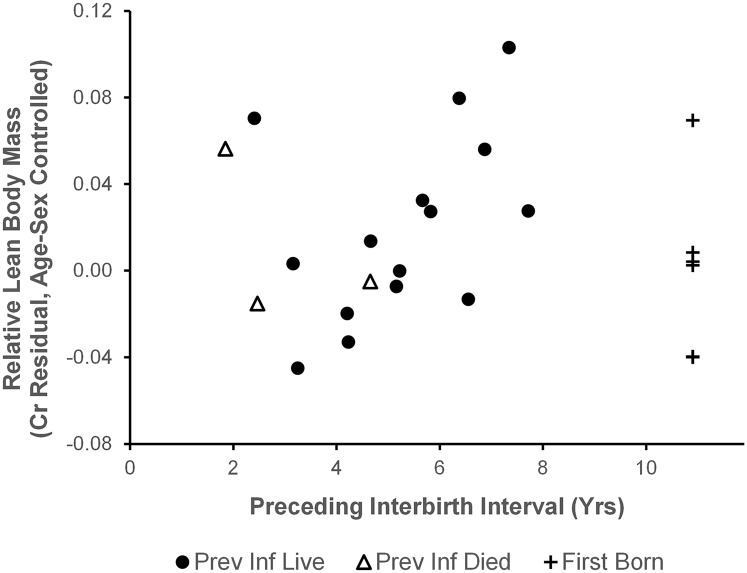
Our dataset included 15 juveniles whose older sibling had survived to 4 y of age. Body size was not significantly predicted by the interval between the subject’s birth and the birth of the previous sibling [LMM, parameter estimate (Est) = 0.008; F = 1.177; df = 12.6; P = 0.298; Fig. 2]. Because these intervals extended back to early years of the study, the lengths of six of them were estimated. There was no significant association between the preceding birth interval and juvenile size in the sample of nine individuals with birth intervals known to the nearest month (Est = −0.007; F = 0.472; df = 8.4; P = 0.511). Five first-born infants ranged from large to small in size.
Fig. 2.
Association between preceding birth interval and estimated lean body mass of juveniles. Points indicate the mean creatinine residuals, corrected for age and sex, for each juvenile chimpanzee. Positive values indicate an individual was larger than expected for age/sex. Statistical analysis concerned only juveniles whose older sibling survived to age 4 y (circles, n = 15; r = 0.427; P = 0.112). First-born offspring (crosses, n = 6) and those whose older siblings died during infancy (open triangles, n = 3) are plotted for comparison.
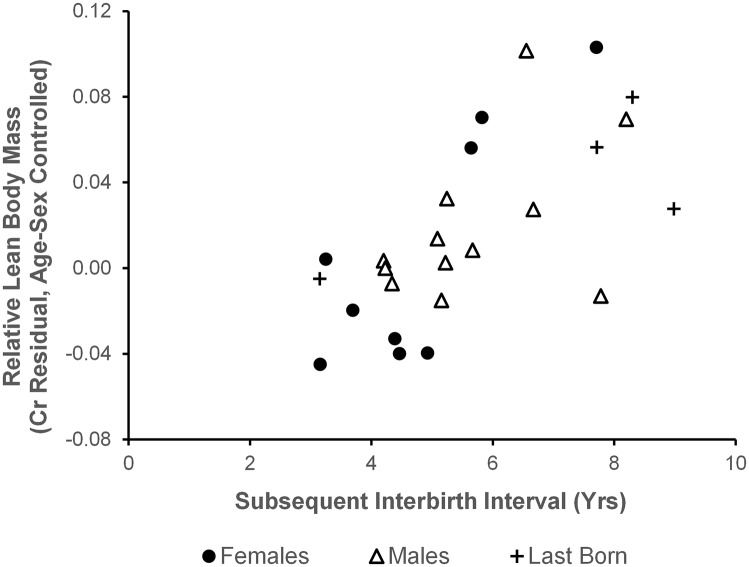
For the 21 juveniles with younger siblings, body size was strongly and positively predicted by the interval to the birth of that next sibling (Est = 0.019; F = 12.397; df = 19.6; P = 0.002; Fig. 3). This relationship held when the three estimated birth intervals were excluded (Est = 0.017; F = 6.658; df = 10.2; P = 0.027). The sizes of last-born offspring were consistent with this relationship: one whose mother died before the typical age of weaning was among the smaller juveniles in the study, whereas three infants whose mothers died after they reached age 7 y were relatively large.
Fig. 3.
Association between subsequent birth interval and estimated lean body mass of juveniles (n = 21; r = 0.662; P = 0.001). Points indicate the mean creatinine residuals, corrected for age and sex, for each juvenile chimpanzee. Positive values indicate that an individual was larger than expected for age/sex. Last-born offspring (crosses, n = 4) are plotted for comparison.
In cases in which both birth intervals were known, there was a positive correlation between the interval before and after the births of the juveniles in our dataset (r = 0.657; n = 13; P = 0.015), suggesting individual mothers had consistent reproductive rates. Some mothers were represented by more than one juvenile in our dataset (n = 1–4). However, zero variance could be assigned to maternal identity in the model for subsequent birth intervals. As an additional check for bias resulting from multiple offspring from the same mother, we reran the analysis using only one offspring per mother, the most recent completed birth interval (n = 12). The association between the first offspring’s size and the interval to the next sibling remained positive, with minimal change to the effect size (Est = 0.018; F = 6.083; df = 9.8; P = 0.034).
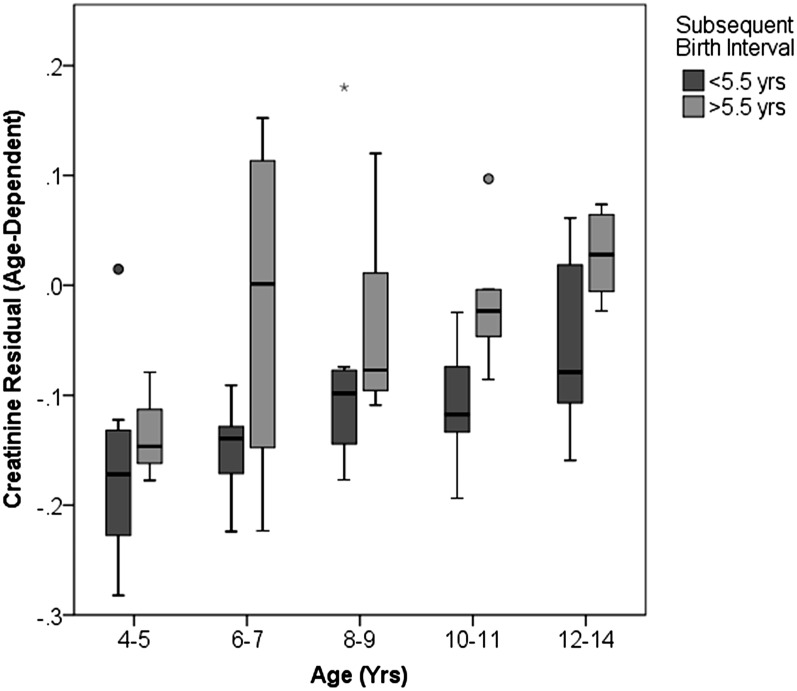
The residuals used in our analysis were corrected for sex, but we reintroduced sex into our model as an interaction to test whether the effect of reproductive rate on offspring size differed for males and females. Although the effect was slightly stronger for females, the interaction was not statistically significant (Est = 0.020; F = 3.079; df = 18.9; P = 0.096). Similarly, we tested for an age interaction to determine whether the effect of a short birth interval on offspring size attenuated with age. There was no significant interaction with age (Est = 0.002; F = 2.733; df = 2.7; P = 0.099). The negative effect of a short birth interval on juvenile size tended to increase, rather than decrease, with age (Fig. 4). This suggests that adult body size is affected.
Fig. 4.
Effects of interbirth interval on juvenile growth across the juvenile period, depicting uncorrected residuals to show changes with age. Boxplots indicate median and interquartile range across individuals (n = 3–12 individuals per box). Most subjects were represented in more than one age category.
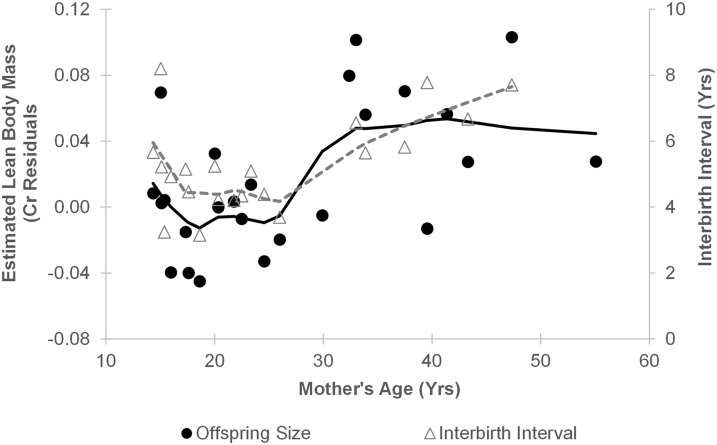
Offspring size increased significantly with maternal age (Est = 0.002; F = 8.392; df = 28.2; P = 0.007). The older mothers in our sample also had longer birth intervals (r = 0.544; n = 21; P = 0.011), consistent with reproductive senescence. These age effects closely mirrored each other (Fig. 5). When maternal age and the length of the subsequent birth interval were considered together, only birth interval explained a significant amount of variance in juvenile size (Est = 0.015; F = 5.548; df = 19.7; P = 0.029; effect of maternal age: Est = 0.001; F = 1.150; df = 23.1; P = 0.295).
Fig. 5.
The effects of maternal age on offspring body size (n = 25) closely mirrored its effects on interbirth interval (n = 21). Lines fit via loess smoothing (α = 0.5).
For 13 of the juveniles in this study, mothers were sampled during the first year of lactation to obtain C-peptide of insulin levels, with higher levels indicative of lower energetic stress during milk production (39). Mothers did not have lower C-peptide after experiencing a shorter birth interval (r = 0.565; n = 9; P = 0.113). Furthermore, maternal C-peptide did not predict the size of her offspring (Est = −0.018; F = 0.617; df = 11.3; P = 0.448). Controlling for maternal age, which was positively correlated to C-peptide (r = 0.638; n = 13; P = 0.019), maternal C-peptide was negatively associated with offspring size (Est = −0.050; F = 8.266; df = 9.4; P = 0.017). Small juveniles were not those whose mothers were energetically stressed while nursing them.
Discussion
Here, we demonstrate an offspring quality–quantity trade-off in wild chimpanzees. Chimpanzees whose younger siblings were born after a relatively short period had lower lean body mass markers, suggesting mothers experience a trade-off between reproductive rate and offspring quality. This relationship also predicted the effects of maternal age on offspring size: older mothers produced larger offspring as a result of their declining reproductive rates. We found no evidence that maternal identity mediated these effects, and maternal age did not affect offspring size independent of its effect on birth intervals. Thus, mothers with more resources appeared to invest in faster reproduction, rather than improved offspring growth.
Short birth intervals might compromise offspring investment in at least two ways. First, mothers with faster reproductive rates may experience depletion of energetic reserves or other aspects of physical health and be less able to invest in later offspring (33, 34). This is a favored explanation for offspring quality–quantity trade-offs in humans (34), although most studies only examine infant outcomes in relation to the interval preceding birth. Several factors suggest that maternal depletion does not explain the observed relationship between short birth intervals and small offspring size in chimpanzees. The maternal depletion hypothesis predicts that smaller offspring should follow shorter birth intervals. We found that offspring size was predicted by the interval after its birth, rather than the interval preceding it. Maternal depletion effects should also result in smaller offspring with advanced maternal age, but we found that maternal age had a positive effect on offspring size, chiefly because older mothers reproduced more slowly. Finally, maternal C-peptide of insulin, a marker of energy balance, negatively predicted offspring size. This suggests that energetic stress on nursing mothers could not explain poor offspring growth. However, C-peptide only tells us about the effects of lactation on mothers, and not about the nutrition provided to offspring. It is possible that mothers with high C-peptide were those that had conserved energy by investing less in breastmilk, compromising offspring growth. However, our previous research with nursing chimpanzees indicates that high C-peptide levels are associated with improved resource access (39, 40), a robust predictor of fecundity in this species (38, 41). High C-peptide levels during lactation predict earlier resumption of cycling in both chimpanzees (39, 40) and humans (60, 61). This suggests that the negative association between maternal C-peptide and offspring size emerged because mothers who were better able to afford the costs of lactation reproduced again sooner.
Thus, a second, more plausible, explanation for our findings is that faster reproductive rates compromised offspring growth because mothers stopped investing in one offspring relatively early to begin investing in the next. Infant chimpanzees are able to begin eating solid foods at about 6 mo of age (36, 62). The onset of independent feeding in larger primates likely occurs when mothers can no longer supply all the calories the growing infant needs (63, 64), although mothers still provide the majority of infant nutrition for quite some time (65) and provide an important buffer against resource scarcity. Although chimpanzee infants are often not fully weaned until 4–5 y (36, 62), many of the birth intervals in our study were less than 4 y, suggesting premature withdrawal of nutritional investment. Because larger bodies are more costly, slow growth in primate juveniles is thought to be an adaptation to minimize the risk for starvation when resources are unstable (66). Early weaning and loss of the maternal buffer may set juveniles on a trajectory for slow growth. Consistent with this, we had no evidence that chimpanzees made up for deficits in growth later in the juvenile period.
These data suggest that maternal weaning decisions in chimpanzees may not adapt to infant developmental progress, as in many smaller mammals (67), but can be compelled by the return to fertility. This finding tempers the common assumption that breastfeeding regulates the birth interval (68–70), indicating important opposing influences. For species with multiyear lactation, for which weaning is a slow and gradual process, it is not uncommon for infants to be weaned only when the next offspring is conceived [e.g., Pongo pygmaeus (65); Loxodonta africana (71); Tursiops sp (72); Homo sapiens (73)]. Our data also suggest that mothers in good condition may not anticipate shorter periods of provisioning by providing more calories to infants per day. Given that energy availability varies temporally as much as it does across individuals, this could be a risky strategy.
Our study used a noninvasive methodology to evaluate body size, an important advance given the limitations of obtaining body weights on a regular basis for many wild animals. This method generates juvenile growth trajectories that closely approximate those produced using conventional body weights (43, 49). Creatinine production is specifically diagnostic of muscle mass (44, 46, 47, 74–77), one dimension of overall body size. It is possible that there is important variance in fat mass or long bone growth not accounted for in this study. However, urinary creatinine was strongly associated with height variation among human children (48). In the chimpanzee’s sister species, bonobos (Pan paniscus), variance in muscle significantly predicted body mass (r = 0.682; n = 13; P = 0.010), whereas the contributions of bone and fat were negligible (78). Our method limited our ability to detect variation in infant muscle mass because of the difficulty of sampling infants and unusually high creatinine excretion in individuals younger than 4 y. Thus, we cannot at this point evaluate how reproductive rates and maternal energetics affect the size of young infants, or whether growth rates slow down specifically after weaning. Our data were consistent with a report on baboons indicating that differences in offspring size were relatively persistent across the juvenile period (79).
Our study evaluates only one dimension of offspring quality. Body size is a strong predictor of infant and juvenile survival in a wide range of animals, including some lizards (80), fish (81), birds (82, 83), rodents (84, 85), pinnipeds (86, 87), deer (88, 89), and primates (90). Although these effects are often attributable to predation, similar effects are seen in humans, for which both low birthweight and poor growth compromise long-term health and well-being (91–94). The importance of body size for fitness is not well documented in primates and is unknown for chimpanzees. None of the juveniles sampled over the course of our study died, and juvenile mortality is relatively low in chimpanzees versus other primates (95, 96). However, body growth may also exert an important influence on fitness via its effects on adult reproductive opportunities. Female body size is related to fertility in many species (97–101). Male body size, and muscle mass in particular, is expected to affect competitive ability, an important determinant of reproductive access (102–106). Other factors, such as social relationships and sperm competition, may be of greater importance to fitness in some primates (107). Accordingly, a recent study of Assamese macaques reported that juvenile growth rates were compromised by investment in locomotor play, suggesting the fitness advantages of developing motor and social skills might counteract the costs of slow growth (108). If the contribution of body mass to fitness is relatively small in chimpanzees, the point of diminishing returns for offspring investment may be lower than expected. Finally, although our study addresses maternal influences on offspring growth, it does not address potential paternal influences. Although male chimpanzees do not provision their young, they may have important genetic or epigenetic influences on offspring size (109, 110).
Our results indicate that individual chimpanzee females maximize reproductive rates at the expense of investment in each offspring. This is counterintuitive, given that, as a general rule, chimpanzees exhibit a conservative pattern of reproductive investment, with high sensitivity to energetic stress and among the longest birth intervals of any animal (37, 111). In female chimpanzees, as in humans, maternal energy reserves are important determinants of reproductive function (39, 111), perhaps because maintaining maternal health is vital for offspring survival through long periods of dependency. However, chimpanzee mothers also face an environment in which resource availability is unpredictable, suggesting selection may favor females who reproduce again as soon as they can afford to do so. This evolutionary backdrop may have provided an important template for the human species, which, with the addition of extrasomatic provisioning, routinely sustains reproductive rates at the low end of the chimpanzee distribution.
Our study documents the association between maternal birth rates and offspring body size in wild chimpanzees. To estimate juvenile size noninvasively, we calculated the residual of the quadratic relationship between urinary specific gravity and creatinine in spot urine samples collected from wild chimpanzees. The method used here is a statistical improvement of the method we previously reported, which involved obtaining individualized linear regression slopes (43). This procedure produces comparable estimates and realistic growth trajectories (Fig. S1), but offers two improvements: it allows us to model the slight quadratic relationship of creatinine to specific gravity, better fitting the data, and the larger sample roots the curve, buffering estimates against instability resulting from small individual sample sizes.
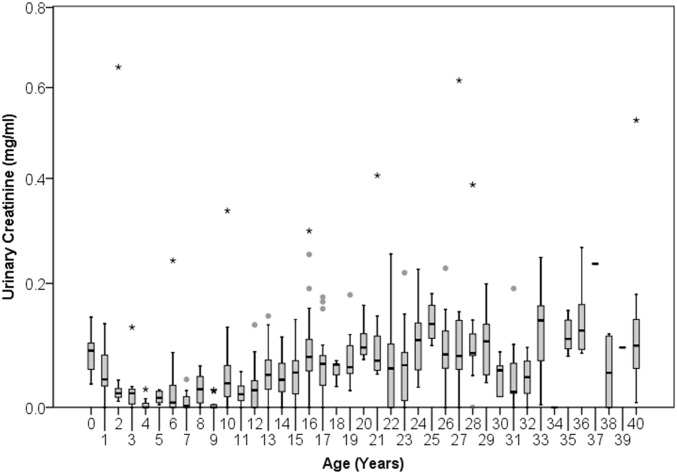
Residuals were high among infants, declining from ages 0–4 y before increasing in a linear growth trend between ages 4 and 15 y (Fig. 1). This was unexpected because 24-h urinary creatinine excretion has been used to assess relative body mass and growth in human infants, including neonates (50, 51). Our data suggest spot urine samples are not appropriate to evaluate lean body mass in infant chimpanzees. One reason may be that urine of infants is very dilute. Both specific gravity readings (Fig. S2) and creatinine concentrations (Fig. S3) in urine from infants were substantially lower than those from older individuals. Because creatinine values cannot be negative, this constrains residual variation. Highly dilute samples, if they represent short intervals between urinations, may also be more susceptible to irregular variation in creatinine clearance. For these reasons, we excluded highly dilute samples (specific gravity < 1.003) from our analyses. Notably, by age 4 y, specific gravity readings did not differ from those of adults (Fig. S2).
Fig. S3.
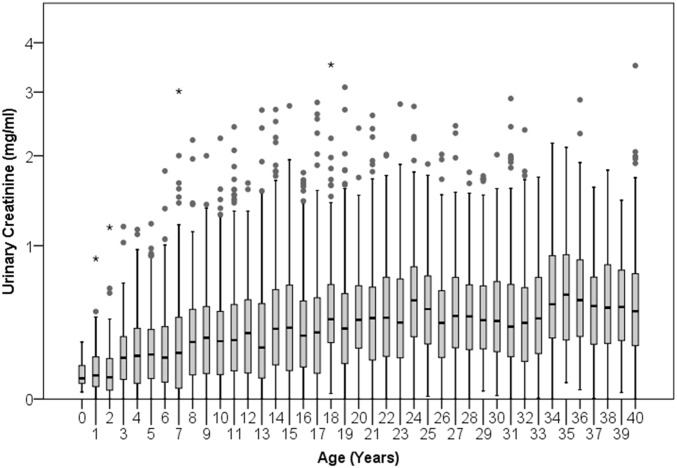
Distribution of urinary creatinine readings by chimpanzee age. Boxes span the interquartile range with horizontal line at the median; whiskers indicate 1.5× the interquartile range. Data for individuals aged 40 y and older are collapsed into one box.
However, this does not fully explain the high residuals of infants. Residuals for infants were high even after we excluded dilute samples. Furthermore, even among the most dilute samples, those from infants had relatively high creatinine concentrations (Fig. S4). Therefore, it is plausible that infant creatinine levels may be skewed by enhanced protein ingestion during nursing (52) or by direct absorption of maternal creatine/creatinine through breastmilk (53, 54).
One individual (MX) was excluded from our main analysis because he had suffered snare-related amputations of both feet and was considerably smaller than other individuals (Fig. S5).
Acknowledgments
We thank the field staff of the Kibale Chimpanzee Project for daily chimpanzee observations. Drew Enigk, Jayda Patterson, Sarah Schmidt, Erin Fitzgerald, Sarah Phillips-Garcia, and Thais Schwartz provided laboratory assistance. We thank the associate editor and two reviewers for insightful feedback. Research was supported by the Leakey Foundation, Wenner-Gren Foundation, National Science Foundation (Grants 1355014 and 0849380), and the National Institute on Aging of the National Institutes of Health (Award R01AG049395).
Footnotes
The authors declare no conflict of interest.
This article is a PNAS Direct Submission. D.W. is a guest editor invited by the Editorial Board.
This article contains supporting information online at www.pnas.org/lookup/suppl/doi:10.1073/pnas.1522168113/-/DCSupplemental.
References
- 1.Lack D. The significance of clutch‐size. Ibis. 1947;89(2):302–352. [Google Scholar]
- 2.Lack D. The Natural Regulation of Animal Numbers. Oxford Univ Press; Oxford, UK: 1954. [Google Scholar]
- 3.Smith CC, Fretwell SD. The optimal balance between size and number of offspring. Am Nat. 1974;108(962):499–506. [Google Scholar]
- 4.Hill K, Kaplan H. Life history traits in humans: Theory and empiricial studies. Annu Rev Anthropol. 1999;28:397–430. doi: 10.1146/annurev.anthro.28.1.397. [DOI] [PubMed] [Google Scholar]
- 5.Williams GC. Natural selection, the costs of reproduction, and a refinement of Lack’s principle. Am Nat. 1966;100(916):687–690. [Google Scholar]
- 6.Charnov EL, Krebs JR. On clutch‐size and fitness. Ibis. 1974;116(2):217–219. [Google Scholar]
- 7.Stearns SC. The Evolution of Life Histories. Oxford Univ Press; New York: 1992. [Google Scholar]
- 8.Randolph PA, Randolph J, Mattingly K, Foster MM. Energy costs of reproduction in the cotton rat, Sigmodon hispidus. Ecology. 1977;58(1):31–45. [Google Scholar]
- 9.Fuchs S. Optimality of parental investment: The influence of nursing on reproductive success of mother and female young house mice. Behav Ecol Sociobiol. 1982;10(1):39–51. [Google Scholar]
- 10.Mattingly DK, McClure PA. Energetics of reproduction in large-littered cotton rats (Sigmodon hispidus) Ecology. 1982;63(1):183–195. [Google Scholar]
- 11.Humphries MM, Boutin S. The determinants of optimal litter size in free-ranging red squirrels. Ecology. 2000;81(10):2867–2877. [Google Scholar]
- 12.Charnov EL, Ernest SK. The offspring-size/clutch-size trade-off in mammals. Am Nat. 2006;167(4):578–582. doi: 10.1086/501141. [DOI] [PubMed] [Google Scholar]
- 13.Walker RS, Gurven M, Burger O, Hamilton MJ. The trade-off between number and size of offspring in humans and other primates. Proc Biol Sci. 2008;275(1636):827–833. doi: 10.1098/rspb.2007.1511. [DOI] [PMC free article] [PubMed] [Google Scholar]
- 14.Blurton Jones N. Bushman birth spacing: A test for optimal interbirth intervals. Ethol Sociobiol. 1986;7(2):91–105. [Google Scholar]
- 15.Hobcraft J, McDonald JW, Rutstein S. Child-spacing effects on infant and early child mortality. Popul Index. 1983;49(4):585–618. [Google Scholar]
- 16.Hobcraft J. Fertility patterns and child survival: A comparative analysis. Popul Bull UN. 1992;(33):1–31. [PubMed] [Google Scholar]
- 17.Hagen EH, Barrett HC, Price ME. Do human parents face a quantity-quality tradeoff?: Evidence from a Shuar community. Am J Phys Anthropol. 2006;130(3):405–418. doi: 10.1002/ajpa.20272. [DOI] [PubMed] [Google Scholar]
- 18.Lawson DW, Alvergne A, Gibson MA. The life-history trade-off between fertility and child survival. Proc Roy Sci B. 2012;279(1748):4755–4764. doi: 10.1098/rspb.2012.1635. [DOI] [PMC free article] [PubMed] [Google Scholar]
- 19.Borgerhoff Mulder M. Borgerhoff Mulder M Optimizing offspring: The quantity-quality tradeoff in agropastoral Kipsigis. Evol Hum Behav. 2000;21(6):391–410. doi: 10.1016/s1090-5138(00)00054-4. [DOI] [PubMed] [Google Scholar]
- 20.Mace R. Biased parental investment and reproductive success in Gabbra pastoralists. Behav Ecol Sociobiol. 1996;38(2):75–81. doi: 10.1007/s002650050219. [DOI] [PubMed] [Google Scholar]
- 21.Meij JJ, et al. Quality-quantity trade-off of human offspring under adverse environmental conditions. J Evol Biol. 2009;22(5):1014–1023. doi: 10.1111/j.1420-9101.2009.01713.x. [DOI] [PubMed] [Google Scholar]
- 22.Gibson MA, Mace R. An energy-saving development initiative increases birth rate and childhood malnutrition in rural Ethiopia. PLoS Med. 2006;3(4):e87. doi: 10.1371/journal.pmed.0030087. [DOI] [PMC free article] [PubMed] [Google Scholar]
- 23.Kaplan HS, Lancaster JB, Johnson SE, Bock JA. Does observed fertility maximize fitness among New Mexican men? A test of an optimality model and a new theory of parental investment in the embodied capital of offspring. Hum Nat. 1995;6(4):325–360. doi: 10.1007/BF02734205. [DOI] [PubMed] [Google Scholar]
- 24.Pennington R, Harpending H. Fitness and fertility among Kalahari! Kung. Am J Phys Anthropol. 1988;77(3):303–319. doi: 10.1002/ajpa.1330770304. [DOI] [PubMed] [Google Scholar]
- 25.Hill KR, Hurtado AM. Ache Life History: The Ecology and Demography of a Foraging People. Aldine Transaction; New York: 1996. [Google Scholar]
- 26.Gillespie DO, Russell AF, Lummaa V. When fecundity does not equal fitness: Evidence of an offspring quantity versus quality trade-off in pre-industrial humans. Proc Biol Sci. 2008;275(1635):713–722. doi: 10.1098/rspb.2007.1000. [DOI] [PMC free article] [PubMed] [Google Scholar]
- 27.Lande R. A quantitative genetic theory of life history evolution. Ecology. 1982;63(3):607–615. [Google Scholar]
- 28.van Noordwijk AJ, de Jong G. Acquisition and allocation of resources: Their influence on variation in life history tactics. Am Nat. 1986;128(1):137–142. [Google Scholar]
- 29.Hawkes K, O’Connell JF, Jones NG, Alvarez H, Charnov EL. Grandmothering, menopause, and the evolution of human life histories. Proc Natl Acad Sci USA. 1998;95(3):1336–1339. doi: 10.1073/pnas.95.3.1336. [DOI] [PMC free article] [PubMed] [Google Scholar]
- 30.Reiches MW, et al. Pooled energy budget and human life history. Am J Hum Biol. 2009;21(4):421–429. doi: 10.1002/ajhb.20906. [DOI] [PubMed] [Google Scholar]
- 31.Kramer KL, Ellison PT. Pooled energy budgets: Resituating human energy‐allocation trade‐offs. Evol Anthropol. 2010;19(4):136–147. [Google Scholar]
- 32.Hooper PL, Gurven M, Winking J, Kaplan HS. Inclusive fitness and differential productivity across the life course determine intergenerational transfers in a small-scale human society. Proc Roy Sci B. 2015;282(1803):20142808. doi: 10.1098/rspb.2014.2808. [DOI] [PMC free article] [PubMed] [Google Scholar]
- 33.Winkvist A, Rasmussen KM, Habicht J-P. A new definition of maternal depletion syndrome. Am J Public Health. 1992;82(5):691–694. doi: 10.2105/ajph.82.5.691. [DOI] [PMC free article] [PubMed] [Google Scholar]
- 34.Winikoff B. The effects of birth spacing on child and maternal health. Stud Fam Plann. 1983;14(10):231–245. [PubMed] [Google Scholar]
- 35.Goodall J. The Chimpanzees of Gombe: Patterns of Behavior. Belknap Press of Harvard Univ Press; Cambridge, MA: 1986. [Google Scholar]
- 36.Clark CB. A preliminary report on weaning among chimpanzees of the Gombe National Park, Tanzania. In: Chevalier-Skolnikoff S, Poirier F, editors. Primate Bio-Social Development. Garland Press; New York: 1977. pp. 235–250. [Google Scholar]
- 37.Emery Thompson M. Reproductive ecology of female chimpanzees. Am J Primatol. 2013;75(3):222–237. doi: 10.1002/ajp.22084. [DOI] [PubMed] [Google Scholar]
- 38.Emery Thompson M, Kahlenberg SM, Gilby IC, Wrangham RW. Core area quality is associated with variance in reproductive success among female chimpanzees at Kibale National Park. Anim Behav. 2007;73(3):501–512. [Google Scholar]
- 39.Emery Thompson M, Muller MN, Wrangham RW. The energetics of lactation and the return to fecundity in wild chimpanzees. Behav Ecol. 2012;23(6):1234–1241. [Google Scholar]
- 40.Emery Thompson M, Muller MN, Wrangham RW. Male chimpanzees compromise the foraging success of their mates in Kibale National Park, Uganda. Behav Ecol Sociobiol. 2014;68(12):1973–1983. [Google Scholar]
- 41.Emery Thompson M, Wrangham RW. Diet and reproductive function in wild female chimpanzees (Pan troglodytes schweinfurthii) at Kibale National Park, Uganda. Am J Phys Anthropol. 2008;135(2):171–181. doi: 10.1002/ajpa.20718. [DOI] [PubMed] [Google Scholar]
- 42.Isabirye-Basuta G. Feeding ecology of chimpanzees in the Kibale Forest, Uganda. In: Heltne PG, Marquardt LA, editors. Understanding Chimpanzees. Harvard Univ Press; Cambridge, MA: 1989. pp. 116–127. [Google Scholar]
- 43.Emery Thompson M, Muller MN, Wrangham RW. Technical note: Variation in muscle mass in wild chimpanzees: Application of a modified urinary creatinine method. Am J Phys Anthropol. 2012;149(4):622–627. doi: 10.1002/ajpa.22157. [DOI] [PubMed] [Google Scholar]
- 44.Baxmann AC, et al. Influence of muscle mass and physical activity on serum and urinary creatinine and serum cystatin C. Clin J Am Soc Nephrol. 2008;3(2):348–354. doi: 10.2215/CJN.02870707. [DOI] [PMC free article] [PubMed] [Google Scholar]
- 45.Heymsfield SB, Arteaga C, McManus C, Smith J, Moffitt S. Measurement of muscle mass in humans: Validity of the 24-hour urinary creatinine method. Am J Clin Nutr. 1983;37(3):478–494. doi: 10.1093/ajcn/37.3.478. [DOI] [PubMed] [Google Scholar]
- 46.Van Niekerk BD, Reid JT, Bensadoun A, Paladines OL. Urinary creatine as an index of body composition. J Nutr. 1963;79(4):463–473. doi: 10.1093/jn/79.4.463. [DOI] [PubMed] [Google Scholar]
- 47.Wang Z-M, Gallagher D, Nelson ME, Matthews DE, Heymsfield SB. Total-body skeletal muscle mass: Evaluation of 24-h urinary creatinine excretion by computerized axial tomography. Am J Clin Nutr. 1996;63(6):863–869. doi: 10.1093/ajcn/63.6.863. [DOI] [PubMed] [Google Scholar]
- 48.Remer T, Neubert A, Maser-Gluth C. Anthropometry-based reference values for 24-h urinary creatinine excretion during growth and their use in endocrine and nutritional research. Am J Clin Nutr. 2002;75(3):561–569. doi: 10.1093/ajcn/75.3.561. [DOI] [PubMed] [Google Scholar]
- 49.Pusey AE, Oehlert GW, Williams J, Goodall J. Influence of ecological and social factors on body mass of wild chimpanzees. Int J Primatol. 2005;26(1):3–31. [Google Scholar]
- 50.Catherwood R, Stearns G. Creatine and creatinine excretion in infancy. J Biol Chem. 1937;119:201–214. [Google Scholar]
- 51.Sutphen JL. Anthropometric determinants of creatinine excretion in preterm infants. Pediatrics. 1982;69(6):719–723. [PubMed] [Google Scholar]
- 52.Neubert A, Remer T. The impact of dietary protein intake on urinary creatinine excretion in a healthy pediatric population. J Pediatr. 1998;133(5):655–659. doi: 10.1016/s0022-3476(98)70107-6. [DOI] [PubMed] [Google Scholar]
- 53.Hülsemann J, Manz F, Wember T, Schöch G. [Administration of creatine and creatinine with breast milk and infant milk preparations] Klin Padiatr. 1987;199(4):292–295. German. doi: 10.1055/s-2008-1026805. [DOI] [PubMed] [Google Scholar]
- 54.Belavady B. Quantity and composition of breast milk in malnourished mothers. In: Hambraeus L, Sjolin S, editors. The Mother/Child Dyad: Nutritional Aspects. Almqvist and Wiksell; Stockholm: 1979. pp. 62–68. [Google Scholar]
- 55.Ellison PT, Valeggia CR. C-peptide levels and the duration of lactational amenorrhea. Fertil Steril. 2003;80(5):1279–1280. doi: 10.1016/s0015-0282(03)02158-7. [DOI] [PubMed] [Google Scholar]
- 56.Deschner T, Kratzsch J, Hohmann G. Urinary C-peptide as a method for monitoring body mass changes in captive bonobos (Pan paniscus) Horm Behav. 2008;54(5):620–626. doi: 10.1016/j.yhbeh.2008.06.005. [DOI] [PubMed] [Google Scholar]
- 57.Emery Thompson M, Knott CD. Urinary C-peptide of insulin as a non-invasive marker of energy balance in wild orangutans. Horm Behav. 2008;53(4):526–535. doi: 10.1016/j.yhbeh.2007.12.005. [DOI] [PubMed] [Google Scholar]
- 58.Emery Thompson M, Muller MN, Wrangham RW, Lwanga JS, Potts KB. Urinary C-peptide tracks seasonal and individual variation in energy balance in wild chimpanzees. Horm Behav. 2009;55(2):299–305. doi: 10.1016/j.yhbeh.2008.11.005. [DOI] [PubMed] [Google Scholar]
- 59.Girard-Buttoz C, et al. Urinary C-peptide measurement as a marker of nutritional status in macaques. PLoS One. 2011;6(3):e18042. doi: 10.1371/journal.pone.0018042. [DOI] [PMC free article] [PubMed] [Google Scholar]
- 60.Valeggia C, Ellison PT. Lactational amenorrhoea in well-nourished Toba women of Formosa, Argentina. J Biosoc Sci. 2004;36(5):573–595. doi: 10.1017/s0021932003006382. [DOI] [PubMed] [Google Scholar]
- 61.Ellison PT. Energetics and reproductive effort. Am J Hum Biol. 2003;15(3):342–351. doi: 10.1002/ajhb.10152. [DOI] [PubMed] [Google Scholar]
- 62.van de Rijt-Plooij HH, Plooij FX. Growing independence, conflict and learning in mother-infant relations in free-ranging chimpanzees. Behaviour. 1987;101(1/3):1–86. [Google Scholar]
- 63.Altmann J. Costs of reproduction in baboons (Papio cynocephalus) In: Aspey WP, Lustick SI, editors. Behavioral Energetics: The Cost of Survival in Vertebrates. Ohio State Univ Press; Colombus, OH: 1983. pp. 67–88. [Google Scholar]
- 64.Lee P, Majiluf P, Gordon IJ. Growth, weaning, and maternal investment from a comparative perspective. J Zool (Lond) 1991;225(1):99–114. [Google Scholar]
- 65.van Noordwijk MA, Willems EP, Atmoko SSU, Kuzawa CW, van Schaik CP. Multi-year lactation and its consequences in Bornean orangutans (Pongo pygmaeus wurmbii) Behav Ecol Sociobiol. 2013;67(5):805–814. [Google Scholar]
- 66.Janson CH, van Schaik CP. Ecological risk aversion in juvenile primates: Slow and steady wins the race. In: Pereira ME, Fairbanks LA, editors. Juvenile Primates: Life History, Development, and Behavior. Univ of Chicago Press; Chicago, IL: 1993. pp. 57–74. [Google Scholar]
- 67.Lee PC. The meanings of weaning: Growth, lactation, and life history. Evol Anthropol. 1996;5(3):87–98. [Google Scholar]
- 68.Howie PW, McNeilly AS. Effect of breast-feeding patterns on human birth intervals. J Reprod Fertil. 1982;65(2):545–557. doi: 10.1530/jrf.0.0650545. [DOI] [PubMed] [Google Scholar]
- 69.Kennedy KI, Rivera R, McNeilly AS. Consensus statement on the use of breastfeeding as a family planning method. Contraception. 1989;39(5):477–496. doi: 10.1016/0010-7824(89)90103-0. [DOI] [PubMed] [Google Scholar]
- 70.Kennedy KI, Visness CM. Contraceptive efficacy of lactational amenorrhoea. Lancet. 1992;339(8787):227–230. doi: 10.1016/0140-6736(92)90018-x. [DOI] [PubMed] [Google Scholar]
- 71.Lee PC, Moss CJ. Early maternal investment in male and female African elephant calves. Behav Ecol Sociobiol. 1986;18(5):353–361. [Google Scholar]
- 72.Mann J, Connor RC, Barre LM, Heithaus MR. Female reproductive success in bottlenose dolphins (Tursiops sp.): Life history, habitat, provisioning, and group-size effects. Behav Ecol. 2000;11(2):210–219. [Google Scholar]
- 73.Lancaster J, Alvarado L. The hormonal platform for conception in natural fertility populations: Lactation and ovulation. Am J Hum Biol. 2010;22(2):259. [Google Scholar]
- 74.Chinn KS. Potassium and creatinine as indexes of muscle and nonmuscle protein in rats. J Nutr. 1966;90(3):323–330. doi: 10.1093/jn/90.3.323. [DOI] [PubMed] [Google Scholar]
- 75.de Campeneere S, Fiems L, Vanacker J, Boucqué C. Evaluation of urinary creatinine excretion to estimate in vivo body composition of Belgian Blue double-muscled bulls. Ann Zootech. 2000;49(4):335–342. [Google Scholar]
- 76.Forbes GB, Bruining GJ. Urinary creatinine excretion and lean body mass. Am J Clin Nutr. 1976;29(12):1359–1366. doi: 10.1093/ajcn/29.12.1359. [DOI] [PubMed] [Google Scholar]
- 77.Proctor DN, O’Brien PC, Atkinson EJ, Nair KS. Comparison of techniques to estimate total body skeletal muscle mass in people of different age groups. Am J Physiol. 1999;277(3 Pt 1):E489–E495. doi: 10.1152/ajpendo.1999.277.3.E489. [DOI] [PubMed] [Google Scholar]
- 78.Zihlman AL, Bolter DR. Body composition in Pan paniscus compared with Homo sapiens has implications for changes during human evolution. Proc Natl Acad Sci USA. 2015;112(24):7466–7471. doi: 10.1073/pnas.1505071112. [DOI] [PMC free article] [PubMed] [Google Scholar]
- 79.Altmann J, Alberts SC. Growth rates in a wild primate population: Ecological influences and maternal effects. Behav Ecol Sociobiol. 2005;57(5):490–501. [Google Scholar]
- 80.Sinervo B, Zamudio K, Doughty P, Huey RB. Allometric engineering: A causal analysis of natural selection on offspring size. Science. 1992;258(5090):1927–1930. doi: 10.1126/science.258.5090.1927. [DOI] [PubMed] [Google Scholar]
- 81.Sogard SM. Size-selective mortality in the juvenile stage of teleost fishes: A review. Bull Mar Sci. 1997;60(3):1129–1157. [Google Scholar]
- 82.Nur N. The consequences of brood size for breeding blue tits II. Nestling weight, offspring survival and optimal brood size. J Anim Ecol. 1984;53(2):497–517. [Google Scholar]
- 83.Lindström J. Early development and fitness in birds and mammals. Trends Ecol Evol. 1999;14(9):343–348. doi: 10.1016/s0169-5347(99)01639-0. [DOI] [PubMed] [Google Scholar]
- 84.Kaufman DW, Kaufman GA. Reproduction by Peromyscus polionotus: Number, size, and survival of offspring. J Mammal. 1987;68(2):275–280. [Google Scholar]
- 85.Rieger JF. Body size, litter size, timing of reproduction, and juvenile survival in the Unita ground squirrel, Spermophilus armatus. Oecologia. 1996;107(4):463–468. doi: 10.1007/BF00333936. [DOI] [PubMed] [Google Scholar]
- 86.McMahon CR, Burton HR, Bester MN. Weaning mass and the future survival of juvenile southern elephant seals, Mirounga leonina, at Macquarie Island. Antarct Sci. 2000;12(2):149–153. [Google Scholar]
- 87.Baker JD. Variation in the relationship between offspring size and survival provides insight into causes of mortality in Hawaiian monk seals. Endanger Species Res. 2008;5(1):55–64. [Google Scholar]
- 88.Albon S, Clutton-Brock T, Guinness F. Early development and population dynamics in red deer. II. Density-independent effects and cohort variation. J Anim Ecol. 1987;56(1):69–81. [Google Scholar]
- 89.Loison A, Langvatn R, Solberg EJ. Body mass and winter mortality in red deer calves: Disentangling sex and climate effects. Ecography. 1999;22(1):20–30. [Google Scholar]
- 90.Nuñez CL, Grote MN, Wechsler M, Allen-Blevins CR, Hinde K. Offspring of primiparous mothers do not experience greater mortality or poorer growth: Revisiting the conventional wisdom with archival records of Rhesus Macaques. Am J Primatol. 2015;77(9):963–973. doi: 10.1002/ajp.22426. [DOI] [PMC free article] [PubMed] [Google Scholar]
- 91.Lummaa V, Clutton-Brock T. Early development, survival and reproduction in humans. Trends Ecol Evol. 2002;17(3):141–147. [Google Scholar]
- 92.Walker SP, et al. International Child Development Steering Group Child development: Risk factors for adverse outcomes in developing countries. Lancet. 2007;369(9556):145–157. doi: 10.1016/S0140-6736(07)60076-2. [DOI] [PubMed] [Google Scholar]
- 93.Gluckman PD, Hanson MA, Cooper C, Thornburg KL. Effect of in utero and early-life conditions on adult health and disease. N Engl J Med. 2008;359(1):61–73. doi: 10.1056/NEJMra0708473. [DOI] [PMC free article] [PubMed] [Google Scholar]
- 94.Dewey KG, Begum K. Long-term consequences of stunting in early life. Matern Child Nutr. 2011;7(Suppl 3):5–18. doi: 10.1111/j.1740-8709.2011.00349.x. [DOI] [PMC free article] [PubMed] [Google Scholar]
- 95.Muller MN, Wrangham RW. Mortality rates among Kanyawara chimpanzees. J Hum Evol. 2014;66:107–114. doi: 10.1016/j.jhevol.2013.10.004. [DOI] [PubMed] [Google Scholar]
- 96.Hill K, et al. Mortality rates among wild chimpanzees. J Hum Evol. 2001;40(5):437–450. doi: 10.1006/jhev.2001.0469. [DOI] [PubMed] [Google Scholar]
- 97.Richard AF, Dewar RE, Schwartz M, Ratsirarson J. Mass change, environmental variability and female fertility in wild Propithecus verreauxi. J Hum Evol. 2000;39(4):381–391. doi: 10.1006/jhev.2000.0427. [DOI] [PubMed] [Google Scholar]
- 98.Sand H. Life history patterns in female moose (Alces alces): The relationship between age, body size, fecundity and environmental conditions. Oecologia. 1996;106(2):212–220. doi: 10.1007/BF00328601. [DOI] [PubMed] [Google Scholar]
- 99.Cameron RD, Smith WT, Fancy SG, Gerhart KL, White RG. Calving success of female caribou in relation to body weight. Can J Zool. 1993;71(3):480–486. [Google Scholar]
- 100.Crocker DE, Williams JD, Costa DP, Le Boeuf BJ. Maternal traits and reproductive effort in northern elephant seals. Ecology. 2001;82(12):3541–3555. [Google Scholar]
- 101.Albon S, Mitchell B, Staines B. Fertility and body weight in female red deer: A density-dependent relationship. J Anim Ecol. 1983;52(3):969–980. [Google Scholar]
- 102.Mitani JC, Gros-Louis J, Richards AF. Sexual dimorphism, the operational sex ratio, and the intensity of male competition in polygynous primates. Am Nat. 1996;147(6):966–980. [Google Scholar]
- 103.Haley MP, Deutsch CJ, Le Boeuf BJ. Size, dominance and copulatory success in male northern elephant seals, Mirounga angustirostris. Anim Behav. 1994;48(6):1249–1260. [Google Scholar]
- 104.McElligott AG, et al. Sexual size dimorphism in fallow deer (Dama dama): Do larger, heavier males gain greater mating success? Behav Ecol Sociobiol. 2001;49(4):266–272. [Google Scholar]
- 105.Miller EJ, Eldridge MD, Cooper DW, Herbert CA. Dominance, body size and internal relatedness influence male reproductive success in eastern grey kangaroos (Macropus giganteus) Reprod Fertil Dev. 2010;22(3):539–549. doi: 10.1071/RD09061. [DOI] [PubMed] [Google Scholar]
- 106.Zedrosser A, Bellemain E, Taberlet P, Swenson JE. Genetic estimates of annual reproductive success in male brown bears: The effects of body size, age, internal relatedness and population density. J Anim Ecol. 2007;76(2):368–375. doi: 10.1111/j.1365-2656.2006.01203.x. [DOI] [PubMed] [Google Scholar]
- 107.Bercovitch FB. Body size, sperm competition, and determinants of reproductive success in male savanna baboons. Evolution. 1989;43(7):1507–1521. doi: 10.1111/j.1558-5646.1989.tb02600.x. [DOI] [PubMed] [Google Scholar]
- 108.Berghänel A, Schülke O, Ostner J. Locomotor play drives motor skill acquisition at the expense of growth: A life history trade-off. Sci Adv. 2015;1(7):e1500451. doi: 10.1126/sciadv.1500451. [DOI] [PMC free article] [PubMed] [Google Scholar]
- 109.Moore T, Haig D. Genomic imprinting in mammalian development: A parental tug-of-war. Trends Genet. 1991;7(2):45–49. doi: 10.1016/0168-9525(91)90230-N. [DOI] [PubMed] [Google Scholar]
- 110.Wilcox MA, Newton CS, Johnson IR. Paternal influences on birthweight. Acta Obstet Gynecol Scand. 1995;74(1):15–18. doi: 10.3109/00016349509009936. [DOI] [PubMed] [Google Scholar]
- 111.Emery Thompson M, Ellison PT. Fertility and fecundity. In: Muller MN, Wrangham RW, Pilbeam D, editors. Chimpanzees and Human Evolution. Harvard Univ Press; Cambridge, MA: [Google Scholar]


