Significance
Claudin-1 (CLDN1), which is thought to be a key gene for human skin disease, especially atopic dermatitis (AD), encodes the dominant claudin responsible for the paracellular barrier at tight junctions in the epidermis. Although decreased CLDN1 expression levels are reported in AD patients, it has been difficult to study how CLDN1 contributes to AD development, mainly because Cldn1 knock-out mice die within 1 d after birth from dehydration. In this report, we reproduced features of human AD in mice, by systematically regulating the Cldn1 expression level. Our experimental approach contributes to the understanding of AD’s etiology and suggests a therapeutic target for this disorder.
Keywords: claudin-1, tight junctions, atopic dermatitis
Abstract
Atopic dermatitis (AD) is a chronic inflammatory skin disease in humans. It was recently noted that the characteristics of epidermal barrier functions critically influence the pathological features of AD. Evidence suggests that claudin-1 (CLDN1), a major component of tight junctions (TJs) in the epidermis, plays a key role in human AD, but the mechanism underlying this role is poorly understood. One of the main challenges in studying CLDN1's effects is that Cldn1 knock-out mice cannot survive beyond 1 d after birth, due to lethal dehydration. Here, we established a series of mouse lines that express Cldn1 at various levels and used these mice to study Cldn1’s effects in vivo. Notably, we discovered a dose-dependent effect of Cldn1’s expression in orchestrating features of AD. In our experimental model, epithelial barrier functions and morphological changes in the skin varied exponentially with the decrease in Cldn1 expression level. At low Cldn1 expression levels, mice exhibited morphological features of AD and an innate immune response that included neutrophil and macrophage recruitment to the skin. These phenotypes were especially apparent in the infant stages and lessened as the mice became adults, depending on the expression level of Cldn1. Still, these adult mice with improved phenotypes showed an enhanced hapten-induced contact hypersensitivity response compared with WT mice. Furthermore, we revealed a relationship between macrophage recruitment and CLDN1 levels in human AD patients. Our findings collectively suggest that CLDN1 regulates the pathogenesis, severity, and natural course of human AD.
Claudins, a multigene family with at least 27 members in human and mouse, are the main components of tight junctions (TJs) (1), which create the paracellular barrier and, in some cases, the channel functions of epithelial cell sheets (2, 3). The expression patterns of claudins vary according to cell type and contribute to a variety of paracellular barrier functions that specifically maintain the homeostasis of tissues and organs (4). In the skin, TJs are key contributors to the epidermal paracellular barrier, and claudin-1 (CLDN1), a main component of TJs in the epidermis, is reported to be indispensable for this barrier function; abnormalities in CLDN1 cause human skin diseases (5–9). However, because Cldn1 knock-out (KO) mice die within 1 d of birth due to dehydration (10, 11), it has been difficult to study how Cldn1 contributes to skin diseases.
Recent evidence indicates that atopic dermatitis (AD), which is a common chronic inflammatory skin disease (12, 13), is associated with decreased CLDN1 expression levels in humans (8, 14). AD appears in ∼20% of children and 3% of adults, and its symptoms include itching and eczema, which decrease patients’ quality of life (15). Around 70% of AD cases start in children under 5 y of age, and the disease tends to show spontaneous remission with aging (16, 17). Although immunological imbalances were previously proposed to explain the features of AD, such as increased immunoglobulin E (IgE) levels and the acquired immune response, recent studies showed that epidermal barrier functions critically influence the pathological features of AD (18, 19). However, the cause and development of AD with respect to epidermal barrier functions have not been systematically studied.
Here, we established a experimental model system consisting of mouse lines in which the Cldn1 expression was systematically regulated to elicit different levels of expression. Although many gene functions have been uncovered using a gene KO strategy in mice to compare the all-vs.-none situations, an alternative approach examines how variations in gene expression levels can change the normal function of a gene, sometimes leading to disease. Using our systematic Cldn1 knock-down (KD) mouse system, we revealed the in vitro and in vivo responses to dose-dependent expression levels of Cldn1, and the relationship between Cldn1 expression and AD. The epithelial barrier functions and morphological changes in the skin varied exponentially with the decreased expression level of Cldn1. The Cldn1 KD mice mimicked human AD in several respects: They showed morphological features typical of AD and similar innate immune responses, both of which improved with age. However, the Cldn1 KD skin that had improved with age was still weakened against the penetration of hapten compared with WT. Our findings suggest that the severity of these features is determined by the expression level of CLDN1 in human AD. In support of this possibility, we found that macrophage recruitment to the skin was related to the protein expression level of CLDN1 in human AD patients. Taking these findings together, we propose that a decreased expression of CLDN1 may be a critical risk factor for the pathogenesis and progression of AD.
Results
Establishment of an Experimental System of Mouse Lines with Systematically Regulated Cldn1 Expression Levels.
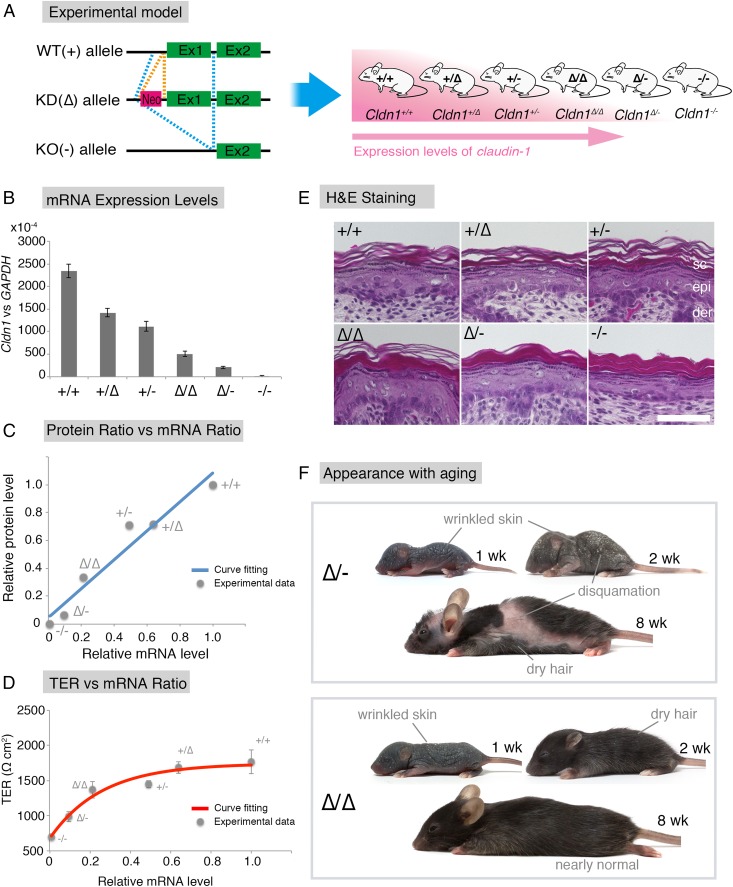
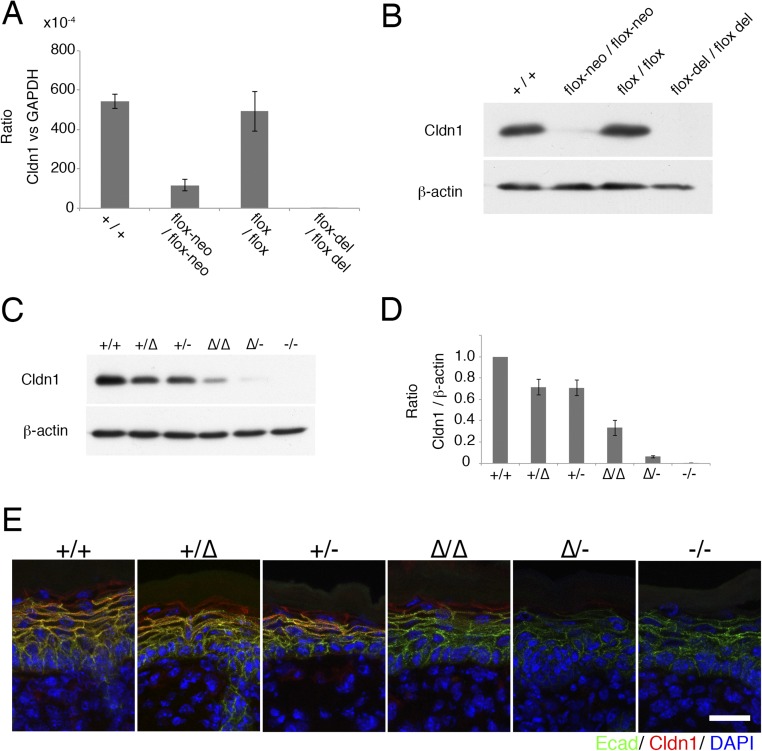
To examine the relationship between Cldn1 and skin disease, we first sought to establish an experimental model by generating mice harboring WT (+), knock-down [KD (∆)], or knock-out [KO (−)] alleles in various combinations (Fig. 1A). First, we generated Cldn1 mutant (conditional) KO mice (Fig. S1), using a strategy in which insertion of the neo gene down-regulates floxed gene expression levels (20, 21). We observed that the neo-flox allele led to significant reductions in the Cldn1 gene expression and protein levels (Fig. S2 A and B). By exploiting this phenomenon, we obtained mice with six different Cldn1 expression levels: Cldn1+/+, Cldn1+/∆, Cldn1+/−, Cldn1∆/∆, Cldn1∆/-, and Cldn1−/−. This series of mutant mouse lines served as a sophisticated experimental model with which to examine the role of Cldn1.
Fig. 1.
The Cldn1 expression levels are exponentially associated with the epithelial barrier characteristics in vitro and determine skin phenotypes in the mouse in vivo. (A) Experimental design for analyzing how Cldn1 expression levels contribute to AD in vivo. Generation of a Cldn1 knock-down mouse series with six levels of Cldn1 expression (pink, higher expression of Cldn1). The combination of three alleles generated six different Cldn1 expression levels in vivo. Ex1, Exon1; Ex2, Exon2. (B) Real-time RT-PCR analysis of the Cldn1 gene expression in primary keratinocyte cultures (n = 5 mice per genotype). Error bar, SEM. (C) Positive correlation between the CLDN1 protein level and Cldn1 mRNA level. Curve fitting, straight line, R2 > 9.4. The Cldn1 protein levels were calculated from the normalized immunoblot data shown in Fig. S2C. (D) TER measurement of primary cultured keratinocytes with different expression levels of Cldn1 (n = 5 mice per genotype). Error bars, SEM. Curve fitting, exponential equation, R2 > 9.5. The t1/2 and mRNA expression level of each genotype are shown in Fig. S3B. (E) H&E staining of skin samples from newborn mice of each genotype. (Scale bar: 50 µm.) Abnormalities like an orthohyperkeratotic stratum corneum were correlated with the Cldn1 expression level. der, dermis; epi, epidermis; Sc, stratum corneum. (F) Pictures of Cldn1∆/- and Cldn1∆/∆ mice at 1, 2, and 8 wk. Note the pathological skin condition in the mutant mice. Pictures of WT mice are shown in Fig. S5B.
Fig. S1.
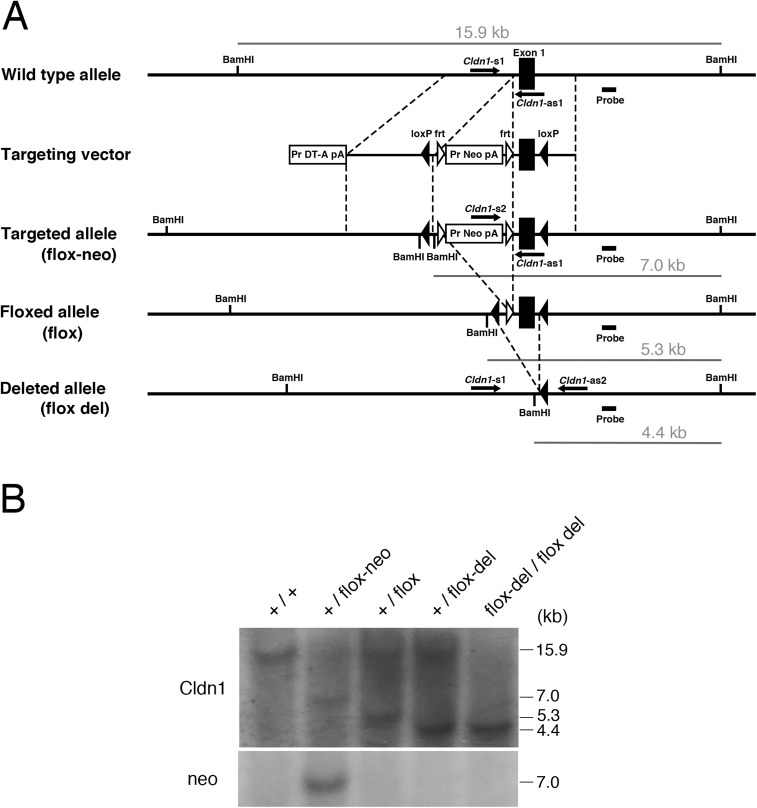
Generation of Cldn1 conditional knock-out mice. (A) Construction of alleles and vector for the mouse Cldn1 gene: the WT allele, targeting vector, flox-neo allele, floxed allele, and deleted allele. (B) Genotype analysis of the Cldn1 conditional knock-out mice by Southern blotting of the BamHI-digested genomic DNA from each mouse: WT (+/+), heterozygous (+/flox-neo), heterozygous (+/flox), heterozygous (+/−), and homozygous (−/−).
Fig. S2.
(A) Real-time RT-PCR analysis of the Cldn1 gene in the skin of newborn mice. Flox-neo/flox-neo mice showed decreased mRNA expression (n = 5 mice per genotype). Error bar, SEM. (B) Immunoblotting for Cldn1 and β-actin. Flox-neo/flox-neo mice showed decreased CLDN1 protein levels. (C and D) Immunoblots for Cldn1 and β-actin in primary cultured keratinocytes of each genotype. Different CLDN1 protein levels were observed (n = 4 mice per genotype). (E) Immunofluorescence micrographs of Claudin-1 (Cldn1, red), E-cadherin (Ecad, green), and DAPI (blue) in the skin of newborn mice. (Scale bar: 20 µm.)
To determine the expression levels of Cldn1 quantitatively, we prepared primary keratinocyte cultures from newborn mice of each genotype. Real-time (RT) PCR confirmed that the Cldn1 mRNA levels differed according to genotype (Fig. 1B). In addition, immunoblots of Cldn1 and β-actin showed a similar pattern of Cldn1 protein levels for each genotype (Fig. S2 C and D). The results revealed a strong positive correlation between the Cldn1 mRNA and protein levels (Fig. 1C and Fig. S2 A, B, and D).
Exponential Correlations of the Expression Level of Cldn1 with Its Epithelial Barrier Function and with the Phenotype in Vivo.
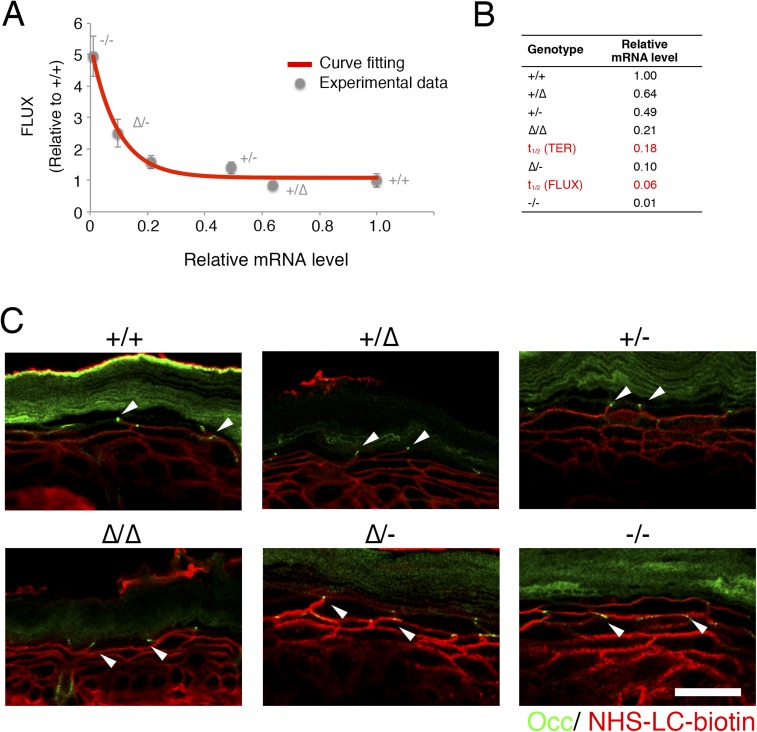
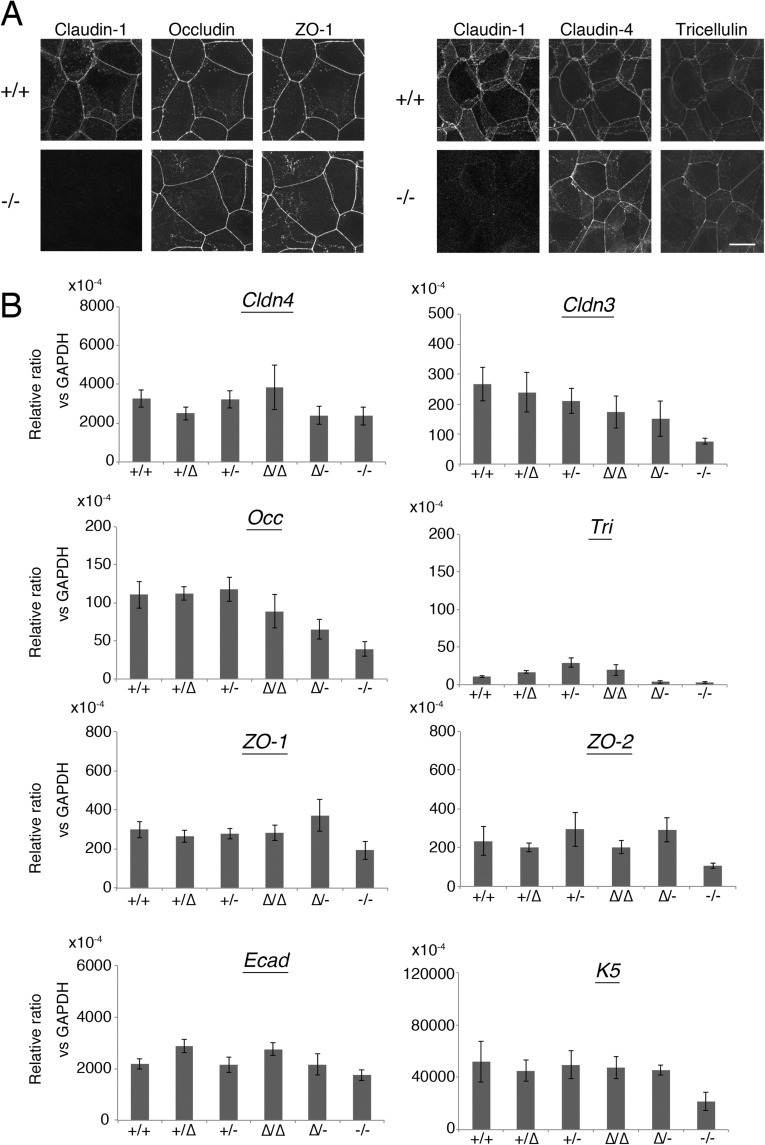
To examine the relationship between Cldn1 expression levels and the phenotypes of our mouse lines, we first analyzed the paracellular barrier function of the skin epithelium. For this analysis, we measured the transepithelial electrical resistance (TER) and paracellular flux (FLUX) of 4-kDa dextran tracers in primary cultures of keratinocytes prepared from each mouse line. Although the Cldn1 mRNA level was proportional to its protein level (Fig. 1C), the TER and FLUX results showed that the barrier function in keratinocyte changed exponentially as the Cldn1 mRNA expression level increased (Fig. 1D and Fig. S3A). The t1/2 values for the plateaus of the TER and FLUX data corresponded approximately to the mRNA level in Cldn1∆/- keratinocytes, which was 10% of the level in WT (Fig. S3B). Furthermore, we observed a difference in permeability in vivo by tracer experiments using a biotinylation reagent (Fig. S3C). In the Cldn1∆/-and Cldn1−/− newborn epidermis, the biotinylation reagent leaked through occludin-positive TJs. Notably, immunohistochemical analyses revealed that the Cldn1−/− keratinocytes still contained TJs (Fig. S4A). In addition, the Claudin-3 and Occludin mRNA levels tended to be correlated with the level of Cldn1 mRNA expression whereas other junctional components, including Claudin-4, Tricellin, ZO-1, ZO-2, E-cadherin, and K5, did not (Fig. S4B). These findings indicated that the differences in the paracellular barrier functions of keratinocytes were closely related to the Cldn-1 expression levels in vivo.
Fig. S3.
Permeability assay and expression of TJ-related factors. (A) FLUX assay with 4-kDa FITC-dextran in primary cultured keratinocytes (n = 5 mice per genotype). Error bars, SEM. Curve fitting, exponential equation, R2 > 9.5. (B) The t1/2 and mRNA expression level of each genotype. The TER assay is shown in Fig. 1D. (C) Immunofluorescence micrographs of occludin (Occ, green) and NHS-LC-Biotin (red) in the skin of newborn mice. Arrowhead indicates occludin-positive TJs. (Scale bar: 20 µm.)
Fig. S4.
(A) Immunofluorescence micrographs of TJ-related proteins in primary cultured keratinocytes. (Scale bar: 100 µm.) (B) Real-time RT-PCR analysis of Claudin-4 (Cldn4), Claudin-3 (Cldn3), Occludin (Occ), Tricellulin (Tri), ZO-1, ZO-2, E-cadherin (Ecad), and Keratin-5 (K5) (n = 4∼5 mice per genotype). Error bar, SEM.
We next examined the Cldn1-dependent morphological changes in the epidermis of newborn mice. Previous reports showed that Cldn1 affects the stratum granulosum (SG), from which the stratum corneum (SC) is generated, and that Cldn1−/− newborn mice have an abnormal SC (10, 11). In our experimental model, H&E staining revealed that not only Cdln1−/− but also Cldn1∆/∆ and Cldn1∆/- newborn mice showed abnormal differentiation of the SC, the severity of which was correlated with the epithelial barrier function and Cldn1 expression level (Fig. 1E). These findings indicated that differences in the paracellular barrier functions and morphology of the epidermis were closely related to the Cldn-1 expression level in vivo.
Cldn1 Expression Level-Dependent Regulation of AD Phenotypes in Mice at Different Ages.
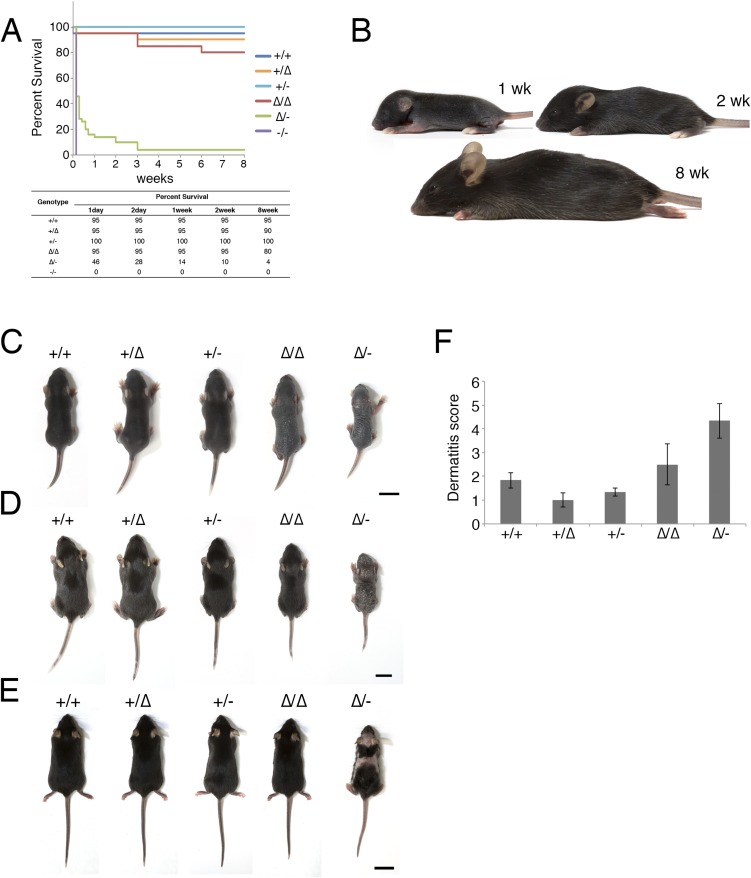
To understand CLDN1’s role in the age-related changes in human AD, we examined the phenotypes of the model mice over time, from birth to adulthood. Although the Cldn1−/− mice died within 1 d of birth, the other genotypes survived to adulthood with varying mortality rates. The survival rate at 8 wk was over 80% for Cldn1+/+, Cldn1+/∆, Cldn1+/−, and Cldn1∆/∆; 4% for Cldn1∆/-; and 0% for Cldn1−/− mice (Fig. S5A). These results suggested that the low Cldn1 expression level in Cldn1∆/- mice was near the threshold for lethality.
Fig. S5.
Age-dependent changes in each mouse genotype. (A) Kaplan–Meier curves for 8 wk. For the first week, survival was plotted every day. From week 1 to week 8, survival was plotted every week (n = 20 for Cldn1+/+, Cldn1+/∆, Cldn1+/−, Cldn1∆/∆, and Cldn1−/−; n = 50 for Cldn1∆/-). (B) Pictures of Cldn1+/+ mice at 1 wk, 2 wk, and 8 wk. (C) Pictures of mice of each genotype at 1 wk: Cldn1+/+, Cldn1+/∆, Cldn1+/−, Cldn1∆/∆, and Cldn1∆/-. (Scale bar: 1 cm.) (D) Pictures of mice of each genotype at 2 wk: Cldn1+/+, Cldn1+/∆, Cldn1+/−, Cldn1∆/∆, and Cldn1∆/-. (Scale bar: 1 cm.) (E) Pictures of mice of each genotype at 8 wk: Cldn1+/+, Cldn1+/∆, Cldn1+/−, Cldn1∆/∆, and Cldn1∆/-. (Scale bar: 2 cm.) (F) The dermatitis score at 8 wk (n = 3 mice per genotype). Error bar, SEM.
Among the Cldn1 mutant mice, the Cldn1∆/∆ and Cldn1∆/- mice showed age-dependent changes in their skin appearance (Fig. 1F and Fig. S5 B–E). Cldn1∆/∆ mice showed wrinkled skin at 1 wk, showed abnormal dry hair at 2 wk, and were nearly normal at 8 wk. The Cldn1∆/- mice, which usually did not survive beyond weaning, showed more severe skin phenotypes with severe desquamation and wrinkled skin at 2 wk; this phenotype had improved but was still apparent at 8 wk, and only the Cldn1∆/- mice, of all of the mutant genotypes, still exhibited a different severity of skin lesion from WT at 8 wk by dermatitis score (Fig. S6D) (22). Overall, these findings revealed that the decreased expression of Cldn1 caused severe skin defects in infancy that improved with age in the mouse, similar to the natural history of infantile eczema in human AD patients (16).
Fig. S6.
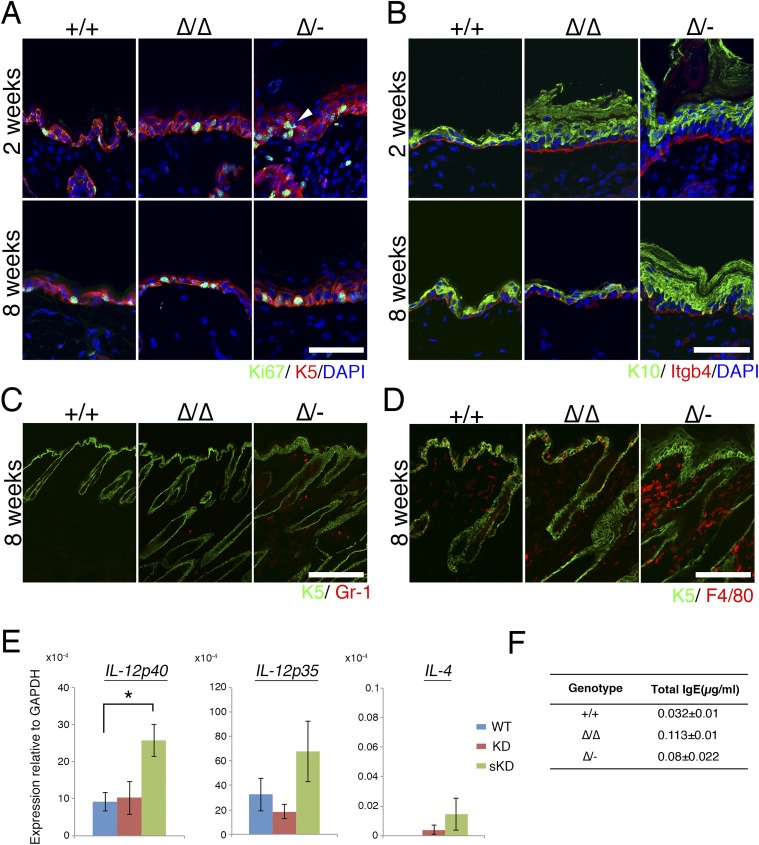
(A) Immunofluorescence micrographs of the proliferation marker Ki67. Arrowhead indicates abnormal proliferation. Ki67 (green); Keratin-5 (K5, red); DAPI (blue). der, dermis; epi, epidermis. (Scale bar: 50 µm.) (B) Immunofluorescence micrographs of a differentiation marker, keratin-10. Keratin-10 (K10, green); integrin-b4 (Itgb4, red); DAPI (blue). (Scale bar: 50 µm.) (C) Immunofluorescence micrographs of neutrophils at 8 wk. Keratin-5 (K5, green); Gr-1 (red). (Scale bar: 200 µm.) (D) Immunofluorescence micrographs of macrophages at 8 wk. K5 (green); F4/80 (red). (Scale bar: 100 µm.) (E) Cldn1 KD mice showed a Th1 immune response in the lymph nodes. Real-time RT-PCR analysis of IL-4, IL-12p35, and IL-12p40 in the lymph nodes at 8 wk. *P < 0.05. (F) IgE concentration in mouse serum.
Cldn1 Expression Level-Dependent Morphological Features of the Epidermis.
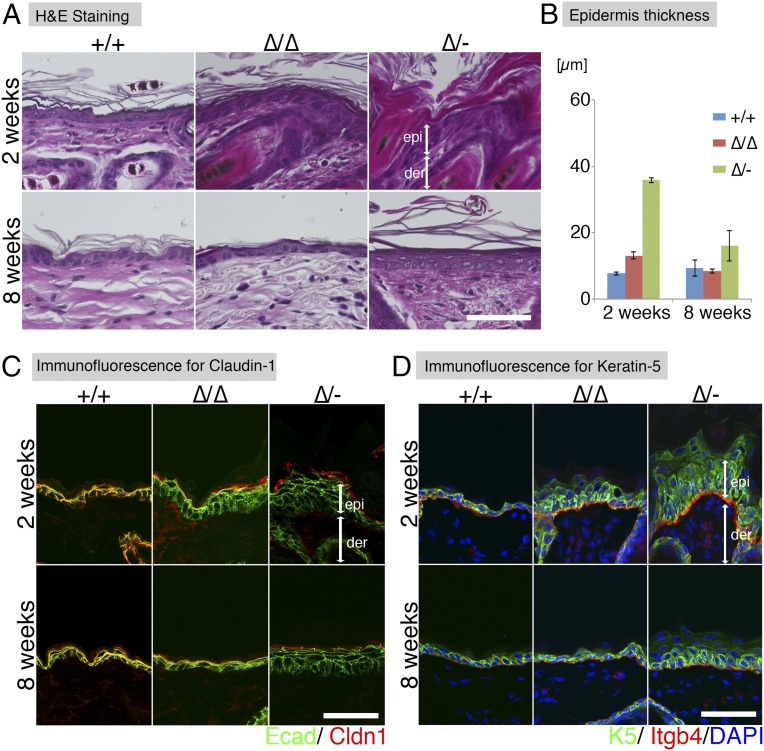
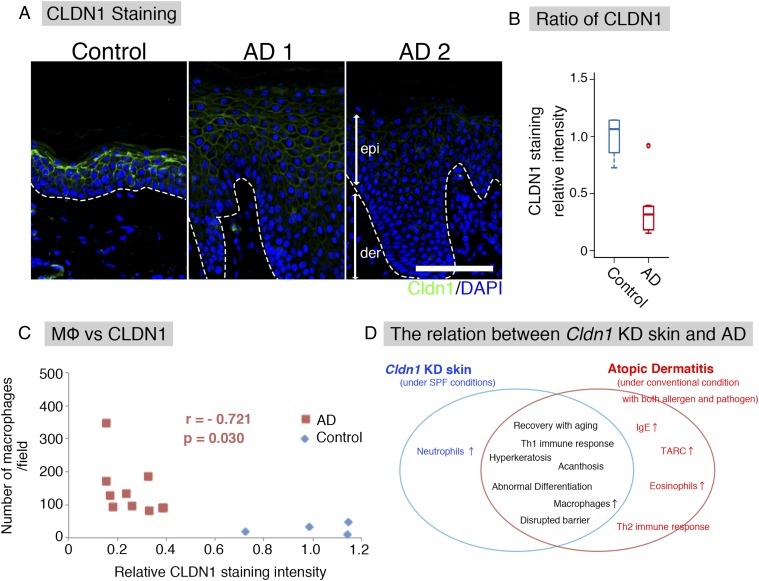
We next performed a detailed analysis of the skin morphology of the Cldn1 mutant mice with aging. H&E-stained preparations from 2- and 8-wk-old mice revealed pathological characteristics of the Cldn1∆/∆ and Cldn1∆/- skin, including hyperkeratosis, acanthosis, and increased numbers of hair follicles (Fig. 2 A and B). Immunofluorescence staining showed that Cldn1 localized only at the SG layer in Cldn1 KD epidermis, and the TJs in 2-wk-old Cldn1∆/- epidermis lacked CLDN1 (Fig. 2C). The expression domain of keratin-5 (K5), a basal epidermis marker, was restricted to the most basal layers in the Cldn1+/+ epidermis but expanded to the suprabasal layers in the Cldn1∆/∆ and Cldn1∆/- epidermis (Fig. 2D). In addition, the 2-wk-old Cldn1∆/- mice showed ectopic proliferation in the subapical basal layer, as indicated by Ki-67 staining (Fig. S6A). In contrast, the mutant mice showed the same expression domain for keratin-10 (K10), a marker for the stratum spinosum and SG layers, as the Cldn1+/+ mice (Fig. S6B). Similar changes in the expression domains of the human orthologs of these molecules were found in AD patients (see Fig. 4A) (Fig. S7 A–D and Dataset S1), consistent with a previous report (23). These findings suggested that a decrease in Cldn1 expression causes abnormal skin differentiation in the infant stages, especially in the proliferation layers, and that the skin of Cldn1 KD mice mimics the changes seen in human AD tissue.
Fig. 2.
The Cldn1 KD mice exhibit AD-like morphological features. (A) H&E staining at 2 and 8 wk. (Scale bar: 50 µm.) der, dermis; epi, epidermis. (B) Thickness of the epidermis in Cldn1+/+, Cldn1∆/∆, and Cldn1∆/- skin at 2 and 8 wk (n = 3). (C) Immunofluorescence micrographs of Claudin-1 (Cldn1, red); E-cadherin (Ecad, green). (Scale bar: 50 µm.) (D) Immunofluorescence micrographs of the differentiation marker keratin-5 (K5, green); integrin-b4 (Itgb4, red); and DAPI (blue). (Scale bar: 50 µm.) epi, epidermis; der, dermis.
Fig. 4.
Correlation between CLDN1 and AD in humans. (A) Immunofluorescence micrographs of CLDN1 in human skin samples. The basement membrane (white dotted line) separated the epidermis (epi) from the dermis (der). Claudin-1 (Cldn1, green); DAPI (blue). (Scale bar: 100 μm.) (B) CLDN1 staining level by semiquantitative analysis. Error bar, SEM. (C) In human AD samples (red squares), the number of macrophages was inversely correlated with the level of CLDN1 staining. r = −0.721. p = 0.03. Blue diamonds, control human samples. (D) Relationship between Cldn1 KD mouse skin and AD. Cldn1 KD mouse skin resembled that of human AD in development and severity.
Fig. S7.
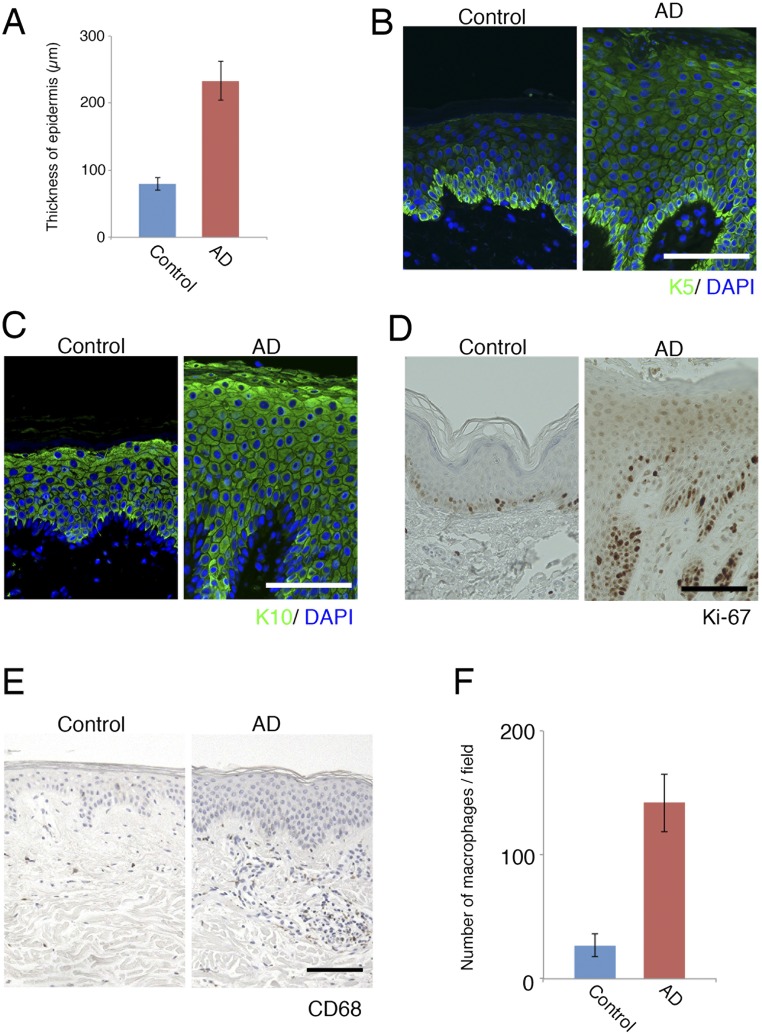
Morphological changes in human AD samples compared with control samples. (A) Thickness of the epidermis in control and AD samples. (B) Immunofluorescence micrographs of the differentiation marker keratin-5 (K5, green); DAPI (blue). (Scale bar: 100 µm.) (C) Immunofluorescence micrographs of the differentiation marker keratin-10 (K10, green); DAPI (blue). (Scale bar: 100 µm.) (D) DAB staining of the proliferation marker Ki-67. (Scale bar: 100 µm.) (E) Immunohistochemical analysis of macrophages in paraffin-embedded sections from human AD patients using an anti-CD68 antibody. (Scale bar: 100 µm.) (F) Number of macrophages in control and AD samples.
Correlation of Cldn1 Expression Level with Immunological Features of the Epidermis.
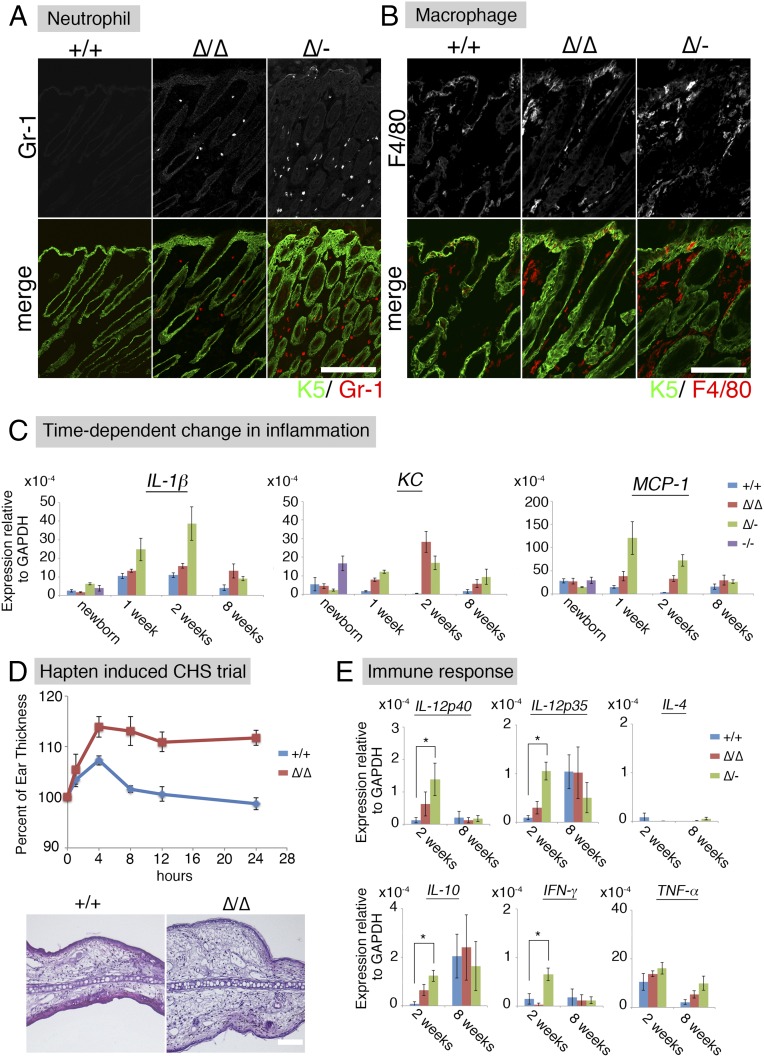
In human AD patients, both macrophages and neutrophils are recruited to the skin to eliminate pathogens (24, 25). In our experimental model, substantial numbers of Gr-1–positive neutrophils were detected in Cldn1∆/∆ and Cldn1∆/- mouse skin samples at 2 wk, and very few were seen at 8 wk (Fig. 3A and Fig. S6C). F4/80-positive macrophages were detected in the Cldn1∆/∆ mouse epidermis at 2 wk but not at 8 wk, and in the Cldn1∆/- skin at both 2 and 8 wk (Fig. 3B and Fig. S6D). Real-time RT-PCR showed similar levels of inflammation markers between Cldn1+/+ and the Cldn1 KD mouse series in newborns (Fig. 3C). By 1 wk, however, the skin of Cldn1∆/- infants showed higher expression of the proinflammatory marker IL-β, which later decreased in the adults, consistent with the visible neutrophil infiltration. A similar pattern was observed for the expression of the neutrophil chemoattractant KC in the Cldn1∆/∆ and Cldn1∆/- skin, and of the macrophage chemoattractant MCP-1 in the Cldn1∆/- skin. These phenotypes were apparent in the infant stages and lessened as the mice became adults, depending on the expression levels of Cldn1, similar to the morphological changes in the epidermis.
Fig. 3.
AD-like phenotypes of Cldn1 KD mice include inflammation. (A) Immunofluorescence micrographs of neutrophil at 2 wk. Keratin-5 (K5, green); Gr-1 (red). (Scale bar: 200 µm.) (B) Immunofluorescence micrographs of macrophages at 2 wk. Keratin-5 (K5, green); F4/80 (red). (Scale bar: 100 µm.) (C) Time-dependent changes in the mRNA expression levels of IL-1β, KC, and MCP-1 in the skin (n = 5 mice per genotype). Error bar, SEM. (D) Percentage of ear thickness by hapten (DNFB)-induced contact hypersensitivity (CHS). Error bar, SEM. H&E staining of the ear skin after the hapten-induced CHS trial. (Scale bar: 100 µm.) (E) Real-time RT-PCR analysis of IL-12p40, IL-12p35, IFN-γ, IL-10, and IL-4 in the skin (n = 5 mice per genotype). Error bar, SEM. *P < 0.05.
We next tested the hapten-induced contact hypersensitivity (CHS) in Cldn1∆/∆ adult mice, in which the morphological and immunological features had improved with age. For this test, we used the contact allergen 2,4-dinitrofluorobenzene (DNFB) and evaluated the cellular immune responses as described previously (26). We found that the Cldn1∆/∆ ear skin thickness was significantly increased, and the H&E-stained preparations showed more severe edema and inflammation, compared with Cldn1+/+ (Fig. 3D).
Most AD skin lesions in humans are characterized by an immune response in which Th2-related cytokines and elevated IgE levels are accompanied by an increased number of Th1-related cytokine-producing cells (27). In our mice at 2 wk of age, the Cldn1∆/- skin showed significantly higher levels of IL-12p35, IL-12p40, IFN-γ, and IL-10 by real-time RT-PCR, compared with the Cldn1+/+ skin (Fig. 3E). In contrast, IL-4 was not significantly different between the Cldn1+/+ and Cldn1 KD skin. In Cldn1∆/- lymph nodes, IL-12p40, but not IL-4, was significantly higher than in Cldn1+/+ lymph nodes (Fig. S6E). Consistent with these findings, the serum of Cldn1∆/∆ and Cldn1∆/- mice contained less than 0.1 µg/mg IgE (Fig. S6F). That the Cldn1 KD mice showed these immunological features despite living in specific pathogen-free (SPF) conditions suggested that skin-homing innate immune cells, which were also found in human AD patients, may be recruited to provide a second line of defense against invading pathogens, and that this recruitment may be associated with the fragility of the epidermal barrier in AD in the absence of pathogen detection (Fig. S7 E and F and Dataset S1).
Relationship Between CLDN1 Levels and AD Features in Humans.
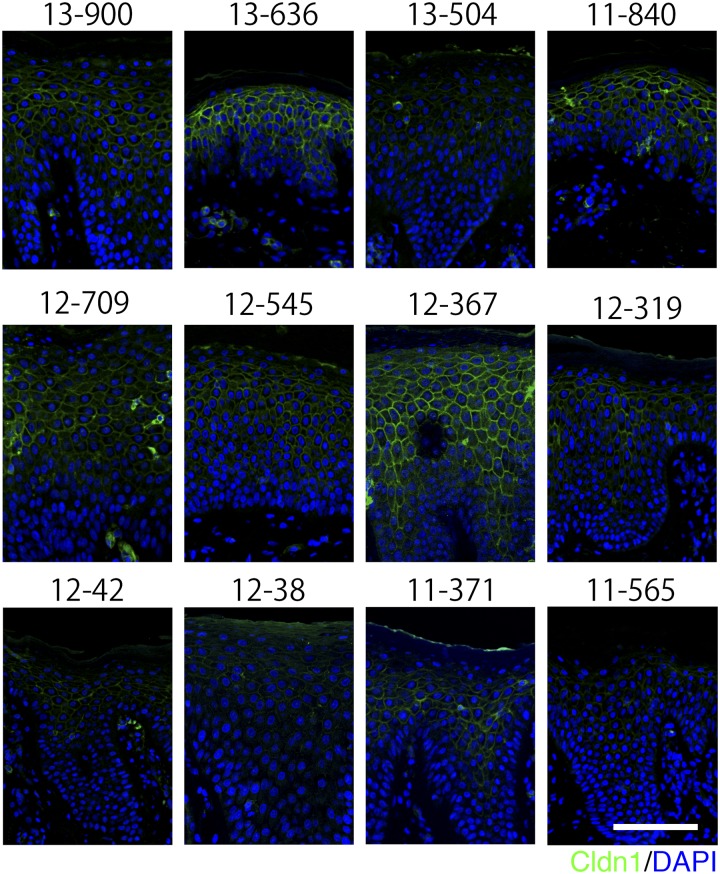
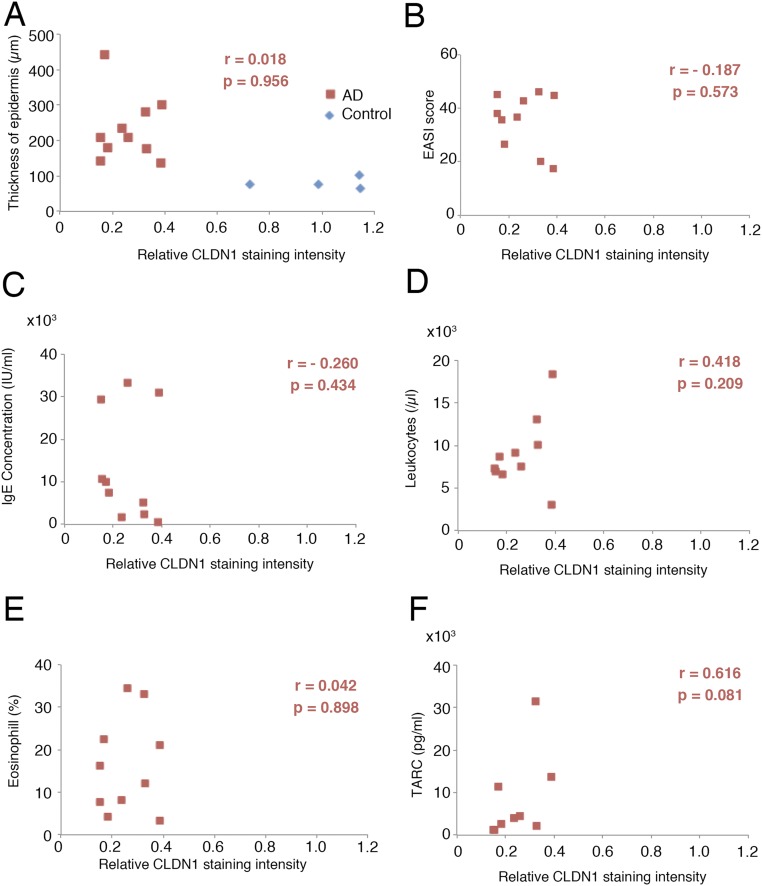
We next examined the CLDN1 expression in human AD patients, to determine whether the expression levels could play a similar role in AD as in our mouse model. For this purpose, we immunofluorescently labeled the CLDN1 in skin samples from 12 AD patients and 4 control subjects and compared the CLDN1 levels semiquantitatively. The levels of CLDN1 were significantly lower in the skin of AD patients compared with controls (Fig. 4 A and B and Fig. S8). In skin samples from the trunk and limbs of human AD patients, after removing the outlier CLDN1 signals, we found that the number of macrophages was significantly inversely correlated with the CLDN1 signal (Fig. 4C). On the other hand, we found no correlation between the CLDN1 level and the thickness of the epidermis, the severity of AD by Eczema Area and Severity Index (EASI), or the serum level of defined AD factors, including leukocytes, eosinophils, IgE, or thymus and activation-regulated chemokine (TARC) (Fig. S9 and Dataset S1). Thus, macrophage recruitment was dramatically increased in the context of decreased CLDN1 levels, but AD factors were not increased. Considering that human AD is caused by complex factors culminating in the atopic disposition, it is remarkable that the macrophage recruitment was directly affected by CLDN1. These findings suggest that the CLDN1 expression level regulates disease symptoms in human AD.
Fig. S8.
Immunofluorescence micrographs of Claudin-1 staining after normalization in each human AD skin sample. Claudin-1 (Cldn1, green); DAPI (blue). (Scale bar: 100 µm.) The same sample numbers are listed in Dataset S1. After excluding two samples (13-636 and 12-367), which exhibited the outlier CLDN1 signals in Fig. 4B, we examined the correlation between the CLDN1 staining level and various factors.
Fig. S9.
Lack of correlation between CLDN1 and AD-related factors in human samples. (A and B) In human AD samples (red squares), the thickness of the epidermis and EASI score did not correlate with the CLDN1 staining intensity. Blue diamonds, human control samples. (C–F) No correlation between the CLDN1 staining intensity and various AD-related factors, including the IgE concentration, leukocytes, eosinophils, or TARC, was observed.
Discussion
In this study, we established mouse lines in which the Cldn1 expression levels were systematically regulated and used them to elucidate the relationship between Cldn1 and AD. This experimental approach presents a sophisticated model with which to explore how different levels of gene expression determine the severity of diseases. Although previous studies reported that the CLDN1 expression is decreased in human AD, the effect of different expression levels was not critically examined. Here, we revealed the effects of different Cldn1 expression levels on the AD phenotypes of mice in vivo.
We found that Cldn1 has roles in both epithelial barrier and morphological changes. TER and FLUX measurements in cultured keratinocytes prepared from each mutant mouse showed that the Cldn1 expression levels were exponentially correlated with epithelial barrier function. The t1/2 values for the plateaus of the TER and FLUX data, deduced from the values in Cldn1+/+ keratinocytes, were closely correlated with the CLDN1 protein level in Cldn1∆/- keratinocytes. Consistent with these findings, an in vivo permeability assay using a biotinylation reagent showed that Cldn1∆/- and Cldn1−/− newborn skin exhibited significantly increased paracellular permeability through the occludin-positive TJs. Half of the Cldn1∆/- mice died within 1 d, and only 4% of them survived to 8 wk. These findings suggested that this t1/2 Cldn1 concentration for epithelial barrier function dramatically affects homeostasis in vivo. Furthermore, H&E staining showed that differentiation abnormalities of the SC were correlated with the epithelial barrier function. These results in mice suggested that AD phenotypes appeared at Cldn1 mRNA expression levels that were less than 20% of the Cldn1+/+ mRNA level. Together, these findings in mice support the notion that a decrease in CLDN1 expression levels is a critical risk factor for human AD.
We also used our series of mutant mouse lines to demonstrate the effect of decreased Cldn1 expression in adult Cldn1 mutant mice, which would be impossible to study using Cldn1 KO mice, which die within 1 d of birth. With aging, the reduced Cldn1 expression levels caused hyperkeratosis and acanthosis, with inflammation that included neutrophil and macrophage recruitment to the skin. The phenotypes of the Cldn1 KD mice mimicked human AD with respect to its morphological features, innate immune response, and spontaneous improvement with age, revealing a similarity to the natural history of infantile eczema in human AD (16). However, even after improvement, the Cldn1∆/∆ epidermis did not function comparably to the Cldn1+/+ epidermis. In this respect, the Cldn1 KD adult mice showed enhanced hapten-induced CHS responses, indicating that the recovery of the skin condition in Cldn1 KD is insufficient to defend the skin against percutaneous stimuli. Thus, our Cldn1 mutant mice provide a model system for studying the pathology of human AD at each age stage.
Two main hypotheses to explain AD have been previously proposed. The first is that an immunological imbalance of the adaptive immune response causes inflammatory lesions. In this respect, the adaptive immune response is associated with increased levels of Th2 cytokines and IgE, which play central roles in the pathogenesis of AD. Moreover, recent papers suggest that inflammation causes Cldn1 to be down-regulated (9, 28). The second hypothesis is that skin barrier defects increase the risk of developing AD. A recent study showed that mutation of the gene for filaggrin, an epidermal barrier-related protein, induces AD in humans (29). However, unlike in human AD, filaggrin-deficient mice do not show an adaptive immune response in the absence of penetrating antigen (26). Likewise, the Cldn1 KD mice in the present study did not show an adaptive immune response. In this respect, the paracellular barrier dysfunction caused by claudin-18 deficiency in TJs triggers inflammation in the mouse stomach (30), and mice with SC barrier dysfunction exhibit skin inflammation (31, 32). Considering that Cldn1 reduction affects the paracellular barrier (as shown here) and SC barrier function (11, 33), it is likely that a reduced Cldn1 expression level severely down-regulates the epidermal barrier in vivo and that the resulting changes in the skin lead to inflammation with an innate immune response. Our findings support at least the second hypothesis to explain AD and imply that the immunological features of AD may be acquired with age due to environmental effects, as a result of the disrupted barrier (34, 35). In any case, evidence suggests that CLDN1 plays an important role in either hypothesis.
On the other hand, we found that, in human AD patients, the number of macrophages was inversely correlated with the CLDN1 level although we could not find a correlation between CLDN1 staining intensity and the severity of AD or Th2 markers in the AD patients’ serum. Immunofluorescence micrographs showed that macrophages were present in the adult skin of Cldn1∆/∆ and Cldn1∆/- mice, implying that CLDN1 regulates macrophage recruitment at later stages. To further explore the correlation between barrier function and AD, experiments performed under a variety of conditions, on a large scale, and over the long term in mice and humans are required.
Our study of the in vivo response to decreased Cldn1 expression levels in mouse revealed that Cldn1 plays a critical role in AD, several features of which were related to the Cldn1 expression level. These results provide strong evidence that CLDN1-induced changes in barrier functions have potential roles in the pathogenesis, severity, and natural course of AD and suggest that the immunological features of AD depend on the external environment (Fig. 4D). Our finding that Cldn1 orchestrates the features of AD in a time- and dose-dependent manner in vivo provides insight into the etiology of AD and suggests a potential target for future therapies.
Materials and Methods
Generation of Cldn1 Mutant Mice.
Chimeric mice were generated as described (www2.clst.riken.jp/arg/Methods.html) and crossed with C57BL/6J mice to obtain heterozygous Cldn1 flox/wt mice (accession no. CDB0818K; www2.clst.riken.jp/arg/mutant%20mice%20list.html). The WT allele was distinguished by PCR using Cldn1-s1 (ggaactatcagacaagaggtgccc) as the sense, and Cldn1-as1 (cgctgtgatttaaagcagctccgc) as the antisense primer, which amplified a 408-bp fragment. The targeted allele was distinguished using Cldn1-s2 (catgagtgggaggaatgagctgg) as the sense, and Cldn1-as1 as the antisense primer, which amplified a 300-bp fragment. The deleted allele was distinguished by PCR using Cldn1-s1 as the sense, and Cldn1-as2 (cgcttgtaaacctacccaaagtgtgcc) as the antisense primer, which amplified a 645-bp fragment. All the primers used in this study are shown in Fig. S1.
Mouse Treatment.
Mice were backcrossed for five generations to C57BL/6J (Japan SLC, Inc.) and kept under SPF conditions. All animal studies in this report were approved by the Institutional Animal Care Committee of RIKEN Kobe Branch and Osaka University. The pictures of mice were captured with an EOS 50D camera (Canon) with identical settings and converted to gray scale to adjust the white balance.
Preparation of Mouse Keratinocytes.
Keratinocytes were isolated from the trunk skin of newborn mice by Dispase and cultured in the epidermal keratinocyte culture medium from CELLnTEc. Differentiation was initiated by increasing the Ca2+ concentration from 0.07 mM to 2.0 mM. For immunofluorescence and immunoblots, the cells were fixed or collected after a 24-h incubation at the high Ca2+ concentration. Barrier assays were started after the cells were incubated at the high Ca2+ concentration for 48 h.
Quantitative Real-Time RT-PCR.
Real-time PCR with SYBR Green was used to measure the mRNA levels. The RNAs were reverse transcribed to cDNA by SuperScript II reverse transcriptase. Sequences of the specific primers are listed in Table S1. The designed specific primers were described previously (30, 36–41). Gene expression was normalized to the GAPDH expression by calculating the ∆ Ct = (Ct of GAPDH − Ct of the gene). Setting the expression value of GAPDH to 1.0, the relative expression values were calculated as 2ΔCt.
Table S1.
Primers for real-time RT-PCR
| Name of gene | Sequence(5′→3′) | Refs. | |
| Forward | Reverse | ||
| Claudin-1 | CTGGAAGATGATGAGGTGCAGAAGA | CCACTAATGTCGCCAGACCTGAA | 38 |
| Claudin-3 | CAGTGTACCAACTGCGTACAAGAC | ACCGGTACTAAGGTGAGCAGAG | 38 |
| Claudin-4 | GGTAGCTCAGCTGTGACTTTGGACTC | CTGGAGTAACGTGTAGGCTGAGTGAG | 38 |
| ZO-1 | AGCTCATAGTTCAACACAGCCTCCAG | TTCTTCCACAGCTGAAGGACTCACAG | 38 |
| ZO-2 | GGAGACCAGATTCTGAAGGTGAACACAC | ACCTTTGGGGATTTCTAGCAGGTAGAGGAC | 38 |
| Occludin | GGACCCTGACCACTATGAAACAGACTAC | ATAGGTGGATATTCCCTGACCCAGTC | 38 |
| Tricellulin | GCAGGCTCCCACATCATTCTG | TTGAGGTAATCGCAACGCTCC | 38 |
| E-cadherin | AGGAAATGCACCCCTCCAAT | AATCGGCCAGCATTTTCTG | 38 |
| Keratin5 | CAGGACTGAGGAGAGGGAGCA | CGTCCAGCTGTCTACGGAGGT | 40 |
| IL-1beta | GCCTCGTGCTGTCGGACC | TGTCGTTGCTTGGTTCTCCTTG | 30 |
| IL-4 | CACCGAGTTGACCGTAACAG | GCCCTGCAGAAGGTTTCC | 39 |
| IL-10 | GGTTGCCAAGCCTTATCGGA | ACCTGCTCCACTGCCTTGCT | 34 |
| KC | GCTTGAAGGTGTTGCCCTCAG | AAGCCTCGCGACCATTCTTG | 30 |
| MCP-1 | CCTGGATCGGAACCAAATGA | CCTTAGGGCAGATGCAGTTTTAA | 37 |
| IL-12p38 | CACTCCCAAAACCTGCTGAG | TCTCTTCAGAAGTGCAAGGGTA | 39 |
| IL-12p40 | CCCTGACATTCTGCGTTCA | AGGTCTTGTCCGTGAAGACTCTA | 39 |
| IFN-gamma | CAGCAACAGCAAGGCGAAA | CTGGACCTGTGGGTTGTTGAC | 41 |
| TNFα | CCACCACGCTCTTCTGTCTAC | AGGGTCTGGGCCATAGAACT | 30 |
| GAPDH | AAGGTGGTGAAGCAGGCATCTGAG | GGAAGAGTGGGAGTTGCTGTTGAAGTC | 30 |
Barrier Function Assay.
In cultured primary keratinocytes, TER and Flux measurements were performed after keratinocyte differentiation on a Transwell filter. The TER was measured directly in culture medium using an epithelial volt–ohm meter (model Millicell-ERS; Millipore). For the paracellular tracer flux assay, 1 mg/mL 4-kDa FITC-dextran was added to the medium in the apical compartment. After a 24-h incubation, the medium was collected from the basal compartment, and the amount of FITC-dextran was determined by fluorometer. The values were normalized to that obtained for Cldn1+/+ mice. In newborn skin, the biotinylation tracer experiment was performed as previously described (10).
Evaluation of Hapten-Induced Contact Hypersensitivity.
The hapten-induced CHS was evaluated as previously described (26). We examined the tissue immune response 0, 4, 8, 12, and 24 h after DNFB challenge. For the histological analyses, samples were collected 48 h after DNFB challenge.
Human Samples.
All human samples, which were embedded in paraffin in a tissue bank, were obtained by Osaka University Hospital under an agreement that they would be used for research. The use of human skin samples for this study was approved by the ethical committee of Osaka University Graduate School of Medicine (Institutional ID of approval; 13429). We obtained 12 AD samples and 4 control samples, the detailed properties of which are noted in Dataset S1. For staining, the paraffin-embedded skin tissues were sectioned, deparaffinized with xylene, and dehydrated by a graded ethanol series. The deparaffinized sections were boiled in an oil bath for 16 min in 10 mM Tris–1 mM EDTA (pH 9.0) for antigen retrieval. The slides were rinsed with PBS and blocked with Protein Block Serum-Free solution (Dako) for 15 min. The slides were incubated with primary antibodies at room temperature for 1 h, rinsed with TBS containing 0.05% Tween, and treated with Dako LSAP + System-AP (DakoCytomation) for 25 min and Dako ChemMate Envision kit/HRP (DAB), or with second antibodies for 30 min. Slides treated with DAB were counterstained with hematoxylin and mounted with Clear Plus (Falma). Sections treated with secondary antibodies were rinsed with PBS, counterstained with 4′6′-diamidino-2-phenylindole (DAPI), and mounted in Prolong Gold (Invitrogen). Images were captured with a light microscope or with a Zeiss LSM710 laser-scanning confocal microscope (Carl Zeiss MicroImaging). Macrophages were counted by three different individuals under light microscopy (Olympus BX43; Olympus) with a UPlan N 40× N.A. 0.75 lens. For each sample, three fields were counted and averaged.
For the semiquantitative analysis, micrographs were normalized by subtracting the background intensity of the basal layers in the epidermis using ImageJ software (NIH). The outlier scores were determined by boxplot analysis using the free software R.
SI Materials and Methods
Antibodies.
Rabbit anti–claudin-1 polyclonal antibody (pAb) and mouse anti–claudin-4 monoclonal antibody (mAb) were from Invitrogen. Mouse anti–ZO-1 mAb and rat anti-occludin mAb (Moc37) were generated and characterized in the S.T. laboratory (38). Mouse anti-actin mAb was from Sigma. Rabbit anti–keratin-5 pAb and rabbit anti–keratin-10 pAb were from Covance. Rat anti–integrin-beta-4 mAb was from Abcam. Rat anti-Ki67 mAb was from Dako. Rabbit anti-Ki67 pAb was from Leica Biosystems. Rat anti-F4/80 mAb was from AbD Serotec. Rat anti–Gr-1 mAb was from BD Biosciences Pharmingen. Mouse anti-CD68 mAb was from Dako.
Evaluation of Skin Lesion.
The dermatitis score was evaluated as previously described (22). The development of erythemahemorrhage, scarring/dryness, edema, and excoriation/erosion was scored as 0 (none), 1 (mild), 2 (moderate), and 3 (severe). The sum of the individual scores was shown as the dermatitis score.
Measurement of Total IgE.
Total IgE levels in serum were measured by ELISA using a rat anti-mouse IgE mAb and an IgE ELISA kit (Yamasa).
Statistical Analysis.
In mice, at least three independent experiments were performed for each result. All values are presented as the mean ± SEM. P values were determined by Student’s t test and Spearman’s rank correlation, with P < 0.05 considered to be statistically significant. The correlation coefficient, R value, was calculated by Spearman’s rank correlation to assess the correlation between datasets, with | r | > 0.7 considered to be a statistical correlation. Box-plot analysis and the calculation of Spearman’s rank correlation were performed by the free statistical analysis software R.
Supplementary Material
Acknowledgments
We thank Tomoki Yano, Hiroo Tanaka, Mika Terao, and Katsuto Tamai for helpful discussion; Akira Yamamoto for technical assistance; Grace Gray and Leslie Miglietta for proofreading the manuscript; all members of our laboratory; and photographer Hiroshi Saito for advice about processing the mouse pictures. This research was supported in part by Grants-in-Aid for Scientific Research (A) from the Ministry of Education, Culture, Sports, Science and Technology of Japan (MEXT) (to S.T.); by Core Research for Evolutional Science and Technology (CREST) from the Japan Science and Technology Agency (JST) (S.T.); and by Grant-in-Aid for JSPS Fellows from the Japan Society for the Promotion of Science (JSPS) (R.T.).
Footnotes
The authors declare no conflict of interest.
This article is a PNAS Direct Submission.
This article contains supporting information online at www.pnas.org/lookup/suppl/doi:10.1073/pnas.1525474113/-/DCSupplemental.
References
- 1.Mineta K, et al. Predicted expansion of the claudin multigene family. FEBS Lett. 2011;585(4):606–612. doi: 10.1016/j.febslet.2011.01.028. [DOI] [PubMed] [Google Scholar]
- 2.Tsukita S, Furuse M, Itoh M. Multifunctional strands in tight junctions. Nat Rev Mol Cell Biol. 2001;2(4):285–293. doi: 10.1038/35067088. [DOI] [PubMed] [Google Scholar]
- 3.Tamura A, Tsukita S. Paracellular barrier and channel functions of TJ claudins in organizing biological systems: Advances in the field of barriology revealed in knockout mice. Semin Cell Dev Biol. 2014;36:177–185. doi: 10.1016/j.semcdb.2014.09.019. [DOI] [PubMed] [Google Scholar]
- 4.Van Itallie CM, Anderson JM. Claudins and epithelial paracellular transport. Annu Rev Physiol. 2006;68:403–429. doi: 10.1146/annurev.physiol.68.040104.131404. [DOI] [PubMed] [Google Scholar]
- 5.Hadj-Rabia S, et al. Claudin-1 gene mutations in neonatal sclerosing cholangitis associated with ichthyosis: A tight junction disease. Gastroenterology. 2004;127(5):1386–1390. doi: 10.1053/j.gastro.2004.07.022. [DOI] [PubMed] [Google Scholar]
- 6.Kirschner N, et al. Alteration of tight junction proteins is an early event in psoriasis: Putative involvement of proinflammatory cytokines. Am J Pathol. 2009;175(3):1095–1106. doi: 10.2353/ajpath.2009.080973. [DOI] [PMC free article] [PubMed] [Google Scholar]
- 7.Kirchmeier P, et al. Novel mutation in the CLDN1 gene in a Turkish family with neonatal ichthyosis sclerosing cholangitis (NISCH) syndrome. Br J Dermatol. 2014;170(4):976–978. doi: 10.1111/bjd.12724. [DOI] [PubMed] [Google Scholar]
- 8.De Benedetto A, et al. Tight junction defects in patients with atopic dermatitis. J Allergy Clin Immunol. 2011;127(3):773–86.e1-7. doi: 10.1016/j.jaci.2010.10.018. [DOI] [PMC free article] [PubMed] [Google Scholar]
- 9.Gruber R, et al. Diverse regulation of claudin-1 and claudin-4 in atopic dermatitis. Am J Pathol. 2015;185(10):2777–2789. doi: 10.1016/j.ajpath.2015.06.021. [DOI] [PubMed] [Google Scholar]
- 10.Furuse M, et al. Claudin-based tight junctions are crucial for the mammalian epidermal barrier: A lesson from claudin-1-deficient mice. J Cell Biol. 2002;156(6):1099–1111. doi: 10.1083/jcb.200110122. [DOI] [PMC free article] [PubMed] [Google Scholar]
- 11.Sugawara T, et al. Tight junction dysfunction in the stratum granulosum leads to aberrant stratum corneum barrier function in claudin-1-deficient mice. J Dermatol Sci. 2013;70(1):12–18. doi: 10.1016/j.jdermsci.2013.01.002. [DOI] [PubMed] [Google Scholar]
- 12.Hanifin JM, Rajka G. Diagnostic features of atopic dermatitis. Acta Derm Venereol Suppl (Stockh) 1980;92:44–47. [Google Scholar]
- 13.Bieber T. Atopic dermatitis. Ann Dermatol. 2010;22(2):125–137. doi: 10.5021/ad.2010.22.2.125. [DOI] [PMC free article] [PubMed] [Google Scholar]
- 14.Batista DI, et al. Profile of skin barrier proteins (filaggrin, claudins 1 and 4) and Th1/Th2/Th17 cytokines in adults with atopic dermatitis. J Eur Acad Dermatol Venereol. 2015;29(6):1091–1095. doi: 10.1111/jdv.12753. [DOI] [PubMed] [Google Scholar]
- 15.Kim BE, Leung DY. Epidermal barrier in atopic dermatitis. Allergy Asthma Immunol Res. 2012;4(1):12–16. doi: 10.4168/aair.2012.4.1.12. [DOI] [PMC free article] [PubMed] [Google Scholar]
- 16.Beltrani VS. The clinical spectrum of atopic dermatitis. J Allergy Clin Immunol. 1999;104(3 Pt 2):S87–S98. doi: 10.1016/s0091-6749(99)70050-3. [DOI] [PubMed] [Google Scholar]
- 17.Thomsen SF. Atopic dermatitis: Natural history, diagnosis, and treatment. ISRN Allergy. 2014;2014:354250. doi: 10.1155/2014/354250. [DOI] [PMC free article] [PubMed] [Google Scholar]
- 18.Leung DYM. New insights into atopic dermatitis: Role of skin barrier and immune dysregulation. Allergol Int. 2013;62(2):151–161. doi: 10.2332/allergolint.13-RAI-0564. [DOI] [PMC free article] [PubMed] [Google Scholar]
- 19.Elias PM, Wakefield JS. Mechanisms of abnormal lamellar body secretion and the dysfunctional skin barrier in patients with atopic dermatitis. J Allergy Clin Immunol. 2014;134(4):781–791.e1. doi: 10.1016/j.jaci.2014.05.048. [DOI] [PMC free article] [PubMed] [Google Scholar]
- 20.Rucker EB, 3rd, et al. Bcl-x and Bax regulate mouse primordial germ cell survival and apoptosis during embryogenesis. Mol Endocrinol. 2000;14(7):1038–1052. doi: 10.1210/mend.14.7.0465. [DOI] [PubMed] [Google Scholar]
- 21.Tamura A, et al. Achlorhydria by ezrin knockdown: Defects in the formation/expansion of apical canaliculi in gastric parietal cells. J Cell Biol. 2005;169(1):21–28. doi: 10.1083/jcb.200410083. [DOI] [PMC free article] [PubMed] [Google Scholar]
- 22.Yamamoto M, et al. A novel atopic dermatitis model induced by topical application with dermatophagoides farinae extract in NC/Nga mice. Allergol Int. 2007;56(2):139–148. doi: 10.2332/allergolint.O-06-458. [DOI] [PubMed] [Google Scholar]
- 23.Jensen J-M, et al. Impaired sphingomyelinase activity and epidermal differentiation in atopic dermatitis. J Invest Dermatol. 2004;122(6):1423–1431. doi: 10.1111/j.0022-202X.2004.22621.x. [DOI] [PubMed] [Google Scholar]
- 24.Kiekens RC, et al. Heterogeneity within tissue-specific macrophage and dendritic cell populations during cutaneous inflammation in atopic dermatitis. Br J Dermatol. 2001;145(6):957–965. doi: 10.1046/j.1365-2133.2001.04508.x. [DOI] [PubMed] [Google Scholar]
- 25.Abtin A, et al. Perivascular macrophages mediate neutrophil recruitment during bacterial skin infection. Nat Immunol. 2014;15(1):45–53. doi: 10.1038/ni.2769. [DOI] [PMC free article] [PubMed] [Google Scholar]
- 26.Kawasaki H, et al. Altered stratum corneum barrier and enhanced percutaneous immune responses in filaggrin-null mice. J Allergy Clin Immunol. 2012;129(6):1538–1546.e6. doi: 10.1016/j.jaci.2012.01.068. [DOI] [PubMed] [Google Scholar]
- 27.Hamid Q, et al. In vivo expression of IL-12 and IL-13 in atopic dermatitis. J Allergy Clin Immunol. 1996;98(1):225–231. doi: 10.1016/s0091-6749(96)70246-4. [DOI] [PubMed] [Google Scholar]
- 28.Yokouchi M, et al. Epidermal tight junction barrier function is altered by skin inflammation, but not by filaggrin-deficient stratum corneum. J Dermatol Sci. 2015;77(1):28–36. doi: 10.1016/j.jdermsci.2014.11.007. [DOI] [PubMed] [Google Scholar]
- 29.Palmer CN, et al. Common loss-of-function variants of the epidermal barrier protein filaggrin are a major predisposing factor for atopic dermatitis. Nat Genet. 2006;38(4):441–446. doi: 10.1038/ng1767. [DOI] [PubMed] [Google Scholar]
- 30.Hayashi D, et al. Deficiency of claudin-18 causes paracellular H+ leakage, up-regulation of interleukin-1β, and atrophic gastritis in mice. Gastroenterology. 2012;142(2):292–304. doi: 10.1053/j.gastro.2011.10.040. [DOI] [PubMed] [Google Scholar]
- 31.Descargues P, et al. Spink5-deficient mice mimic Netherton syndrome through degradation of desmoglein 1 by epidermal protease hyperactivity. Nat Genet. 2005;37(1):56–65. doi: 10.1038/ng1493. [DOI] [PubMed] [Google Scholar]
- 32.Nakajima K, et al. Barrier abnormality due to ceramide deficiency leads to psoriasiform inflammation in a mouse model. J Invest Dermatol. 2013;133(11):2555–2565. doi: 10.1038/jid.2013.199. [DOI] [PubMed] [Google Scholar]
- 33.Kirschner N, et al. Contribution of tight junction proteins to ion, macromolecule, and water barrier in keratinocytes. J Invest Dermatol. 2013;133(5):1161–1169. doi: 10.1038/jid.2012.507. [DOI] [PubMed] [Google Scholar]
- 34.Kitagaki H, et al. Repeated elicitation of contact hypersensitivity induces a shift in cutaneous cytokine milieu from a T helper cell type 1 to a T helper cell type 2 profile. J Immunol. 1997;159(5):2484–2491. [PubMed] [Google Scholar]
- 35.Kabashima K. New concept of the pathogenesis of atopic dermatitis: Interplay among the barrier, allergy, and pruritus as a trinity. J Dermatol Sci. 2013;70(1):3–11. doi: 10.1016/j.jdermsci.2013.02.001. [DOI] [PubMed] [Google Scholar]
- 36.Jofre-Monseny L, et al. Effects of apoE genotype on macrophage inflammation and heme oxygenase-1 expression. Biochem Biophys Res Commun. 2007;357(1):319–324. doi: 10.1016/j.bbrc.2007.03.150. [DOI] [PMC free article] [PubMed] [Google Scholar]
- 37.Ihara Y, et al. Upregulation of the ligand-RAGE pathway via the angiotensin II type I receptor is essential in the pathogenesis of diabetic atherosclerosis. J Mol Cell Cardiol. 2007;43(4):455–464. doi: 10.1016/j.yjmcc.2007.07.044. [DOI] [PubMed] [Google Scholar]
- 38.Yamazaki Y, Tokumasu R, Kimura H, Tsukita S. Role of claudin species-specific dynamics in reconstitution and remodeling of the zonula occludens. Mol Biol Cell. 2011;22(9):1495–1504. doi: 10.1091/mbc.E10-12-1003. [DOI] [PMC free article] [PubMed] [Google Scholar]
- 39.Nakajima K, et al. Distinct roles of IL-23 and IL-17 in the development of psoriasis-like lesions in a mouse model. J Immunol. 2011;186(7):4481–4489. doi: 10.4049/jimmunol.1000148. [DOI] [PubMed] [Google Scholar]
- 40.Romano R-A, et al. ΔNp63 knockout mice reveal its indispensable role as a master regulator of epithelial development and differentiation. Development. 2012;139(4):772–782. doi: 10.1242/dev.071191. [DOI] [PMC free article] [PubMed] [Google Scholar]
- 41.Zhou J, et al. TREM-1 inhibition attenuates inflammation and tumor within the colon. Int Immunopharmacol. 2013;17(2):155–161. doi: 10.1016/j.intimp.2013.06.009. [DOI] [PubMed] [Google Scholar]
Associated Data
This section collects any data citations, data availability statements, or supplementary materials included in this article.


