Significance
The bacterial toxin Clostridium difficile transferase (CDT) depolymerizes actin and forms microtubule-based cell protrusions suggested to be involved in cell adherence of bacteria. Here we report that GTP-binding septin proteins initiate protrusion formation. Accumulation of septins at sites of protrusion initiation depends on the small GTPase Cdc42 (cell division control protein 42) and its effector Borg (binder of Rho GTPases). CDT-induced septin accumulations at the cell membrane guide microtubules to form cell protrusions. Septins directly interact with the microtubule plus-end tracking protein EB1. Thus, the toxin exploits septin-dependent regulation of microtubules to form cell protrusions.
Keywords: microtubules, septins, actin, bacterial toxin, Clostridium difficile
Abstract
Hypervirulent Clostridium difficile strains, which are associated with increased morbidity and mortality, produce the actin-ADP ribosylating toxin Clostridium difficile transferase (CDT). CDT depolymerizes actin, causes formation of microtubule-based protrusions, and increases pathogen adherence. Here, we show that septins (SEPT) are essential for CDT-induced protrusion formation. SEPT2, -6, -7, and -9 accumulate at predetermined protrusion sites and form collar-like structures at the base of protrusions. The septin inhibitor forchlorfenuron or knockdown of septins inhibits protrusion formation. At protrusion sites, septins colocalize with the GTPase Cdc42 (cell division control protein 42) and its effector Borg (binder of Rho GTPases), which act as up-stream regulators of septin polymerization. Precipitation and surface plasmon resonance studies revealed high-affinity binding of septins to the microtubule plus-end tracking protein EB1, thereby guiding incoming microtubules. The data suggest that CDT usurps conserved regulatory principles involved in microtubule–membrane interaction, depending on septins, Cdc42, Borgs, and restructuring of the actin cytoskeleton.
The pathogen Clostridium difficile is the causative agent of pseudomembranous colitis and antibiotic-associated diarrhea (1). Recently emerging hypervirulent strains (e.g., NAP1/027) have been associated with severe courses of C. difficile infections with increased morbidity and mortality (2). These strains have deletions in regulatory genes, resulting in overexpression of the Rho-inactivating glycosylating toxins A and B (3). Additionally, they produce the binary toxin C. difficile transferase (CDT) (2, 4). CDT ADP ribosylates actin at arginine-177, thereby inhibiting actin polymerization (5–7).
CDT-induced depolymerization of F-actin induces formation of long microtubule-based protrusions, which form a meshwork on the surface of intestinal host cells (8). Clostridia are enwrapped by the protrusions, resulting in increased pathogen adherence. In addition to microtubules, the protrusions contain membrane tubules of endoplasmic reticulum and allow traffic of Rab5- and Rab11-positive vesicles (9). Moreover, CDT induces rerouting of fibronectin-containing vesicles from the basolateral to the apical side of intestinal epithelial cells. Here, fibronectin, a binding protein for Clostridium difficile, is released at microtubule-based protrusions, suggesting that the cell-surface extensions participate in host–pathogen interaction (9).
Protrusion formation occurs in membrane areas where CDT causes partial depolymerization of cortical actin (8). The toxin induces the redistribution of microtubule capture proteins such as Clasp2 and ACF7, which are normally associated with cortical actin, from the membrane to the cytosolic fraction, suggesting that CDT alters the functions of the capture proteins. Also, the cholesterol content of membranes was found to be crucial for protrusion formation (10). So far, however, the molecular mechanisms involved in formation of CDT-induced cell protrusions are largely unknown.
We asked whether septins (SEPT), which interact with both F-actin and microtubules, are involved in toxin-induced restructuring of the cytoskeleton and formation of protrusions. Septins are conserved GTP-binding proteins, which form hetero-oligomers and polymers, and are considered as the fourth component of the cytoskeleton in addition to microfilaments, microtubules, and intermediate filaments (11–13). Septins are involved in numerous functions, including cytokinesis, ciliogenesis, neurite development, and exocytosis (14–17). They have scaffold functions, act as membrane diffusion barriers, and are involved in host–pathogen interactions. Septins locate to cell membranes, where they control the stiffness/rigidity and the shape of membranes.
Here, we report that formation of CDT-induced protrusions depends on septins, which are located at the base of the protrusions. Septins are involved in early steps of protrusion formation and guide microtubules from the cytosol into emerging protrusions at the cell membrane, a process that probably involves the plus-end tracking protein EB1 (end-binding protein 1). Cell division control protein 42 (Cdc42) and its effector Borg (binder of Rho GTPases), which are up-stream regulators of septins, control CDT-induced protrusion formation (18). The data indicate that CDT exploits a highly conserved regulatory pathway of microtubule–membrane interaction.
Results
Septin Translocation After CDT Treatment.
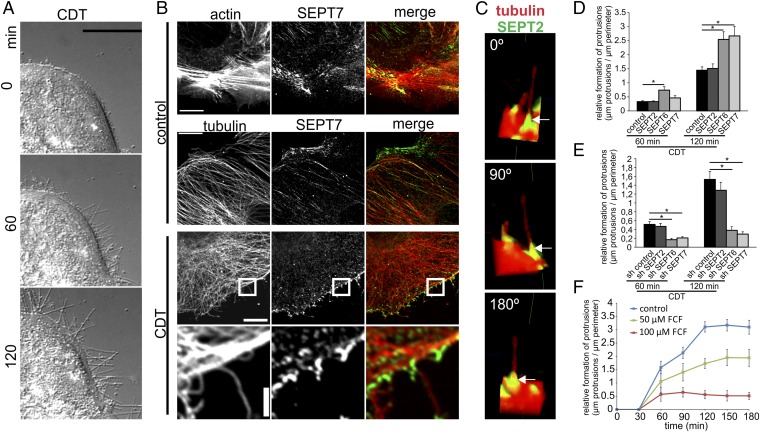
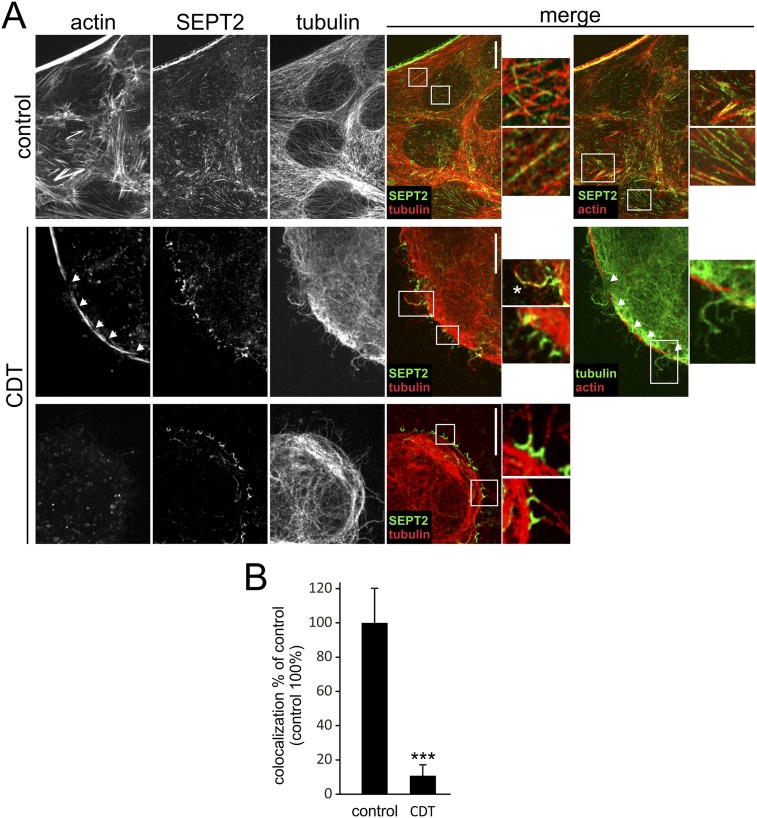
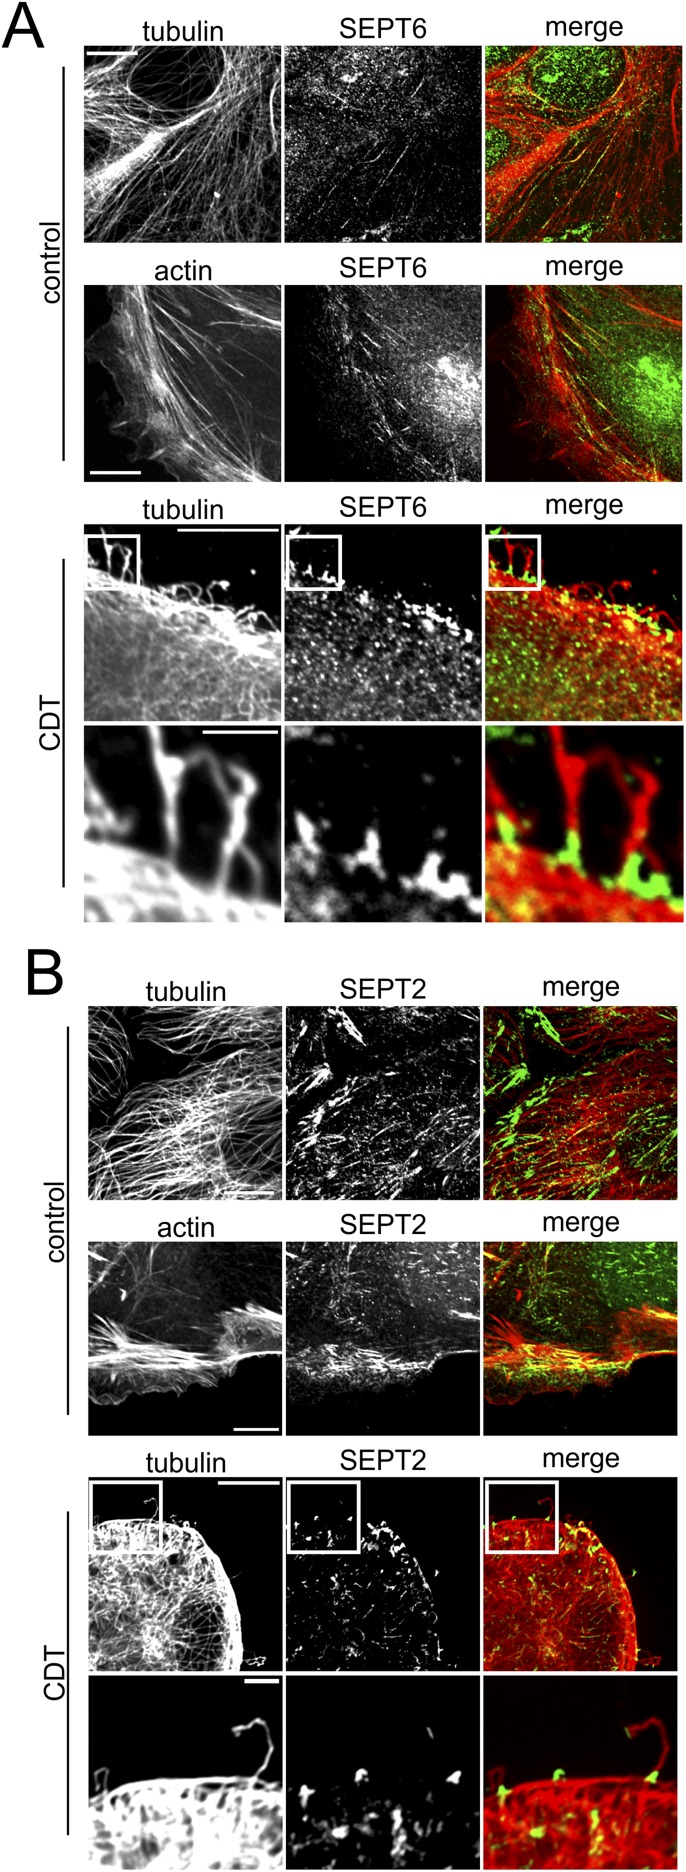
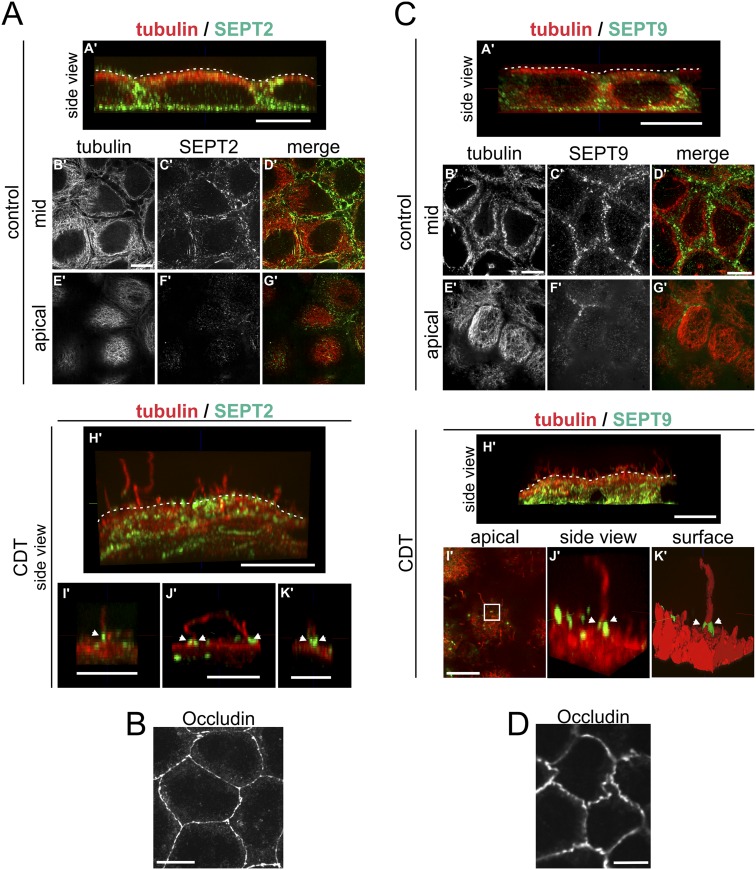
In human colon adenocarcinoma Caco-2 cells, CDT induced the formation of microtubule-based membrane protrusions 40–60 min after toxin addition (Fig. 1A). Protrusion formation was paralleled by partial destruction of the actin cytoskeleton (Fig. S1A). Changes in the actin and microtubule cytoskeleton were accompanied by major remodeling and relocalization of septins. In untreated cells, septins were found associated mainly with actin filaments and partially with the microtubule lattice (Fig. 1B, Fig. S1A, and Fig. S2 A and B). After treatment with CDT, septins originally associated with cortical actin lost the colocalization during actin depolymerization (Fig. S1 A and B). The major fraction of septins developed structures resembling circles and arches at the base of CDT-induced protrusion. In some cases, septins also colocalized along the microtubules within protrusions (Fig. S1A). Notably, septins appeared at membranes early after CDT addition at sites of very small protrusions, which had just started to grow. Immunofluorescence studies revealed participation of SEPT2, -6, and -7 in this process (Fig. 1B and Fig. S2 A and B). In 3D reconstructions, septins accumulated at the apical surface of cells resembling a collar or arch at the protrusion base (Fig. 1C). These structures were also observed with polarized Caco-2 cells (Fig. S3 A and B). Here, SEPT9 also was part of septin accumulations (Fig. S3 C and D), whereas less SEPT9 was observed in subconfluent cells. Similarly, CDT caused septin-colocalized protrusions in polarized Madin-Darby canine kidney (MDCK) cells (Fig. S4 A and B). Moreover, in primary colon epithelial cells, septins accumulated at the base of CDT-induced protrusions (Fig. S5).
Fig. 1.
Membrane translocation of septins after CDT treatment and their role in protrusion formation. (A) Differential interference contrast (DIC) time-lapse microscopy of Caco-2 cells. Cells were treated with CDT (200 ng/mL CDTa and 400 ng/mL CDTb) for the indicated times. (Scale bar, 20 µm.) (B) Indirect immunofluorescence in Caco-2 cells of SEPT7 (green) with actin (red, TRITC-phalloidin) or of SEPT7 (green) and α-tubulin (red). Cells were treated with CDT (200 ng/mL CDTa and 400 ng/mL CDTb) for 90 min. (Scale bars: 10 µm; Insets, 2 µm.) (C) Indirect immunofluorescence in Caco-2 cells of SEPT2 and α-tubulin. Cells were treated with CDT as in B. Images are 3D reconstructions of apical protrusions from different angles. (D) Caco-2 cells were transfected with shRNA for SEPT2, SEPT6, and SEPT7, respectively. After 48 h, cells were treated as in A. The relative formation of protrusions (“µm protrusions/µm cell perimeter”) was quantified. Data are ± SEM, cells are ≥56, and n ≥ 3. (E) Caco-2 cells were transfected with expression plasmids encoding SEPT2, SEPT6, and SEPT7, respectively, fused to GFP. Relative formation of protrusions was quantified. Data are ± SEM, cells are ≥75, and n ≥ 3. (F) Caco-2 cells were treated with 50 or 100 µM of FCF for 2.5 h. Subsequently, cells were treated with CDT (as in A).The relative formation of protrusions was quantified over time. Data are ± SEM, fields of view are ≥20, and n = 3.
Fig. S1.
Loss of actin–septin interaction after CDT treatment. (A) Indirect immunofluorescence of SEPT2 and α-tubulin in Caco-2 cells together with actin stained by TRITC-conjugated phalloidin. Cells were treated with CDT (200 ng/mL CDTa and 400 ng/mL CDTb) for 90 min. Insets show chevron-like and semicircular septin structures at the base of protrusions. An asterisk marks a protrusion that also has septins along the protrusion shaft. Protrusions are formed at sites of weakened or lost cortical actin (arrows). (Scale bars, 10 µm.) (B) Quantification of the colocalization of septins and actin (percentage of septins colocalizing with actin). Cells were treated with CDT (200 ng/mL CDTa and 400 ng/mL CDTb) for 90 min. Controls were set at 100%. Septins lost the association with actin in the course of intoxication.
Fig. S2.
Membrane translocation of septins after CDT treatment. (A) Indirect immunofluorescence in Caco-2 cells of SEPT6 (green) together with actin (red) stained by TRITC-conjugated phalloidin or indirect immunofluorescence of SEPT6 (green) and α-tubulin (red). Cells were treated with CDT (200 ng/mL CDTa and 400 ng/mL CDTb) for 90 min. (Scale bars, 10 µm; Insets, 2 µm.) (B) Indirect immunofluorescence in Caco-2 cells of SEPT2 (green) together with actin (red) stained by TRITC-conjugated phalloidin or indirect immunofluorescence of SEPT2 (green) and α-tubulin (red). Cells were treated with CDT (200 ng/mL CDTa and 400 ng/mL CDTb) for 90 min. (Scale bars, 10 µm; Insets, 2 µm.)
Fig. S3.
Membrane translocation of SEPT2 and SEPT9 after CDT treatment in polarized cells. (A) Polarized Caco-2 cells were stained by indirect immunofluorescence for SEPT2 (green) together with α-tubulin (red). Cells were treated with CDT (200 ng/mL CDTa and 400 ng/mL CDTb) for 90 min. The figure shows images representing side views of 3D-reconstructed confocal stacks (side view: A', H', I', J', K'). Additionally, single planes of confocal stacks originally covering the cell from top to bottom are shown. The single planes are from the cell mid (mid: B', C', D') or from the apical cell surface (apical: E', F', G'). SEPT2 was present at the base of the cell (A') and the cell periphery (A'–D'). Almost no SEPT2 was detected at the apical surface of the cells (E'–G'). After CDT treatment, cells formed protrusions at the apical cell surface (H'). SEPT2 formed apical clusters at the base of protrusions (I', J', K', white arrowheads). (Scale bars, 10 μm in A'–H'; 5 μm in I', J', K'). (B) As in A, cells were cultured for the same time at the same density. Tight junctions were stained by indirect immunofluorescence for occludin as a marker for differentiation and polarization. (Scale bar, 10 μm.) (C) Polarized Caco-2 cells were stained by indirect immunofluorescence for SEPT9 (green) together with α-tubulin (red). Cells were treated with CDT (200 ng/mL CDTa and 400 ng/mL CDTb) for 90 min. The figure shows images representing side views of 3D-reconstructed confocal stacks (side view: A', H', J') and a 3-D surface reconstruction (surface: K'). Additionally, single planes of confocal stacks originally covering the cell from top to bottom are shown. The single planes are from the cell mid (mid: B', C', D') or from the apical cell surface (apical: E', F', G', I'). In subconfluent cells, SEPT9 staining of cells was weak. In polarized cells, SEPT9 was present at the base and the cell periphery (A'–D'). Almost no SEPT9 was detected at the apical surface of the cells (E', F', G'). After CDT treatment, cells formed protrusions at the apical surface (H'), SEPT9 formed apical clusters at the base of protrusions (I', J', K', white arrowheads, J' and K' are reconstructions of the white box in I'). (Scale bars, 10 μm.) (D) As in C, cells were cultured for the same time at the same density. Tight junctions were stained by indirect immunofluorescence for occludin as a marker for differentiation and polarization. (Scale bar, 10 μm.)
Fig. S4.
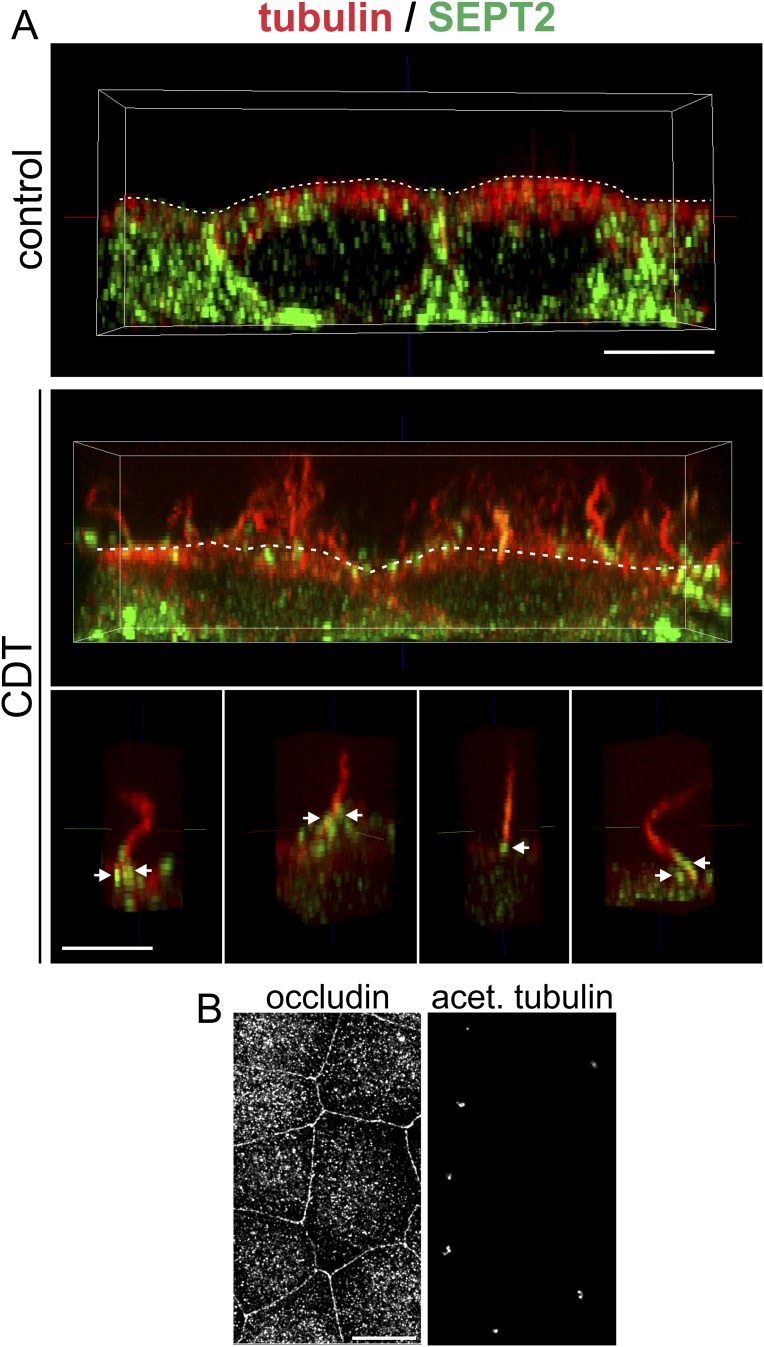
Formation of microtubule-based protrusions with septin base in polarized MDCK cells. (A) Indirect immunofluorescence of SEPT2 (green) and α-tubulin (red) in MDCK cells. (Upper) A side view of polarized untreated MDCK cells. (Middle) A side view of CDT-treated (200 ng/mL CDTa and 400 ng/mL CDTb for 90 min) MDCK cells. Above the apical surface (white, dashed line), microtubule-based protrusions have formed in high density. (Lower) A side view of individual microtubule-based protrusions with septin accumulations at their base (white arrows). (Scale bar, 5 µm.) (B) In parallel to the experiment in A, cells were cultured for the same time at the same density. Tight junctions were stained by indirect immunofluorescence for occluding, and cilia were stained by indirect immunofluorescence for acetylated tubulin as markers for differentiation and polarization. (Scale bar, 10 µm.)
Fig. S5.
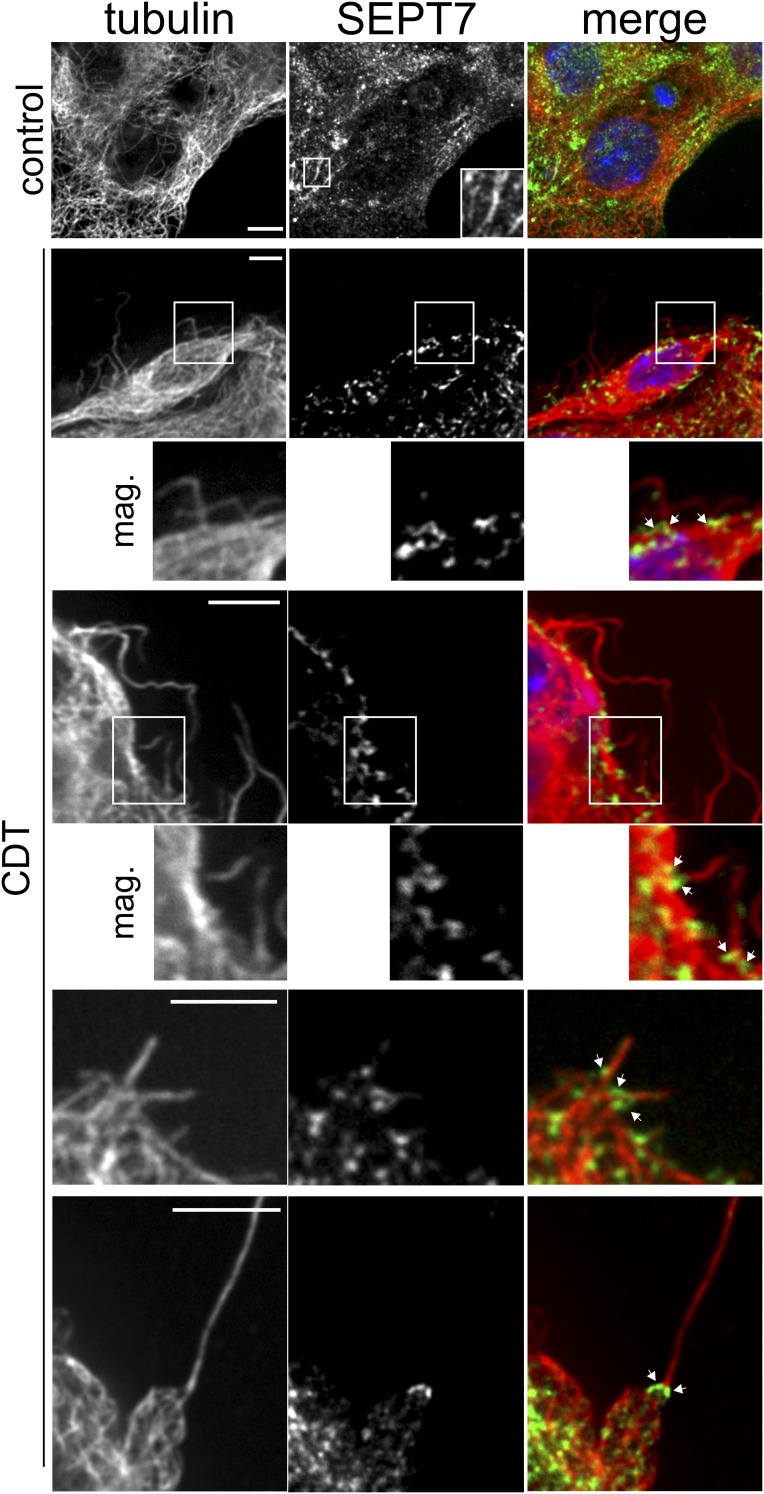
Formation of microtubule-based protrusions with septin base in primary colonocytes. Indirect immunofluorescence of primary mouse colonocytes for SEPT7 (green) and α-tubulin (red) after 24–36 h in vitro. Cells were treated with 20 ng/mL CDTa and 40 ng/mL CDTb for 1.5 h. Control cells show a similar septin organization as cell lines (first line of images). After CDT treatment, microtubule-based protrusions are formed with septins at their base (gallery starting the second line of images; septin accumulations are marked by white arrows). Magnifications of Insets are below or within the images. (Scale bars, 5 µm.)
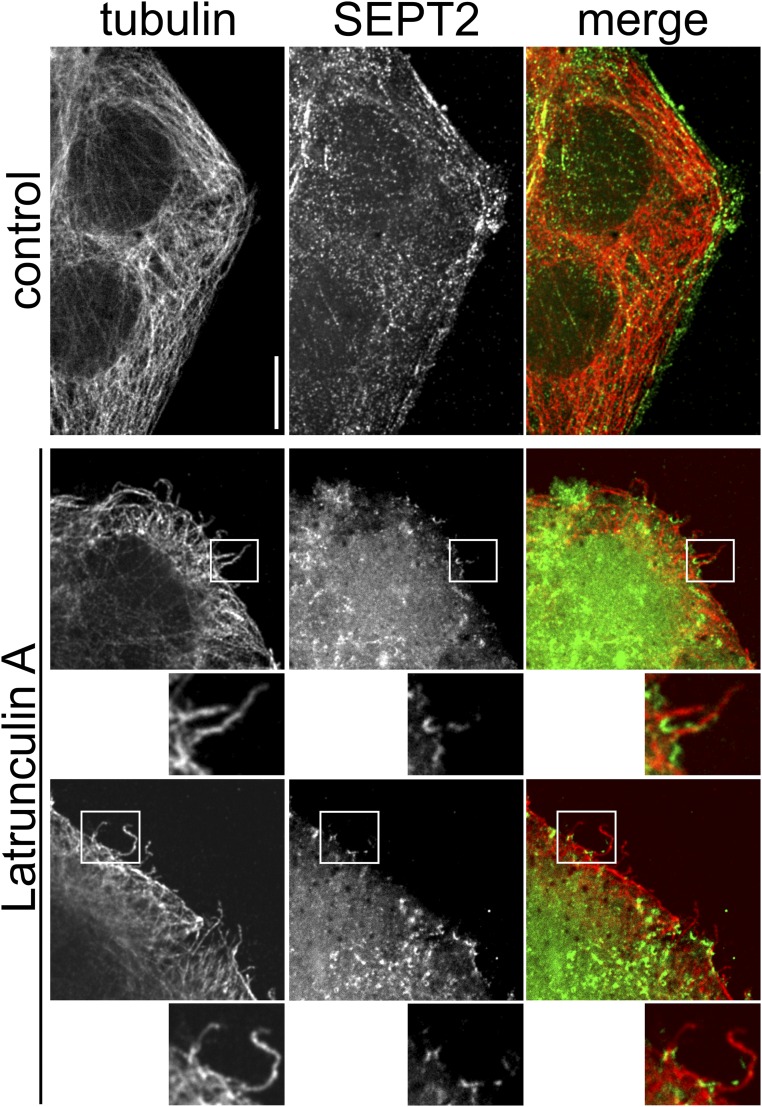
Previous studies showed that other F-actin–depolymerizing toxins (e.g., Clostridium botulinum C2 toxin), which ADP-ribosylate actin, induce protrusion formation (8). Moreover, the macrolide toxin latrunculin A, which depolymerizes F-actin by a different mechanism (19), causes protrusion formation, although less pronounced than actin-ADP–ribosylating toxins (8). We observed that also latrunculin A induced protrusion-associated septin accumulations (Fig. S6), indicating a general cellular mechanism.
Fig. S6.
Formation of microtubule-based protrusions with septin base after latrunculin A treatment. Indirect immunofluorescence of SEPT2 (green) and α-tubulin (red) in Caco-2 cells. Cells were treated with 5 nM latrunculin A for 60 min. Treatment with latrunculin A causes similar septin accumulations at the base of protrusions as a treatment with CDT does. Magnifications of Insets are below the images. (Scale bar, 5 µm.)
Septins Are a Prerequisite for Protrusion Formation.
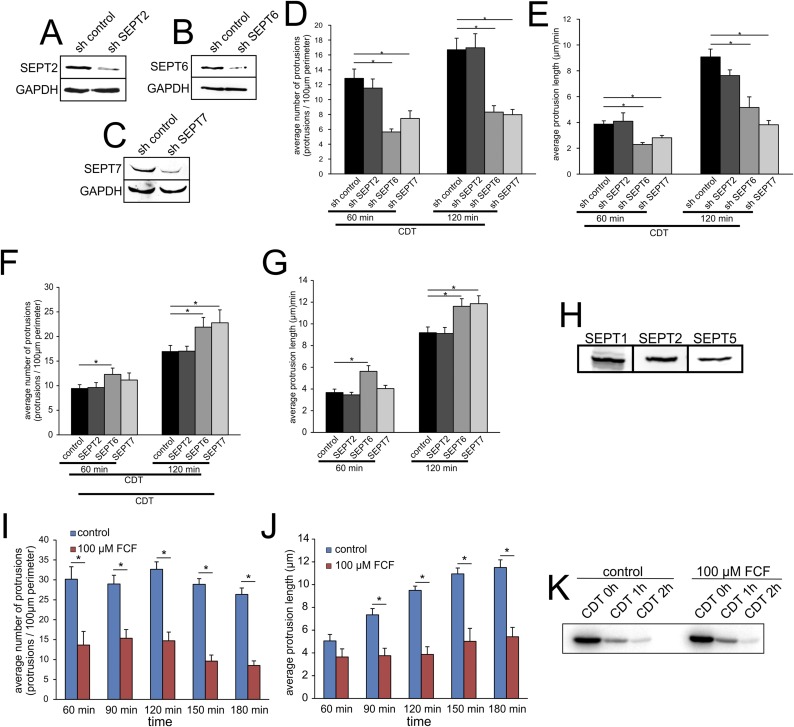
To study whether septin translocation is a prerequisite for protrusion formation, we used shRNA knockdowns of SEPT2, -6, and -7 (Fig. 1E and Fig. S7 A–E). Knockdown of SEPT6 and -7, but not of SEPT2, reduced protrusion formation (Fig. 1E). On the other hand, overexpression of SEPT6 and -7, but not of SEPT2, increased protrusion formation (Fig. 1D and Fig. S7 F and G). In Caco-2 cells, another septin might take over for SEPT2 because other SEPT2 family members were detected (Fig. S7H). The septin inhibitor forchlorfenuron (FCF), which interferes with septin dynamics (20), reduced protrusion formation (Fig. 1F and Fig. S7 I and J). FCF did not affect CDT-induced ADP ribosylation of actin in intact cells, thereby excluding interference of the compound with uptake or enzyme activity of CDT (Fig. S7K). Notably, SEPT6 and -7 knockdown, SEPT6 and -7 overexpression, and FCF treatment affected the overall number of protrusions as well as the average length of protrusion.
Fig. S7.
The role of septins in protrusion formation. (A) Western blot of HeLa cells after SEPT2 knockdown by shRNA. (B) Western blot of HeLa cells after SEPT6 knockdown by shRNA. (C) Western blot of HeLa cells after SEPT2 knockdown by shRNA. (D) Quantification of average number of protrusions after 48 h of transfection with control shRNA and shRNA targeting SEPT2, SEPT6, or SEPT7. Cells were intoxicated with 200 ng/mL CDTa and 400 ng/mL CDTb to induce protrusion formation for the indicated times. Data are given ± SEM, cells are ≥56, and n ≥ 3. (E) Quantification of average protrusion length after 48 h of transfection with control shRNA and shRNA targeting SEPT2, SEPT6, or SEPT7. Cells were intoxicated with 200 ng/mL CDTa and 400 ng/mL CDTb to induce protrusion formation for the indicated times. Data are given ± SEM, cells are ≥56, and n ≥ 3. (F) Quantification of average number of protrusions after 24 h overexpression of GFP, GFP-SEPT2, SEPT6, or SEPT7. Cells were intoxicated with 200 ng/mL CDTa and 400 ng/mL CDTb to induce protrusion formation for the indicated times. Data are given ± SEM, cells are ≥75, and n ≥ 3. (G) Quantification of average protrusion length after 24 h overexpression of GFP, GFP-SEPT2, SEPT6, or SEPT7. Cells were intoxicated with 200 ng/mL CDTa and 400 ng/mL CDTb to induce protrusion formation for the indicated times. Data are given ± SEM, cells are ≥75, and n ≥ 3. (H) Representative Western blot of Caco-2 cell lysate with detection for SEPT1, SEPT2, and SEPT5. (I) Quantification of average number of protrusions over time with or without FCF pretreatment. Cells were intoxicated with 200 ng/mL CDTa and 400 ng/mL CDTb to induce protrusion formation. Data are given ± SEM, fields of view are ≥20, and n = 3. (J) Quantification of average length of protrusions over time with or without FCF pretreatment. Cells were intoxicated with 200 ng/mL CDTa and 400 ng/mL CDTb to induce protrusion formation. Data are given ± SEM, fields of view are ≥20, and n = 3. (K) Caco-2 cells were pretreated for 2.5 h with FCF. Cells were intoxicated with 200 ng/mL CDTa and 400 ng/mL CDTb for the indicated times. The autoradiogram shows the ongoing ADP ribosylation of actin in the presence or absence of FCF.
Septins Are in Complex with the Cdc42 Effector Borg.
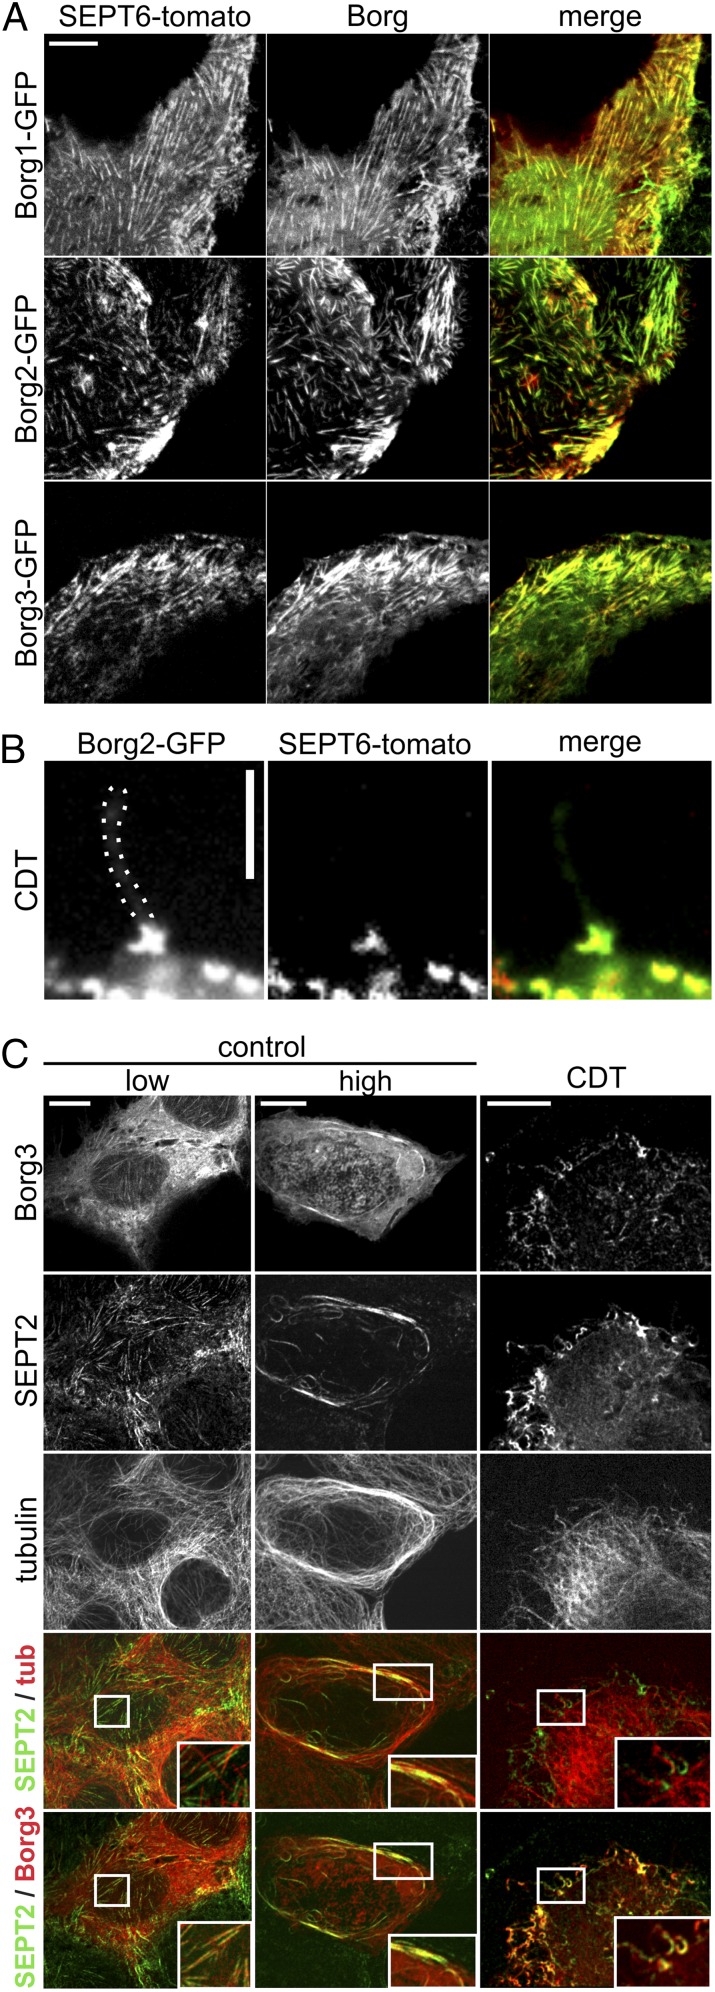
Cdc42 and its effector proteins Borg are involved in regulation of septins (21). Therefore, we studied whether Borgs play a role in CDT-induced protrusion formation. We found that in Caco-2 cells septins colocalized with expressed GFP-tagged versions of the Cdc42 effector proteins Borg 1, -2, and -3 in filamentous structures (Fig. 2A). After intoxication with CDT, septins formed chevron-like structures at the membrane, and Borgs were localized at the base of toxin-induced protrusions as a part of these structures (Fig. 2 B and C). Control cells with a strong Borg expression showed an increased microtubule density and bundling at the cell cortex. These microtubule bundles strongly associated with thick septin filaments (Fig. 2C).
Fig. 2.
Borg proteins colocalize with septins. (A) Caco-2 cells were transfected with SEPT6-tomato and Borg1-, Borg2-, and Borg3-GFP. Cells were treated with CDT (200 ng/mL CDTa and 400 ng/mL CDTb) for 90 min. Borg proteins colocalize with septins. (B) Caco-2 cells were transfected with SEPT6-tomato and Borg2-GFP. Cells were treated as in A. Borg2 colocalizes with SEPT6 at the base of protrusions. (Scale bar, 3 μm.) (C) Caco-2 cells were transfected with Borg3-GFP and treated with CDT as in A. Cells were stained for SEPT2 and tubulin. (Insets) Septin colocalization with microtubles and Borg in control cells. In CDT-treated cells, Insets show chevron-like structures at the protrusion base and colocalization of septins and Borg. (Scale bars, 10 µm.)
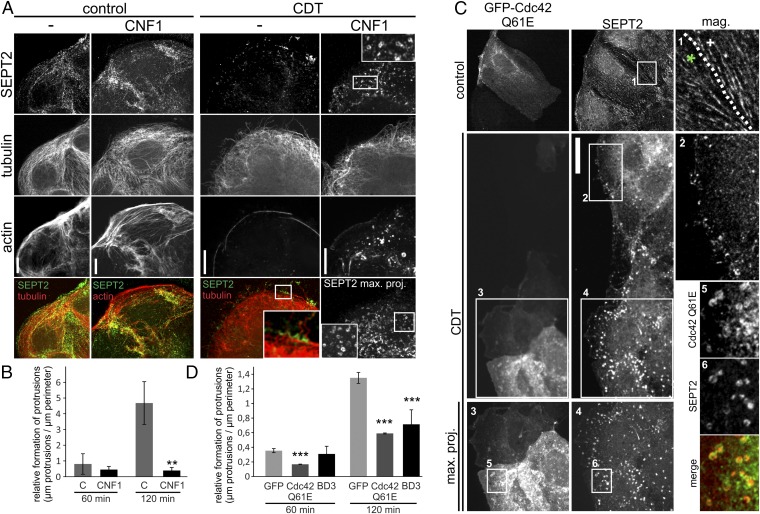
Next, we analyzed the effects of the Cdc42-activating toxin cytotoxic necrotizing factor (CNF1) (22, 23). Whereas CNF1 alone affected the actin cytoskeleton and increased formation of stress fibers, the toxin caused minor or no changes of the septin cytoskeleton. In CNF1-pretreated cells, CDT strongly increased formation of septin rings all over the cell. At the cortex, the chevron-like septin accumulations were changed to an undirected formation of septin rings (Fig. 3A). Concomitantly, CNF1 pretreatment strongly reduced protrusion formation (Fig. 3B), indicating that accumulation and/or functions of septins are downstream of Cdc42 and its effector protein Borg.
Fig. 3.
Influence of Cdc42 on septin accumulation. (A) Caco-2 cells were pretreated with 150 ng/mL CNF1 for 3 h to activate Rho-GTPases. Cells were subsequently treated with CDT (200 ng/mL CDTa and 400 ng/mL CDTb) for 1.5 h. Cells were stained for SEPT2, α-tubulin, and actin. To visualize all septin rings in CNF1 plus CDT-treated cells, confocal stacks were projected into one plane. Insets show chevron-like structures at the base of protrusions in CDT-treated cells. In CNF1- and CDT-treated cells, Insets show septin-ring formation. (Scale bar, 10 µm.) (B) Caco-2 cells were treated as in A. The relative formation of protrusions (“µm protrusions/µm cell perimeter”) was quantified after 60 and 120 min of CDT intoxication. Data are ± SEM, fields of view are ≥7, and n = 3. (C) Caco-2 cells were transfected with dominant active Cdc42 (Q61E) for 24 h. Cells were treated with CDT as in A. Inset in “control” shows septin filaments in transfected (green asterisk) and nontransfected (white cross) cells. To visualize all septin rings in transfected CDT-treated cells, confocal stacks were projected into one plane. Insets show cortical septin structures in CDT-treated cells. In transfected CDT-treated cells, Insets show septin ring formation. Septin rings colocalize with dominant active Cdc42. (Scale bar, 10 µm.) (D) Caco-2 cells were treated as in C. Control cells were transfected with GFP only. Cells were also transfected with the BD3 domain of Borg2 fused to GFP. Relative formation of protrusions was quantified after 60 and 120 min. Data are ± SEM, transfected cells are ≥13, and n = 3.
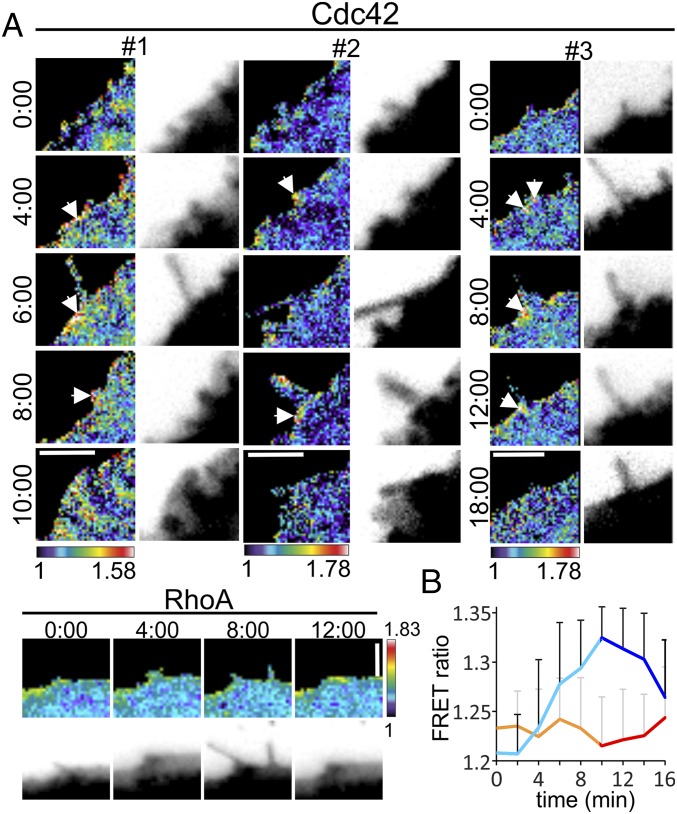
Similarly, expression of dominant active Cdc42 Q61E had no effect on septins after 24 h of transfection. However, after CDT-induced partial destruction of the actin cytoskeleton, the overexpression of Cdc42 Q61E had a similar effect as CNF1 with strongly increased formation of septin rings (Fig. 3C). The septin rings colocalized with expressed GFP-Cdc42 Q61E, suggesting that the GTPase Cdc42 is causally linked to ring formation. Moreover, dominant active Cdc42 inhibited the formation of protrusions (Fig. 3D). In line with these findings, we observed that expression of the BD3 domain of Borg2, which was shown to interact with septins, inhibited protrusion formation (Fig. 3D) (21). To analyze the spatiotemporal regulation of Cdc42, cells were transfected with a FRET sensor (24, 25). After 24 h, transfected cells were treated with CDT and the activation of Cdc42 was monitored 1 h after toxin addition. The base of protrusions revealed increased Cdc42 activity in ratio imaging (Fig. 4 A and B). In contrast, no increased RhoA activation was observed.
Fig. 4.
Cdc42 activation in CDT-induced protrusion formation. (A) Caco-2 cells were transfected with a FRET sensor for Cdc42 or RhoA. Cells were intoxicated with CDT (200 ng/mL CDTa and 400 ng/mL CDTb) for 40–80 min. Sites of protrusion formation have increased Cdc42 activity (arrowheads). Rho activity is not increased at these sites. The nomenclature “#1,” “#2,” and “#3” represents three protrusion formation events with the Cdc42 FRET sensor. Time is indicated on the left (Cdc42) or above (RhoA). Donor images are on the right (Cdc42) or below (RhoA) with inverted contrast. (Scale bars, 5 µm.) (B) Quantification of FRET intensity of Cdc42 and RhoA constructs during protrusion formation.Cells were treated as in A. When the protrusions appear, the curve turns from orange to red (RhoA) or from turquoise to blue (Cdc42). Data are ± SEM, n = 8 for Cdc42, and n = 6 for RhoA).
Septins Guide the Way of Microtubules.
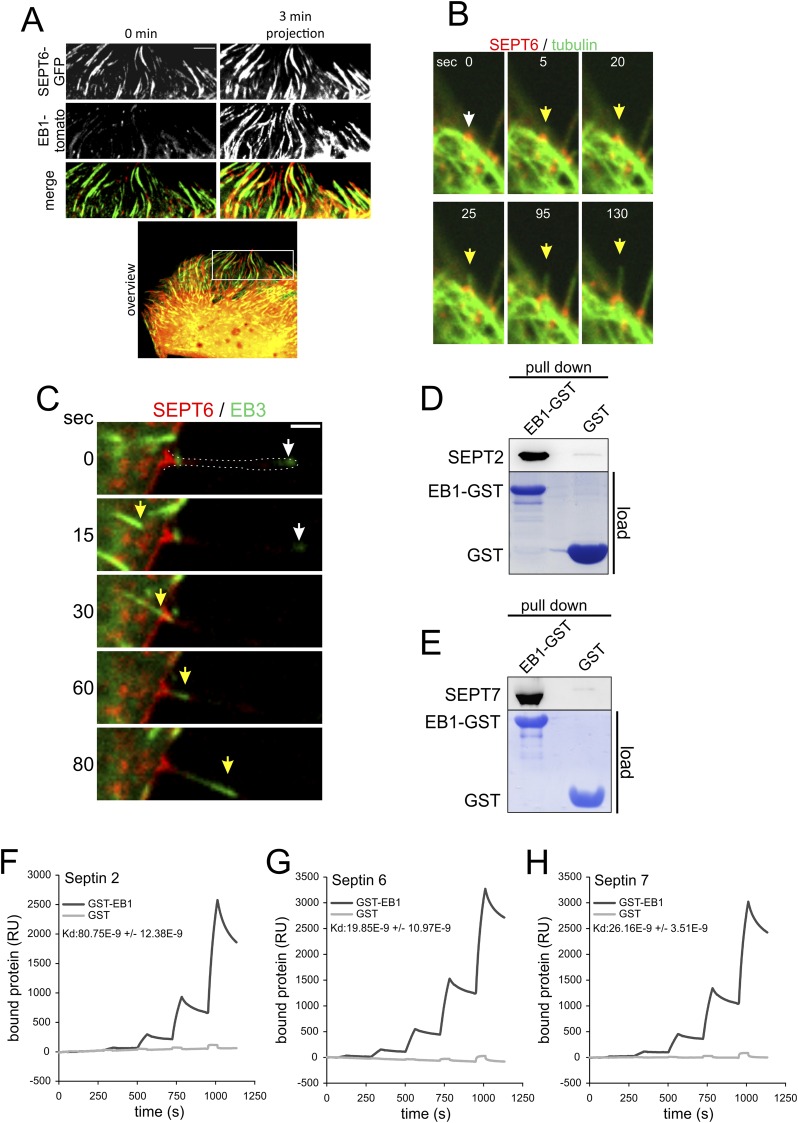
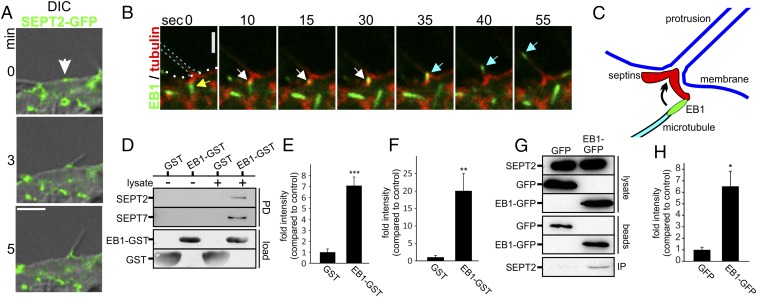
Fig. S8A shows plus-end tracks of polymerizing microtubules, labeled by EB1, which moved along septin filaments. In control cells, microtubules polymerize along septin tracks. Upon CDT-induced actin depolymerization, septins were located at actin-free sites of the membrane, forming unstructured clusters (Fig. 5A and Fig. S8B). These clusters were predetermined sites of protrusion formation. During initial growth and elongation of microtubule-based protrusion, the septin accumulations mature to typical arch- or chevron-like structures (Fig. 1B). After formation of a stable septin base at the protrusion–cell membrane interface, further polymerizing microtubules follow the leading microtubule in the same track (Fig. S8C). Also microtubules that do not polymerize in the same track are redirected at the protrusion base into the protrusion (Fig. 5 B and C).
Fig. S8.
Microtubules are guided along septins. (A) Caco-2 cells were transfected with SEPT6-GFP and EB1-tomato. A short timelapse-sequences were acquired with 3 min duration. The images from a 3 min movie were projected into one plane to visualize microtubule tracks. (B) Caco-2 cells were transfected with SEPT6-tomato and tubulin-GFP. The images show a 130 s timelapse sequence after 1.5 h CDT intoxication (200 ng/mL CDTa and 400 ng/mL CDTb). The white arrow marks a site of protrusion formation. With a septin cluster. The yellow arrow marks the microtubule tip during protrusion formation. (C) Caco-2 cells were transfected with SEPT6-tomato and EB3-GFP to label polymerizing microtubules. The images show 80 s timelapse sequence after CDT intoxication (200 ng/mL CDTa and 400 ng/mL CDTb) for 1.5 h. The white arrow marks an EB3 positive microtubule end. The yellow arrow marks a second microtubule following in the same track. EB3 behaves similar to EB1. (D) Representative blot of an EB1-GST pull-down of recombinant SEPT2 from Caco-2 cell lysates. As a control GST-loaded beads were used. The amount of loaded beads is visualized by Coomassie-staining of the SDS-Gel. (E) Representative blot of an EB1-GST pull-down of recombinant SEPT7 from Caco-2 cell lysates. As a control GST-loaded beads were used. The amount of loaded beads is visualized by Coomassie-staining of the SDS-Gel. (F) Plasmon resonance of SEPT2-EB1 interaction. (G) Plasmon resonance of SEPT6-EB1 interaction. (H) Plasmon resonance of SEPT7–EB1 interaction.
Fig. 5.
Microtubules are guided along septins. (A) Combined DIC and confocal images of Caco-2 cells. Cells were transfected with SEPT2-GFP and treated with CDT (200 ng/mL CDTa and 400 ng/mL CDTb) for 170 min (white arrow, site of protrusion formation with preexisting septin accumulation). (Scale bar, 5 µm.) (B) Caco-2 cells were transfected with SEPT6-tomato and EB3-GFP. The 55-s time-lapse sequence after CDT intoxication (as in A) for 1.5 h. Yellow arrowhead marks an EB3-positive microtubule plus-end, approaching a septin structure at the protrusion base. White arrowhead marks the same plus-end pausing at the base of protrusion. Cyan arrowhead shows redirection and fast entering into the protrusion. (C) Model for redirection of polymerizing microtubules into protrusions. Plus-ends of polymerizing microtubules contact a septin chevron-like structure and are redirected into the protrusion. (D) Representative blot of an EB1-GST pull-down of endogenous SEPT2 and SEPT7 from Caco-2 cell lysates. GST-loaded beads were used as a control. (E) Quantification of blots as in D for SEPT7. Blots were normalized to the amount of SEPT7 in the lysate. Data are ± SEM, n = 4. (F) Quantification of blots as in D for SEPT2. Blots were normalized to the amount of SEPT2 in the lysate. Data are ± SEM and n = 4. (G) Representative blot of a coimmunopreciptitation of SEPT2 along with EB1-GFP. HeLa cells were transfected with EB1-GFP for 24 h. SEPT2 and EB1-GFP from the lysates were coimmunoprecipitated with anti-GFP antibody conjugated to magnetic beads. GFP-transfected cells were used as control. (H) Quantification of blots as in G for SEPT2. Blots were normalized to the amount of EB1-GFP and GFP on beads. Data are ± SEM and n = 3.
Septins Interact with the Microtubule Plus-End.
Septins are known to bind microtubules (20). However, the structures involved are largely enigmatic. We asked whether the plus-end tracking protein-1 (EB1), which is a master regulator of protein interactions at the plus-ends of microtubules (21–25), plays a role in septin–microtubule communication. In fact, GST–pull-down experiments with EB1-loaded beads revealed a direct interaction of septins with EB1. Septins were precipitated as purified His-tagged proteins (Fig. S8 D and E), as endogenous septins from Caco-2 cell lysates (Fig. 5 D–F) or from EB1-GFP–transfected HeLa cells (Fig. 2 G and H). To quantify the interaction between EB1 and septin, we used surface plasmon resonance spectroscopy. These studies revealed an EB1–septin interaction affinity of a Kd of 80 ± 12 nM for SEPT2, 19 ± 11 nM for SEPT6, and 26 ± 4 nM for SEPT7 (Fig. S8 F–H). Thus, septins interact directly and with high affinity with EB1.
Discussion
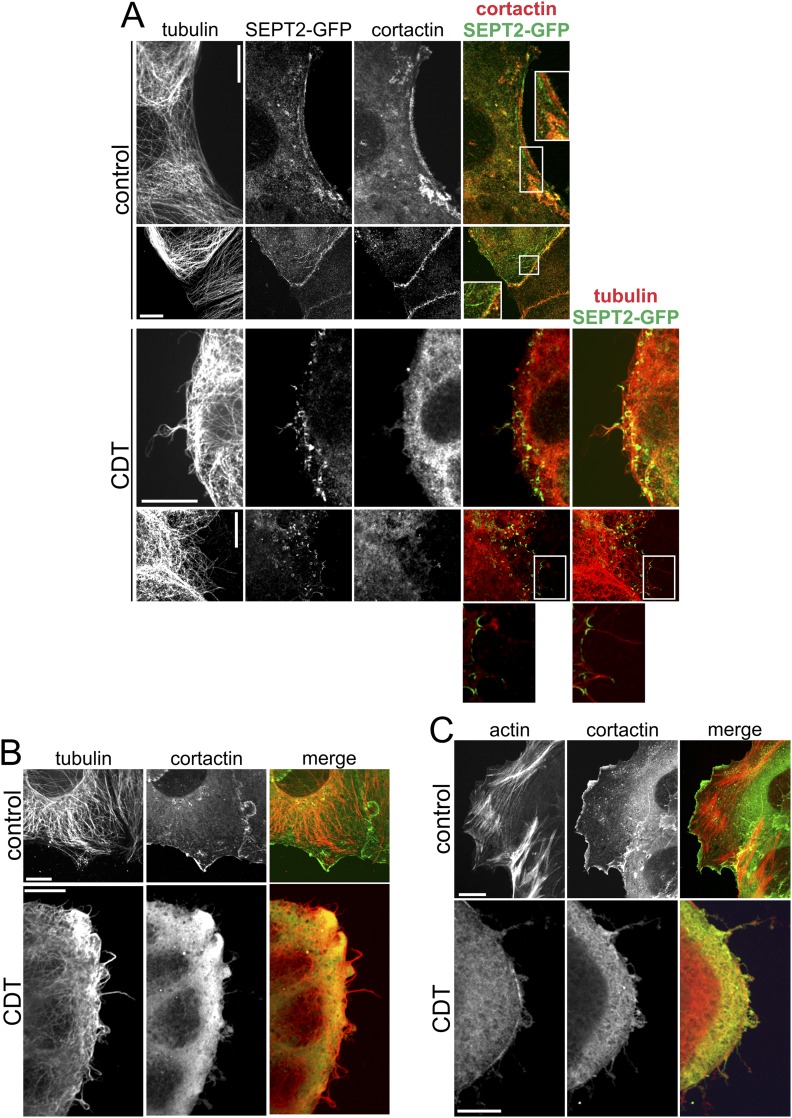
Here, we show that septins accumulate at the membrane after cells were intoxicated with the actin-ADP–ribosylating toxin CDT. Septins are well known to interact with anionic phospholipids (e.g., phosphatidylinositol 4,5-bisphosphate and phosphatidylinositol 3,4,5-trisphosphate) (26, 27). In our studies, the sites of septin accumulation are characterized by spots of depolymerized cortical actin, which may allow interaction with membrane phospholipids. During protrusion formation the septin accumulations matured to chevron-like or circular structures at the base of protrusions. Interestingly, a very similar angle-like structure of septins occurs at the base of developing neurite branches (28). However, in neurites, formation of actin filaments are crucial for collateral branching, which is followed by accumulation of microtubules. Although in neurites SEPT6 increases cortactin recruitment, which is essential to trigger formation of actin-based axonal filopodia (28), we did not detect any role of cortactin in CDT-induced protrusion formation (Fig. S9). In our study, CDT causes local depolymerization of actin, which is a prerequisite for septin-dependent, microtubule-based protrusion formation. In fact, several findings indicate that septins are essential for toxin-induced protrusion formation. While overexpression of septins increased protrusion formation, septin knockdown and treatment with FCF, an inhibitor of septin turnover (20), blocked formation of protrusions. Not only the number but also the length of protrusions was affected by CDT treatment, suggesting that septins are involved not only in initiation but also in growth, dynamics, and stabilization of microtubule-based protrusions. Accordingly, we also observed septins along the protrusion shaft. Although knockdown of SEPT6 and SEPT7 clearly inhibited protrusion formation, knockdown of SEPT2 had no effect, although it was part of the septin structure at the base of protrusions. We assume that functional redundancy of other septins (e.g., SEPT1 and SEPT5) from the SEPT2 group is responsible for protrusion formation after SEPT2 knockdown.
Fig. S9.
Formation of microtubule-based protrusions with septin base is independent of cortactin. (A) Caco-2 cells were transfected with SEPT2-GFP. Cells were treated with CDT (200 ng/mL CDTa and 400 ng/mL CDTb) for 90 min. Cells were stained by indirect immunofluorescence for cortactin and α-tubulin. After CDT-treatment cortactin loses its specific localization and is distributed all over the cytosol. Cortactin shows no specific colocalization with septin accumulations at the base of protrusions. (Scale bar, 10 µm.) (B) Caco-2 cells were stained by indirect immunofluorescence for cortactin and α-tubulin. Cells were treated as in A. Also in stainings of endogenous septins, cortactin shows no accumulation at the base of protrusions. (Scale bar, 10 µm.) (C) Caco-2 cells were stained by indirect immunofluorescence for cortactin and actin was stained by phalloidin-TRITC. Cells were treated as in A. The specific cortactin localization gets lost after CDT-treatment and is accompanied by the loss of actin filaments. (Scale bar, 10 µm.)
Studies from yeast and mammalian cells indicate that the small GTPase Cdc42 plays an essential role in septin regulation (21, 29). Accordingly, we observed locally increased activity of Cdc42 in FRET experiments before and during protrusion formation. However, persistent activation of Cdc42 was inhibitory. When dominant active Cdc42 or the Rho protein activator CNF1 was used, protrusion formation was strongly inhibited. These findings suggest that the free cycling of Cdc42 from the inactive to the active state is necessary to fulfill septin regulatory functions. CNF1 and also dominant active Cdc42 caused increased formation of septin rings in the cytosol, whereas the membrane localization of septins with chevron-like structures were decreased. This is in line with a role of cycling Cdc42 in septin membrane recruitment observed in yeast and mammalian cells (30, 31). Moreover, the persistently active form of Cdc42 may favor uncontrolled ring formation of septins that prevents a spatiotemporal controlled polymerization of septins at the site of protrusion formation.
Cdc42 effectors of the Borg family are suggested to play a pivotal role in septin recruitment and organization (21, 32). Five Borg family members (Borg1–5) are known (18). All Borgs bind directly to septins via their BD3 domain (21). We could colocalize Borg1–3 with septin filaments. After CDT treatment Borgs colocalized with the chevron-like structures at the base of protrusions. The regulation of Borgs by Cdc42 is not well understood. Although Borgs bind to active GTP-bound Cdc42 in vitro (18), it was shown that the active Cdc42 can displace Borg from septins. Thus, Borg–septin interaction appears to be negatively regulated by Cdc42 (21). Accordingly, we observed that Borgs were displaced from protrusions after CNF treatment of cells.
Bowen et al. reported that septins track microtubule bundles (33). Similarly, we observed tracking of polymerizing cytosolic microtubules along septins in control cells. In CDT-treated cells, where membrane-associated septin clusters had formed, microtubule tips interacted with the chevron-like structures of septins. Moreover, we observed that septins guided microtubules to form projections and forced new directions of microtubule growth. This was evident when microtubules contacted septins at distal parts of the chevron-like structures. The septin interaction redirected the tip of microtubules into the center of the septin “funnel,” where microtubules continued to grow beyond the edge of the cell to form protrusions.
We show that septins interact with microtubules via EB1, which is a multifunctional interaction partner at the microtubule tip (21–25). Pull-down experiments and surface plasmon resonance spectroscopy, exhibiting Kd values in the nanomolar range, revealed that septins bind directly to EB1. Previously, we showed that toxin-induced protrusions contain endoplasmic reticulum, which is connected to microtubules via stromal interaction molecule 1 (Stim-1) (9). Stim-1 is involved in Stim/Orai-dependent store-operated calcium entry, and septins are coordinators of Stim/Orai channels (34). It remains to be studied whether Stim-1 is another functional connection between microtubules and septins.
Taken together, here we show that the actin-ADP–ribosylating toxin CDT of C. difficile induces septin accumulations at the cell membrane, which are essential for the formation of toxin-induced microtubule-based protrusions. This effect is regulated by Cdc42 and most likely by Borg proteins. Septins guide growing microtubules and determine the site of protrusion formation at the cell membrane by interaction with EB1 at the tips of microtubules. Thus, the bacterial toxin exploits septin-dependent regulatory mechanism of microtubule organization to eventually form a network of cell protrusions and to increase the adherence of the pathogen during C. difficile infection.
Methods
For detailed methods, see SI Methods, Cell Culture and Transient Transfections; Preparation of Primary Colon Epithelial Cells; Expression and Purification of Proteins; shRNAs; Antibodies, Fluorescent Dyes, and Fluorescent Proteins; Immunostaining; Live-Cell Imaging; FRET Experiments; Pull-Down Assays and Coimmunoprecipitation; Surface Plasmon Resonance; ADP-Ribosylation Assays; and Statistics.
Immunostaining.
Cells were washed with PBS, fixed with 4% (wt/vol) formaldehyde in PBS, washed with PBS, permeabilized with 0.15% Triton X-100 in PBS, and blocked. Incubation with the primary antibody was overnight at 4 °C. Cells were washed and incubated with the suitable secondary antibody for 1 h. Cells were washed, dried, and embedded with Mowiol. Cells were analyzed with the microscope mentioned in SI Methods. Images were processed with Metamorph software.
Live-Cell Imaging.
For live-cell imaging, cells were incubated in a chamber with humidified atmosphere at 37 °C on the microscope (SI Methods, Immunostaining). Quantification of microtubule protrusion formation was performed according to ref. 8.
FRET Experiments.
Procedure for FRET measurements is given in the immunostaining section. At each time point, three images were recorded for CFP, FRET, and YFP. Donor (CFP) and FRET images were acquired sequentially with exposure times ≤300 ms. Processing of ratiometric images was performed with the Biosensor Processing Software 2.1 (Danuser laboratory: lccb.hms.harvard.edu/software.html). Subsequent image analysis was performed in MetaMorph. Ratio images were color-coded; warm and cold colors represent high and low biosensor activity, respectively.
Pull-Down Assays and Coimmunoprecipitation.
Cells were lysed in buffers supplemented with Complete protease inhibitor (Roche). For pull-down experiments, lysates were incubated with GST or GST-EB1 bound to glutathione Sepharose 4B (GE Healthcare) and subjected to Western blot analysis.
For pull-down of recombinant proteins, GST or GST-EB1 bound to glutathione Sepharose 4B was incubated with purified His-tagged proteins.
For coimmunoprecipitation, lysates were incubated with µMacs GFP isolation beads (Miltenyi Biotec). The beads were immobilized to µColumns and after elution, proteins were detected by immunoblot.
Mice were housed and handled in accordance with good animal practice as defined by FELASA (www.felasa.eu) and the national animal welfare body GV-SOLAS (www.gv-solas.de).
SI Methods
Cell Culture and Transient Transfections.
Caco-2 cells were cultured in DMEM supplemented with 10% FCS, 1% nonessential amino acids, and 1% sodium pyruvate (Biochrom). HeLa cells were cultured in DMEM supplemented with 10% FCS and 1% nonessential amino acids.
MDCK cells were cultured in MEM Eagle medium (PAN Biotech) supplemented with 10% FCS and 1% nonessential amino acids.
For immunostainings, cells were plated on HCl-washed coverslips or on cell culture inserts (Millipore or BD Falcon) for polarized cells. For live-cell imaging, cells were plated on glass-bottom dishes (Mattek). Subconfluent cells were cultured for 3–4 d, and polarized cells were cultured at least 1 wk at high density.
Cells were transfected using Lipofectamine 2000 (Invitrogen) according to the manufacturer’s protocol.
Preparation of Primary Colon Epithelial Cells.
The colon of a C57BL/6 mice was excised and transferred to ice-chilled PBS, containing 50 µg/mL penicillin/streptomycin (Biochrom). The colon was rinsed three times with the same buffer. Ions were chelated by 1 mM EDTA and 1 mM EGTA for 1 h at room temperature. To release the epithelial cells from the lamina propria, the tube was vigorously shaken every 10 min during this time. The piece of tissue was removed and the liberated epithelial cells were pelleted at 50 × g for 3 min. The cells were washed in growth DMEM (supplemented with 15% FCS, 1% Na-pyruvate, 1% nonessential amino acids, and 50 µg/mL penicillin/streptomycin). Subsequently, cells were plated on collagen-coated cell culture dishes. Experiments were performed after 24–36 h in vitro.
Expression and Purification of Proteins.
Recombinant CDTa and CDTb (from C. difficile strain 196) were produced as His-tagged proteins in the Bacillus megaterium expression system as it was described by others for the clostridial glycosylating toxins (35, 36). The binding component CDTb was used as protease-activated protein according to ref. 37.
GST and GST-EB1 were produced in Escherichia coli BL21 from the pGEX 4T vector. After induction with isopropyl β-d-1-thiogalactopyranoside (IPTG), bacteria were incubated for 4 h at 37 °C. Bacteria were lysed in 50 mM Tris⋅HCL (pH 7.5), 150 mM NaCl, 5 mM MgCl2, 10% glycerol, and 0.5% Triton ×100 by sonication, and the cleared lysates were incubated with glutathione Sepharose 4B (GE Healthcare) beads for 90 min at 4 °C. Beads were washed one time in lysis buffer and three times with 50 mM Tris⋅HCl (pH 7.5), 100 mM NaCl, 2 mM MgCl2, 10% glycerol, and 1% Nonidet P-40.
His-tagged Septins were produced in E. coli from the pET28a vector. After induction with IPTG, bacteria were incubated overnight at 21 °C. Proteins were bound to Ni2+-IDA-Protino-Resin (Macherey-Nagel). After washing, proteins were eluted by imidazole and subsequently dialyzed to a buffer without imidazole.
shRNAs.
The used shRNAs were cloned into the pSUPER.retro.gfp+neo vector (Oligoengine). The following already published target sequences were used: septin 2 CAGCCAACTCAGTTTATAA (38), septin 6 GAGAGACAAAGAGAAGAAA (39), septin 7 CTTGCAGCTGTGACTTATA (38), and control GATCTGATCGACACTGTAA.
Antibodies, Fluorescent Dyes, and Fluorescent Proteins.
Mouse monoclonal anti–α-tubulin, polyclonal rabbit anti-SEPT2, polyclonal rabbit anti-SEPT7, and polyclonal rabbit anti-SEPT9 were purchased from Sigma. Mouse anti-GAPDH was from Millipore. Mouse monoclonal anti-GST, rabbit polyclonal anti-SEPT7, rabbit polyclonal anti-SEPT6, mouse monoclonal anti-SEPT1, mouse monoclonal anti-SEPT5, rabbit polyclonal anti-occludin, rabbit polyclonal anti-cortactin, and mouse monoclonal anti-acetylated tubulin were from Santa Cruz. Rabbit polyclonal anti-GFP was from Cell Signaling Technology. Secondary Alexa568- and Alexa488-conjugated antibodies were from Invitrogen. Secondary CF405M-conjugated antibodies were from Biotrend. TRITC-labeled phalloidin was from Sigma and Atto565-labeled phalloidin from Hypermol.
Immunostaining.
Cells were washed with PBS, fixed for 10 min with 4% formaldehyde in PBS, washed with PBS, permeabilized (10 min) with 0.15% Triton X-100 in PBS, and blocked by 1% BSA and 0.05% Tween 20 in PBS for 30 min. Incubation with the primary antibody was overnight at 4 °C in blocking solution. Cells were washed with 0.05% Tween 20 in PBS and incubated with the suitable secondary antibody in blocking solution for 1 h. Cells were washed with 0.05% Tween 20 in PBS, dried, and embedded with Mowiol supplemented with DABCO (Sigma).
Polarized cells were fixed by addition of 8% PFA to the cell culture medium (final 4% PFA) to preserve apical protrusions.
Cells were analyzed with an Axiovert 200M microscope (Carl Zeiss), driven by Metamorph (Universal Imaging) or Visiview (Visitron) imaging software with plan-apochromat objectives, a Yokogawa CSU-X1 spinning disk confocal head with emission filter wheel, and a Coolsnap HQ II digital camera with 405-, 488-, and 561-nm laser lines. Images were processed with Metamorph software.
Live-Cell Imaging.
For live-cell imaging, cells were incubated in a chamber with humidified atmosphere (6.5% CO2 and 9% O2) at 37 °C on the microscope mentioned in the immunostaining section. For quantification of microtubule protrusion formation, the lengths of all processes were summated at a given time point and normalized by the respective section of the cell perimeter that was chosen for analysis according to ref. 8. Data are given as “normalized formation of protrusions.”
FRET Experiments.
FRET was measured with the microscope mentioned in Immunostaining. Excitation wavelength for each fluorescence was generated by a 200-W mercury short arc lamp. The excitation filters were mounted in a motorized LUDL filter wheel (Ludl Electronic Products). The following bandpass filters were used: CFP436/20 and YFP500/20(Chroma). The emission filters were also mounted in a motorized LUDL filter wheel. The following bandpass filters were used: CFP 480/40 and FRET (YFP) 535/25 (Chroma). At each time point, three images were recorded for CFP, FRET, and YFP at a binning of 2 × 2 or 4 × 4 with a PCO Edge 4.2 camera. Donor (CFP) and FRET images were acquired sequentially with exposure times ≤300 ms. Processing of ratiometric images was performed with the Biosensor Processing Software 2.1 (Danuser laboratory: lccb.hms.harvard.edu/software.html). Subsequent image analysis was performed in MetaMorph. Ratio images were color-coded, and warm and cold colors represent high and low biosensor activity, respectively. For quantification of ratio changes, the average grayscale in a 15- to 25-µm2 region at the site of protrusion formation of a 16-bit ratio image was devided by the lower scaling of the whole image. The resulting values were plotted against time. The RhoA2G sensor, which consists of the donor fluorophore monomeric teal fluorescent protein (mTFP1), the Rho-binding domain of rhotekin, the acceptor fluorophore Venus, and RhoA has been described (24). The analogous Cdc42 FRET sensor, consisting of the donor fluorophore mTFP1, the CRIB effector domain of WASP, the acceptor fluorophore Venus, and Cdc42, has been published recently (25).
Pull-Down Assays and Coimmunoprecipitation.
Cells were lysed in 50 mM Tris⋅HCl (pH 7.5), 100 mM NaCl, 2 mM MgCl2, 10% glycerol, and 1% Nonidet P-40, or cells were lysed with 50 mM Tris⋅HCl (pH 7.5), 150 mM NaCl, 1% Nonidet P-40, and 0.5% sodium deoxycholate for pull-down or coimmunoprecipitation experiments, respectively. Buffers were supplemented with Complete protease inhibitor (Roche). Lysis was increased by passing the cells through a syringe with a 26-G needle. Lysates were cleared by centrifugation at 17,000 × g. For pull-down experiments, lysates were incubated with GST or GST-EB1 bound to glutathione Sepharose 4B (GE Healthcare) for 1.5 h or overnight at 4 °C. Beads were washed three times with lysis buffer and subjected to Western blot analysis.
For pull-down of recombinant proteins, GST or GST-EB1 bound to glutathione Sepharose 4B was incubated with purified His-tagged proteins for 1.5 h at 4 °C in 50 mM Tris⋅HCl (pH 7.5), 100 mM NaCl, 2 mM MgCl2, 10% glycerol and 1% Nonidet P-40. Washing and elution were similar to pull-down of endogenous proteins.
For coimmunoprecipitation, lysates were incubated with µMacs GFP isolation beads (Miltenyi Biotec) overnight at 4 °C. The beads were immobilized to µColumns and washed three times with lysis buffer. After elution, proteins were detected by immuno blot.
Surface Plasmon Resonance.
For surface plasmon resonance a Biacore × 100 (GE Healthcare) was used. The 6xHis-tagged septins were coupled to a NTA chip (200 nM septins in 10 mM Hepes, 150 mM NaCl, and 0.01% Tween-20 at pH 7.4) for 120 s at 5 µL/min. Increasing concentrations of EB1-GST or GST were injected per cycle for 60 s at 30 µL/min, and dissociation was allowed for 120 s. The chip surface was regenerated at the beginning of each binding cycle by sequential flux two times in 6M guanidinium chloride in H2O and once in 10 mM Hepes, 150 mM NaCl, and 0.01% Tween-20 at pH 7.4 for 120 s at 20 µL/min each. Kinetic constants were calculated by using the Biacore ×100 Evaluation Software (version 2.0).
ADP-Ribosylation Assays.
For “differential” ADP ribosylation Caco-2 cells were treated with CDT [CDTa (200 ng/mL) and CDTb (400 ng/mL)]. Additionally, cells were pretreated with 100 µM FCF. Afterward, cells were lysed. All steps were done on ice. Thirty micrograms of lysate protein were incubated for 30 min at 37 °C in the presence of [32P]NAD and C2I toxin (enzymatic component) from C. botulinum to ADP-ribosylate so far nonmodified actin with [32P]NAD. Proteins were subjected to SDS/PAGE, and radiolabeled actin was visualized by phosphorimaging.
Statistics.
Student’s t test was applied when two groups with normal distribution had to be compared. The Mann–Whitney U test was used for data without normal distribution. Statistics evaluation was performed with the Sigma Stat software (Jandel Scientific). P values <0.05 were considered statistically significant and marked with an asterisk (*P < 0.05; **P < 0.01; ***P < 0.005).
Acknowledgments
This work was supported by Deutsche Forschungsgemeinschaft Grant CRC/SFB 1140 (to C.S. and K.A.). This study was supported in part by the excellence initiative of the German Research Foundation (GSC-4, Spemann Graduate School).
Footnotes
The authors declare no conflict of interest.
This article is a PNAS Direct Submission.
This article contains supporting information online at www.pnas.org/lookup/suppl/doi:10.1073/pnas.1522717113/-/DCSupplemental.
References
- 1.Kelly CP, LaMont JT. Clostridium difficile: More difficult than ever. N Engl J Med. 2008;359(18):1932–1940. doi: 10.1056/NEJMra0707500. [DOI] [PubMed] [Google Scholar]
- 2.McDonald LC, et al. An epidemic, toxin gene-variant strain of Clostridium difficile. N Engl J Med. 2005;353(23):2433–2441. doi: 10.1056/NEJMoa051590. [DOI] [PubMed] [Google Scholar]
- 3.Voth DE, Ballard JD. Clostridium difficile toxins: Mechanism of action and role in disease. Clin Microbiol Rev. 2005;18(2):247–263. doi: 10.1128/CMR.18.2.247-263.2005. [DOI] [PMC free article] [PubMed] [Google Scholar]
- 4.Gerding DN, Johnson S, Rupnik M, Aktories K. Clostridium difficile binary toxin CDT: Mechanism, epidemiology, and potential clinical importance. Gut Microbes. 2014;5(1):15–27. doi: 10.4161/gmic.26854. [DOI] [PMC free article] [PubMed] [Google Scholar]
- 5.Gülke I, et al. Characterization of the enzymatic component of the ADP-ribosyltransferase toxin CDTa from Clostridium difficile. Infect Immun. 2001;69(10):6004–6011. doi: 10.1128/IAI.69.10.6004-6011.2001. [DOI] [PMC free article] [PubMed] [Google Scholar]
- 6.Aktories K, Lang AE, Schwan C, Mannherz HG. Actin as target for modification by bacterial protein toxins. FEBS J. 2011;278(23):4526–4543. doi: 10.1111/j.1742-4658.2011.08113.x. [DOI] [PubMed] [Google Scholar]
- 7.Perelle S, Gibert M, Bourlioux P, Corthier G, Popoff MR. Production of a complete binary toxin (actin-specific ADP-ribosyltransferase) by Clostridium difficile CD196. Infect Immun. 1997;65(4):1402–1407. doi: 10.1128/iai.65.4.1402-1407.1997. [DOI] [PMC free article] [PubMed] [Google Scholar]
- 8.Schwan C, et al. Clostridium difficile toxin CDT induces formation of microtubule-based protrusions and increases adherence of bacteria. PLoS Pathog. 2009;5(10):e1000626. doi: 10.1371/journal.ppat.1000626. [DOI] [PMC free article] [PubMed] [Google Scholar]
- 9.Schwan C, et al. Clostridium difficile toxin CDT hijacks microtubule organization and reroutes vesicle traffic to increase pathogen adherence. Proc Natl Acad Sci USA. 2014;111(6):2313–2318. doi: 10.1073/pnas.1311589111. [DOI] [PMC free article] [PubMed] [Google Scholar]
- 10.Schwan C, et al. Cholesterol- and sphingolipid-rich microdomains are essential for microtubule-based membrane protrusions induced by Clostridium difficile transferase (CDT) J Biol Chem. 2011;286(33):29356–29365. doi: 10.1074/jbc.M111.261925. [DOI] [PMC free article] [PubMed] [Google Scholar]
- 11.Estey MP, Kim MS, Trimble WS. Septins. Curr Biol. 2011;21(10):R384–R387. doi: 10.1016/j.cub.2011.03.067. [DOI] [PubMed] [Google Scholar]
- 12.Beise N, Trimble W. Septins at a glance. J Cell Sci. 2011;124(Pt 24):4141–4146. doi: 10.1242/jcs.087007. [DOI] [PubMed] [Google Scholar]
- 13.Silverman-Gavrila RV, Silverman-Gavrila LB. Septins: New microtubule interacting partners. ScientificWorldJournal. 2008;8:611–620. doi: 10.1100/tsw.2008.87. [DOI] [PMC free article] [PubMed] [Google Scholar]
- 14.Dolat L, Hu Q, Spiliotis ET. Septin functions in organ system physiology and pathology. Biol Chem. 2014;395(2):123–141. doi: 10.1515/hsz-2013-0233. [DOI] [PMC free article] [PubMed] [Google Scholar]
- 15.Mostowy S, Cossart P. Septins: The fourth component of the cytoskeleton. Nat Rev Mol Cell Biol. 2012;13(3):183–194. doi: 10.1038/nrm3284. [DOI] [PubMed] [Google Scholar]
- 16.Hu Q, et al. A septin diffusion barrier at the base of the primary cilium maintains ciliary membrane protein distribution. Science. 2010;329(5990):436–439. doi: 10.1126/science.1191054. [DOI] [PMC free article] [PubMed] [Google Scholar]
- 17.Tokhtaeva E, et al. Septin dynamics are essential for exocytosis. J Biol Chem. 2015;290(9):5280–5297. doi: 10.1074/jbc.M114.616201. [DOI] [PMC free article] [PubMed] [Google Scholar]
- 18.Joberty G, Perlungher RR, Macara IG. The Borgs, a new family of Cdc42 and TC10 GTPase-interacting proteins. Mol Cell Biol. 1999;19(10):6585–6597. doi: 10.1128/mcb.19.10.6585. [DOI] [PMC free article] [PubMed] [Google Scholar]
- 19.Morton WM, Ayscough KR, McLaughlin PJ. Latrunculin alters the actin-monomer subunit interface to prevent polymerization. Nat Cell Biol. 2000;2(6):376–378. doi: 10.1038/35014075. [DOI] [PubMed] [Google Scholar]
- 20.Hu Q, Nelson WJ, Spiliotis ET. Forchlorfenuron alters mammalian septin assembly, organization, and dynamics. J Biol Chem. 2008;283(43):29563–29571. doi: 10.1074/jbc.M804962200. [DOI] [PMC free article] [PubMed] [Google Scholar]
- 21.Joberty G, et al. Borg proteins control septin organization and are negatively regulated by Cdc42. Nat Cell Biol. 2001;3(10):861–866. doi: 10.1038/ncb1001-861. [DOI] [PubMed] [Google Scholar]
- 22.Flatau G, et al. Toxin-induced activation of the G protein p21 Rho by deamidation of glutamine. Nature. 1997;387(6634):729–733. doi: 10.1038/42743. [DOI] [PubMed] [Google Scholar]
- 23.Schmidt G, et al. Gln 63 of Rho is deamidated by Escherichia coli cytotoxic necrotizing factor-1. Nature. 1997;387(6634):725–729. doi: 10.1038/42735. [DOI] [PubMed] [Google Scholar]
- 24.Fritz RD, et al. A versatile toolkit to produce sensitive FRET biosensors to visualize signaling in time and space. Sci Signal. 2013;6(285):rs12. doi: 10.1126/scisignal.2004135. [DOI] [PubMed] [Google Scholar]
- 25.Martin K, et al. Spatio-temporal co-ordination of RhoA, Rac1 and Cdc42 activation during prototypical edge protrusion and retraction dynamics. Sci Rep. 2016;6:21901. doi: 10.1038/srep21901. [DOI] [PMC free article] [PubMed] [Google Scholar]
- 26.Zhang J, et al. Phosphatidylinositol polyphosphate binding to the mammalian septin H5 is modulated by GTP. Curr Biol. 1999;9(24):1458–1467. doi: 10.1016/s0960-9822(00)80115-3. [DOI] [PubMed] [Google Scholar]
- 27.Bridges AA, Gladfelter AS. Septin form and function at the cell cortex. J Biol Chem. 2015;290(28):17173–17180. doi: 10.1074/jbc.R114.634444. [DOI] [PMC free article] [PubMed] [Google Scholar]
- 28.Hu J, et al. Septin-driven coordination of actin and microtubule remodeling regulates the collateral branching of axons. Curr Biol. 2012;22(12):1109–1115. doi: 10.1016/j.cub.2012.04.019. [DOI] [PMC free article] [PubMed] [Google Scholar]
- 29.Sadian Y, et al. The role of Cdc42 and Gic1 in the regulation of septin filament formation and dissociation. eLife. 2013;2:e01085. doi: 10.7554/eLife.01085. [DOI] [PMC free article] [PubMed] [Google Scholar]
- 30.Gladfelter AS, Bose I, Zyla TR, Bardes ES, Lew DJ. Septin ring assembly involves cycles of GTP loading and hydrolysis by Cdc42p. J Cell Biol. 2002;156(2):315–326. doi: 10.1083/jcb.200109062. [DOI] [PMC free article] [PubMed] [Google Scholar]
- 31.Caviston JP, Longtine M, Pringle JR, Bi E. The role of Cdc42p GTPase-activating proteins in assembly of the septin ring in yeast. Mol Biol Cell. 2003;14(10):4051–4066. doi: 10.1091/mbc.E03-04-0247. [DOI] [PMC free article] [PubMed] [Google Scholar]
- 32.Sheffield PJ, et al. Borg/septin interactions and the assembly of mammalian septin heterodimers, trimers, and filaments. J Biol Chem. 2003;278(5):3483–3488. doi: 10.1074/jbc.M209701200. [DOI] [PubMed] [Google Scholar]
- 33.Bowen JR, Hwang D, Bai X, Roy D, Spiliotis ET. Septin GTPases spatially guide microtubule organization and plus end dynamics in polarizing epithelia. J Cell Biol. 2011;194(2):187–197. doi: 10.1083/jcb.201102076. [DOI] [PMC free article] [PubMed] [Google Scholar]
- 34.Sharma S, et al. An siRNA screen for NFAT activation identifies septins as coordinators of store-operated Ca2+ entry. Nature. 2013;499(7457):238–242. doi: 10.1038/nature12229. [DOI] [PMC free article] [PubMed] [Google Scholar]
- 35.Papatheodorou P, Zamboglou C, Genisyuerek S, Guttenberg G, Aktories K. Clostridial glucosylating toxins enter cells via clathrin-mediated endocytosis. PLoS One. 2010;5(5):e10673. doi: 10.1371/journal.pone.0010673. [DOI] [PMC free article] [PubMed] [Google Scholar]
- 36.Yang G, et al. Expression of recombinant Clostridium difficile toxin A and B in Bacillus megaterium. BMC Microbiol. 2008;8(192):192. doi: 10.1186/1471-2180-8-192. [DOI] [PMC free article] [PubMed] [Google Scholar]
- 37.Barth H, et al. Cellular uptake of Clostridium botulinum C2 toxin requires oligomerization and acidification. J Biol Chem. 2000;275(25):18704–18711. doi: 10.1074/jbc.M000596200. [DOI] [PubMed] [Google Scholar]
- 38.Sellin ME, Sandblad L, Stenmark S, Gullberg M. Deciphering the rules governing assembly order of mammalian septin complexes. Mol Biol Cell. 2011;22(17):3152–3164. doi: 10.1091/mbc.E11-03-0253. [DOI] [PMC free article] [PubMed] [Google Scholar]
- 39.Sellin ME, Holmfeldt P, Stenmark S, Gullberg M. Microtubules support a disk-like septin arrangement at the plasma membrane of mammalian cells. Mol Biol Cell. 2011;22(23):4588–4601. doi: 10.1091/mbc.E11-09-0754. [DOI] [PMC free article] [PubMed] [Google Scholar]


