Abstract
X-ray luminescence computed tomography (XLCT) is an emerging hybrid imaging modality, which is able to improve the spatial resolution of optical imaging to hundreds of micrometers for deep targets by using superfine X-ray pencil beams. However, due to the low X-ray photon utilization efficiency in a single pinhole collimator based XLCT, it takes a long time to acquire measurement data. Herein, we propose a multiple pinhole collimator based XLCT, in which multiple X-ray beams are generated to scan a sample at multiple positions simultaneously. Compared with the single pinhole based XLCT, the multiple X-ray beam scanning method requires much less measurement time. Numerical simulations and phantom experiments have been performed to demonstrate the feasibility of the multiple X-ray beam scanning method. In one numerical simulation, we used four X-ray beams to scan a cylindrical object with 6 deeply embedded targets. With measurements from 6 angular projections, all 6 targets have been reconstructed successfully. In the phantom experiment, we generated two X-ray pencil beams with a collimator manufactured in-house. Two capillary targets with 0.6 mm edge-to-edge distance embedded in a cylindrical phantom have been reconstructed successfully. With the two beam scanning, we reduced the data acquisition time by 50%. From the reconstructed XLCT images, we found that the Dice similarity of targets is 85.11% and the distance error between two targets is less than 3%. We have measured the radiation dose during XLCT scan and found that the radiation dose, 1.475 mSv, is in the range of a typical CT scan. We have measured the changes of the collimated X-ray beam size and intensity at different distances from the collimator. We have also studied the effects of beam size and intensity in the reconstruction of XLCT.
OCIS codes: (170.3890) Medical optics instrumentation, (170.6960) Tomography, (170.7050) Turbid media, (170.7440) X-ray imaging
1. Introduction
X-ray luminescence computed tomography (XLCT) is an emerging hybrid imaging modality. In principle, it uses X-ray beams to excite deeply embedded phosphor particles (such as Eu3+-doped gadolinium oxysulfide — GOS:Eu3+) emitting visible or near-infrared (NIR) photons that can be measured by sensitive detectors [1]. As a potential tool for small animal imaging, compared with other imaging modalities, such as bioluminescence tomography (BLT) [2], positron emission tomography (PET) [3] and fluorescence molecular tomography (FMT) [4], XLCT takes advantage of the high spatial resolution of X-ray imaging and the high measurement sensitivity of optical imaging for deeply embedded targets [5].
Due to the unique features of XLCT, it has attracted lots of attention. Several types of XLCT imaging systems have been designed and studied. Based on numerical simulations, Pratx et al. demonstrated the feasibility of narrow beam selective excitation XLCT [1]. And they reported for the first time that XLCT could image the distribution of phosphor particles by using a simple narrow X-ray beam experimental setup [6]. We previously reported a collimated pencil beam based XLCT system and experimentally proved that XLCT is feasible for sensing deep targets with good spatial resolution [5]. However, in the selective excitation scheme of narrow/pencil beam XLCT, the beam scans the object sequentially, which leads to a long data acquisition time. Chen et al. designed a cone beam XLCT imaging system to improve scanning speed but with compromised spatial resolution [7]. Liu et al. applied a cone beam based XLCT to small animal imaging with the XLCT reconstruction from measurements at a single-view and they reported a location error of 1.43 mm [8]. To improve spatial resolution, Cong et al. proposed a micro-modulated X-ray scanning method utilizing focused X-ray beams onto a spot of a few micrometers in size [9,10]. And we designed a microscopic XLCT (microXLCT) system by using a superfine single pinhole collimator, in which X-ray beams from the X-ray source were collimated by a small pinhole with a diameter of 100 µm [11].
In the traditional narrow/pencil X-ray beam XLCT design, the long data acquisition time is a concern because only one X-ray beam is collimated to sequentially scan an object (single-beam scanning strategy). One can reduce the data acquisition time by using higher dose X-ray beam (larger tube current and X-ray photon energy for shorter exposure time). However, the increased X-ray dose is not desired. The data acquisition time can also be reduced by increasing the diameter of the collimated X-ray beams but with compromised spatial resolution. Hence, to further reduce the data acquisition time, in this paper, we propose a multiple pinhole collimator based XLCT system, in which multiple X-ray beams scan the object simultaneously.
In this paper, the XLCT imaging system, the scanning scheme of multiple-beam XLCT, the forward modeling, the reconstruction algorithm of XLCT, the setup of numerical simulations and phantom experiment, and the approaches to measure the X-ray beam size and the X-ray dose are described in Section 2. In Section 3, we report the results of the measured X-ray beam size and intensity, numerical simulation, phantom experiment, and measured X-ray dose. In Section 4, we discuss the multiple-beam scanning strategy and the dose measurements, and conclude the paper.
2. Method
2.1 XLCT imaging system
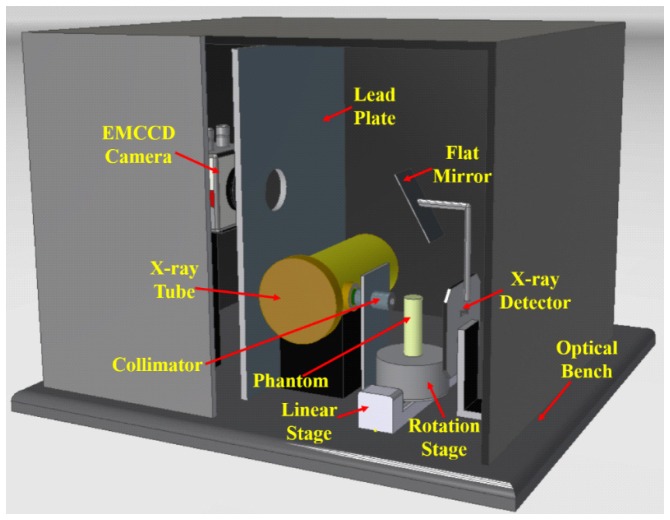
We built a multiple pinhole collimator based XLCT imaging system. The 3D design of the system is shown in Fig. 1. The X-ray tube (93212, Oxford Instruments) generated X-ray photons up to a maximum energy of 50 kVp and a tube current of 2 mA. The output X-ray beams were firstly collimated by a 31 mm long, 2.54 cm diameter steel rod with a central 8 mm diameter hole, and then collimated by a collimator with two 500 µm diameter pinholes. The phantom was 3 mm away from the collimator and placed on a motorized rotary stage (B4872TS-ZR, Velmex, Inc.) mounted on a motorized linear stage (MB2509Q1J-S3, Velmex, Inc.). The passed X-ray beams were sensed by an X-ray detector (Shad-o-Box 1024, GOS scintillator screen, Rad-Icon Imaging Corporation), which has a detection area of 49.2 × 49.2 mm2 consisting of a 1024 × 1024 pixel photodiode array sensor with a 48 µm pixel size. The distance from X-ray tube to the detector was 150 mm. The emitted optical photons from the phantom top surface were reflected by a flat mirror and detected by a water-cooling electron multiplying charge coupled device (EMCCD) camera (C9100-13, Hamamatsu) with a focus lens (f/1.4, Carl Zeiss). A 0.5 cm thick lead plate with a circular aperture was placed between the EMCCD camera and the X-ray tube to avoid the influence of high energy X-ray scattering photons. The whole system was fixed on an optical bench and placed inside an X-ray shielding and light tight cabinet. All the devices during the measurement process were controlled by a program written in C++ language in the Visual Studio development environment.
Fig. 1.
3D design of the multiple pinhole collimator based XLCT imaging system.
2.2 Scanning scheme in multiple-beam XLCT
In both scanning schemes of a single narrow and a single pencil beam XLCT, the object is scanned by a sequence of single X-ray beams moving at predefined directions and positions, which is similar to the first generation computed tomography (CT) scanning mode, so that it usually takes a long time to acquire data. For each angular projection, the linear scan step size is usually set to be same as the collimated X-ray beam diameter, which is also a critical factor in improving the spatial resolution of XLCT. Although a powerful X-ray source can be used to reduce the camera exposure time for each linear scanning, the X-ray dose will be increased, which, as mentioned before, is not desired. To reduce the data acquisition time, we propose a multiple-beam scanning strategy using multiple pinhole collimators.
As shown in Fig. 2, in the single-beam scanning strategy, for each angular projection, the number of linear scanning steps () is determined by the diameter of entire scanning region () and the beam diameter (), . Accordingly, in the multiple-beam scanning strategy, parallel X-ray beams are distributed evenly and scan the object at multiple positions simultaneously. For each projection, the number of linear scanning steps is calculated by the width of the interval region between each X-ray beam () and , so , in which is the number of parallel beams. The scanning region for each beam is reduced by using multi-beam scanning method, which means that we can speed up the data acquisition by times.
Fig. 2.
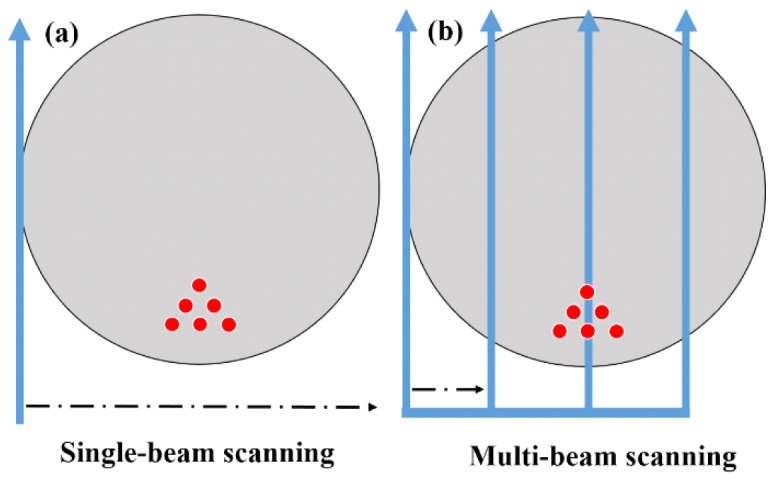
Schematic of linear scan setup for one typical angular projection: (a) Scan with a single X-ray beam; (b) Scan with multiple X-ray beams. The red dots indicate the targets. The blue arrows indicate the X-ray beams.
2.3 Forward modeling and reconstruction algorithm of XLCT
In XLCT, we use high energy X-ray photons to excite nanoparticles which emit optical photons to be measured for XLCT reconstruction. Thus we need to model the propagation of both the low energy optical photons and the high energy X-ray photons inside tissues. The propagation of the optical photons in turbid media such as tissues can be modeled by the diffusion equation in the continuous wave (CW) domain as in [12]:
| (1) |
where is the wavelength-dependent absorption coefficient at the position vector , is the wavelength-dependent diffusion coefficient, is the reduced scattering coefficient and is the emitted optical photon fluence. In Eq. (1), is the gradient operator, is the media domain, is the normal vector on the boundary, while, is the Robin boundary coefficient.
is the source term which stands for the k-th X-ray beam illumination pattern and can be written as:
| (2) |
where is the light yield of the phosphor particles, is the X-ray intensity distribution and is the particle concentration to be reconstructed.
In XLCT, while an X-ray beam scans the object along a straight line, the X-ray beam intensity distribution along the scanning line follows the Beer-Lambert law in a uniform X-ray attenuation medium, and can be expressed as:
| (3) |
where is the initial X-ray beam intensity, is the X-ray attenuation coefficient at the position vector , is the distance from X-ray beam start position to current position .
Based on the finite element method (FEM), the forward model of the XLCT can be written in a matrix formation as [12]:
| (4) |
where is the measurement, is the number of detector nodes, I is the total number of angular projections, J is the number of linear scan for each angular projection, and m is the finite element mesh node number. is the system matrix that can be calculated as:
| (5) |
in which is the element product of row vector , , where i is from 1 to and j is from 1 to . is the sensitivity matrix where each row vector is solved by Eq. (1) when setting the detector node i to be 1. is the excitation vectors from X-ray beam illumination patterns. In XLCT, the excitation regions have known locations (along the X-ray beam) and can be described as:
| (6) |
The XLCT reconstruction algorithm is similar to the algorithm used in FMT [13]. The solution of Eq. (3) can be obtained by minimizing the following regularized squared measurement misfit under the non-negativity constraint:
| (7) |
where is the regularization parameter and is the norm term. In this paper, the majorization-minimization (MM) algorithm is applied to minimize the regularized mismatch between measured and modeled photon intensity and update the XLCT images. The details of the MM algorithm have been described elsewhere [14,15].
2.4 Pinhole design and measurement of the collimated X-ray beam size and intensity
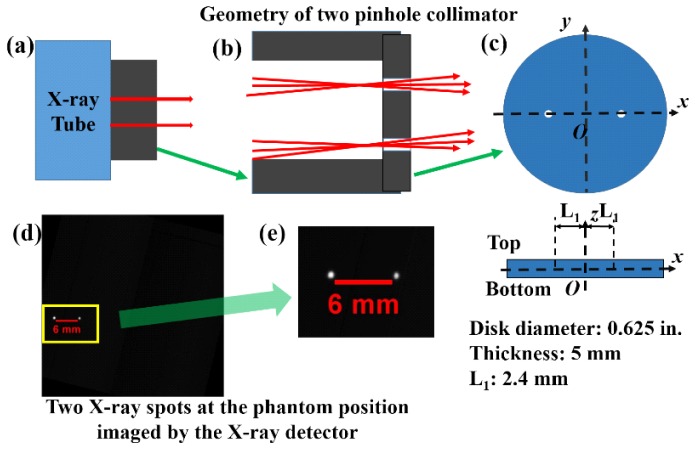
In the following experimental study with multiple X-ray beams, we designed a two pinhole collimator as shown in Fig. 3. The collimator was made from a 5 mm thick steel disk as shown in Fig. 3(c). Two small pinholes were drilled through the disk. Each pinhole has a diameter of 0.5 mm. The distance from disk center to pinhole center is 2.4 mm (L1 in Fig. 3(c)). To validate our design, we placed the X-ray detector at the phantom position to measure the collimated X-ray beam size. As shown in Figs. 3(d) and 3(e), the collimated X-ray beam’s spot size was measured to be 0.5 mm with a center-to-center distance of 6 mm. The beam size and intensity at different distances from the pinhole were measured as described in the following paragraph.
Fig. 3.
Pinhole design for the experimental study: (a) X-ray tube with a designed collimator; (b) Zoomed in picture of the pinhole design where red lines indicate X-ray beams; (c) The schematic draw of the disk mounted at the end of the cylindrical steel rod; (d) An X-ray image of the two collimated X-ray beams; (e) The zoomed in image of the collimated X-ray beams.
Before XLCT imaging experiment, we mounted the X-ray detector on a linear stage to measure the collimated X-ray beam size and intensity at different distances from the pinhole, as shown in Fig. 4. The X-ray tube current was set to be 0.2 mA at a tube voltage of 15.3 kVp to avoid the X-ray detector saturation. The step size of the linear stage was 5 mm with 13 steps. We took one X-ray picture with exposure time of 370 ms for one linear step. From the acquired images, we calculated the center coordinates and the equivalent diameter of the collimated X-ray beams.
Fig. 4.
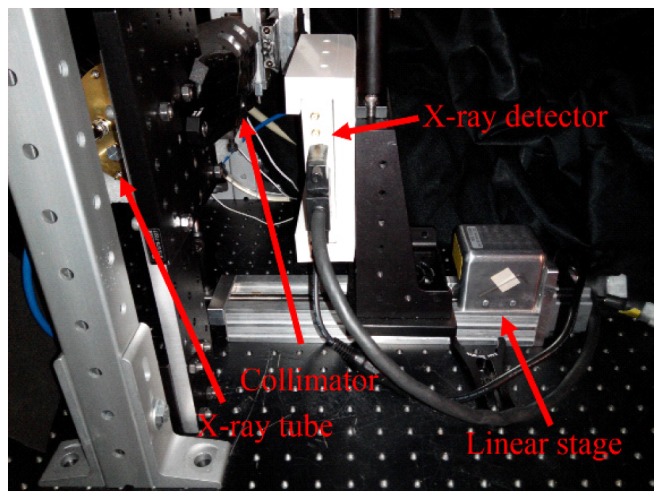
A photo of the experimental setup for measuring the X-ray beam size and intensity along the X-ray beam at different distances from the collimator.
2.5 Numerical simulations of multiple-beam XLCT
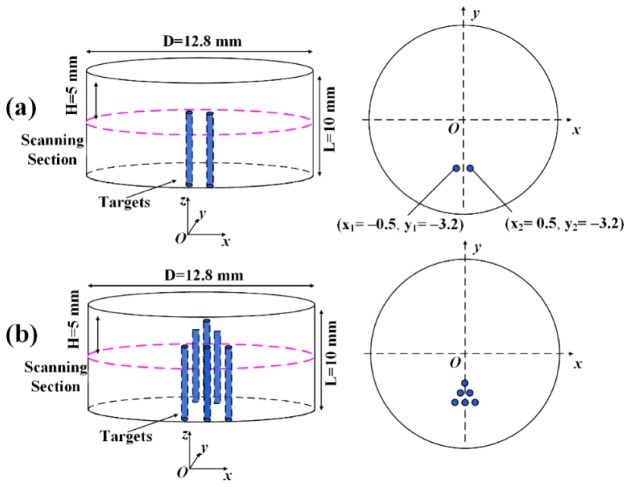
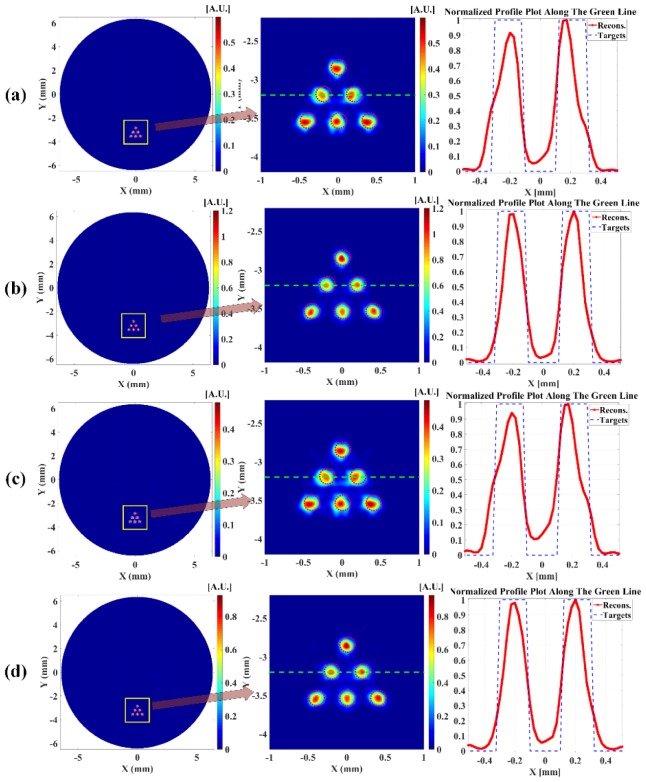
To validate the proposed multiple-beam scanning strategy in XLCT, we have performed two numerical simulations, a two target case and a six target case. For all simulation studies, we used a 10 mm long cylindrical phantom with a diameter of 12.8 mm. The optical properties of the phantom were set to be and at the wavelength of 703 nm, which is the wavelength peak in the emission spectrum of GOS:Eu3+. The X-ray attenuation coefficient was set to be [16]. There were no phosphor particles in the background phantom. For the two target case, we had two cylindrical targets with a diameter of 0.5 mm and a height of 6 mm embedded inside the phantom with center positions coordinates of (−0.5 mm, −3.2 mm) and (0.5 mm, −3.2 mm), as shown in Fig. 5(a). For the six target case, multiple targets with a diameter of 0.2 mm and a height of 6 mm were embedded in the phantom. The positions of the six targets are shown in Fig. 5(b), from which we see that the target center-to-center distance was 0.4 mm. For both numerical simulation studies, we set the phosphor particle concentration to be 1.0 mg/mL in targets and 0 in the background.
Fig. 5.
The phantom geometry for numerical simulations with two targets (a) and six targets (b).
For both simulation cases, we used four X-ray beams to scan the phantom at a depth of 5 mm under the phantom top surface. The X-ray beam diameter and the linear scan step size were set to be 0.1 mm. The interval was 3.2 mm so that 32 linear steps will be sufficient to scan the whole section of the phantom. For both numerical simulations, we used 6 angular projections with the angular step size of 30 degrees. For each angular projection, there were 32 linear scan steps. The numerical measurements were generated from the forward modeling in which the phantom was discretized by a finite element mesh with 26,638 nodes, 153,053 tetrahedral elements and 11,456 face elements. Finally, 50% Gaussian noise was added to the numerical measurements.
In XLCT, the propagation of collimated X-ray beams is usually treated as parallel straight lines. Recently, Chen et al. incorporated the real shape of the collimated narrow X-ray beams in the model and collected the measurement data from two perpendicular directions to speed up the scanning time [17]. In this paper, we have also taken the real beam shape into consideration. As described in the above section, we measured the collimated X-ray beam size and intensity and found that the collimated pencil X-ray beams were conical. The beam diameter changes linearly as the distance from the collimator increases and the beam intensity attenuates exponentially as described in Eq. (3). At the collimator position, we set the X-ray beam diameter and the slope was set to be , the beam diameter at position can be expressed:
| (8) |
where is the distance from the collimator to the position . Therefore, the range of beam diameter is .
In simulations, the original X-ray intensity was assumed to be and the X-ray attenuation coefficient was . Then the X-ray intensity along the collimated X-ray beam at position can be expressed as:
| (9) |
For the both simulation cases, we have included conical X-ray beam in the forward modeling. To evaluate the effects of beam size divergence in the XLCT reconstruction, we then compared the quality metrics in the reconstructed XLCT images using the conical beams with those obtained by using the parallel beams. With the parallel X-ray beam, the beam diameter does not change with distance.
For both simulation cases, we compared image quality metrics between traditional single-beam scanning method and the proposed multiple-beam scanning method. In the single-beam scanning method, the only difference was that there were 128 linear scan steps for each angular projection.
To investigate how the X-ray beam number affects the XLCT imaging quality, we have repeated the two cases of numerical simulation using 8 and 16 evenly distributed, parallel X-ray beams, respectively. We used numerical measurements at 6 angular projections for both cases. The linear scan step size is 0.1 mm for both cases with a linear scan step number of 16 for the 8 beams case and 8 for the 16 beams case.
2.6 Phantom experiment of multiple-beam XLCT
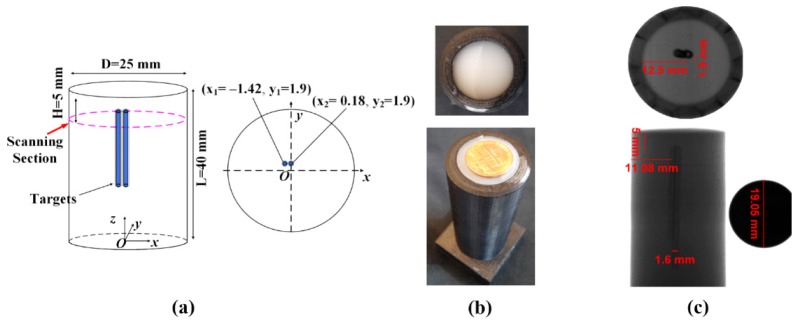
To validate our multiple-beam XLCT imaging system, we performed a phantom experiment with two capillary tube targets. The geometry of the experimental phantom with two targets is shown in Fig. 6(a). The cylindrical phantom (40 mm long, 25 mm in diameter) was made of 1% Intralipid and 2% Agar to mimic the optical properties of a small animal. The target was composed of 1% Intralipid, 2% Agar and GOS:Eu3+ particles at the concentration of 10 mg/ml, and filled in two plastic capillary tubes. The capillary tubes had an inner diameter of 1.0 mm and an outer diameter of 1.6 mm. The scanning section was 5 mm under the top surface. According to the X-ray projection pictures shown in Fig. 6(c), the capillary tubes were placed side by side and the target center-to-center distance was 1.6 mm.
Fig. 6.
(a) Geometry of the phantom used in experimental study; (b) The white light photos of the physical phantom (white) inside its plastic mold (black) with a penny (golden) as reference; (c) The X-ray projection pictures of the phantom inside its plastic mold from top and side views, and the reference penny (the rightmost picture).
For all XLCT measurements, the EMCCD camera was operated at with the maximum electron multiplying gain (EMgain) of 255 and the maximum analog gain of 5. The X-ray tube current was 1.2 mA at a tube voltage of 30 kVp. Based on the X-ray spot size and beam interval of the two pinhole collimator, 24 linear scan steps with a step size of 0.5 mm for each angular projection was sufficient to scan the transverse section of the phantom. We took measurements at 6 angular projections with an angular step of 30 degrees. For each linear scan, the EMCCD camera exposure time was 10 seconds and the linear stage moving time was 2 seconds. The total measurement time was 29.8 minutes. Compared with the single-beam scanning method, one half of scanning time was saved by using multiple-beam scanning strategy in this experiment.
After XLCT imaging, we have scanned the phantom with our lab-made microCT imaging system, in which the X-ray tube had a current of 0.5 mA and a tube voltage of 50 kVp. A filtered back-projection algorithm was used to reconstruct the microCT image with a Shepp-Logan filter.
2.7 Evaluation of the reconstructed XLCT image quality
Three criteria were used to evaluate the quality of the reconstructed XLCT images:
Target Size Error (TSE): This criterion is defined as the target diameter error ratio between the reconstructed target and the true target:
| (10) |
where and is the diameter of reconstructed and true target, respectively. is calculated from the cross target profile plot by using the full width tenth maximum (FWTM) approach, in which we measured the width at the tenth of the maximum.
Center-to-center Distance Error (CDE): For multiple target imaging, we define CDE as the distance error ratio between the reconstructed targets and the true targets:
| (11) |
where and is the center-to-center distance (CtCD) between the reconstructed targets and the true targets, respectively. is also calculated from the target profile plot by using the FWTM approach.
Dice Similarity Coefficient (DICE): DICE is used for comparing the similarity between the reconstructed and true targets:
| (12) |
where is the reconstructed region of interest that is defined to be the pixels whose intensities are higher than 10% of the the maximum of the normalized reconstructed intensity, and is the true target locations. Generally, the closer DICE is to 1, the better [15].
2.8 Measurement of radiation dose in XLCT
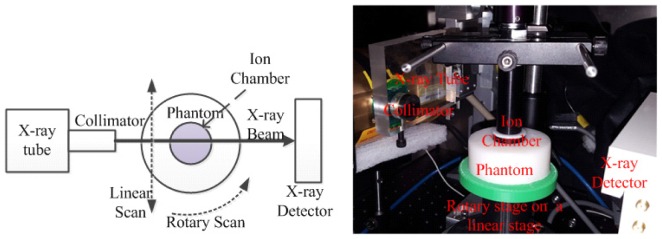
In order to determine the accumulated X-ray dose in the object when scanned by the two beam XLCT system, we performed a dose measurement experiment as shown in Fig. 7. The X-ray radiation dose was measured using an Accu-Dose system (Radcal, Monrovia, CA) with a general purpose in-beam ion chamber (10X6-6, Radcal). The active component of the ion chamber head has a diameter of 25 mm. The phantom, white color in Fig. 7 (right), was 44 mm in diameter and contained a central hole to fit the ion chamber head and was composed of 1% Intralipid and 2% Agar as in our prior experiment. The phantom was placed on the rotary stage mounted on the linear stage. The ion chamber was fit into the phantom center. We then performed a scan using the same experimental set-up as before. We used 24 linear scan steps with step size of 0.5 mm and 6 angular projections with an angular step size of 30° and an exposure time of 10 seconds per linear scan step.
Fig. 7.
The schematic design (left) and a photo (right) of the X-ray radiation dose measurement setup.
3. Results
3.1 X-ray beam size and intensity
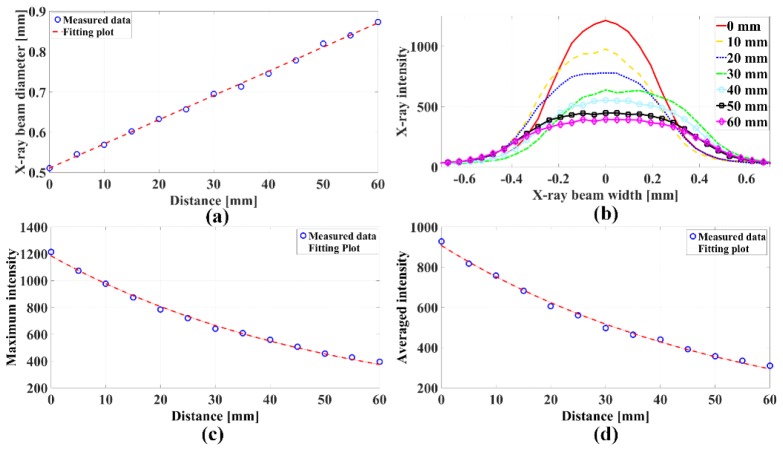
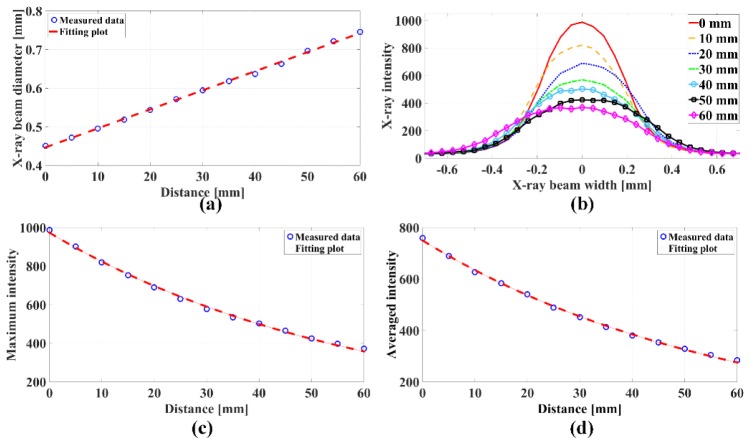
Figures 8 and 9 show the beam diameter, the profile plots across the X-ray spot, maximum intensity and averaged intensity (intensity per pixel) for the two X-ray beams, respectively. The measured beam diameter and profile plots demonstrate that the X-ray beams are conical and the beam diameter changes linearly as the distance increases, as shown in Figs. 8(a), 8(b) and 9(a), 9(b). The intensity curves in Figs. 8(c), 8(d) and 9(c), 9(d) show that the X-ray photon intensity attenuates exponentially along a straight line in the air, following the relationship expressed in Eq. (3). Figure 10 plots the interval of the two X-ray beams at different distances. From the plot, we see that the interval increases linearly as the distance increases.
Fig. 8.
Measurement and fitting of one collimated X-ray beam diameter and intensity: (a) X-ray beam diameter at different distances from the collimator; (b) Profile plot across the X-ray beam at different distances; (c) Maximum X-ray intensity at different distances; (d) Mean X-ray intensity at different distances.
Fig. 9.
Measurement and fitting of another collimated X-ray beam diameter and intensity: (a) X-ray beam diameter at different distances from the collimator. (b) Profile plot across the X-ray beam at different distances. (c) Maximum X-ray intensity at different distances. (d) Mean X-ray intensity at different distances.
Fig. 10.
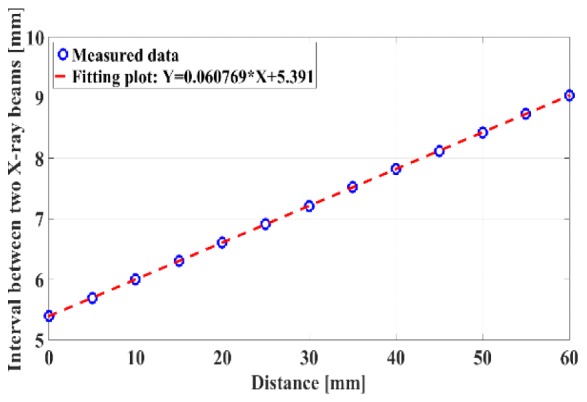
Measured interval between two X-ray beams at different distance and the linear fitting plot.
3.2 Results of numerical simulations for multiple-beam scanning strategy
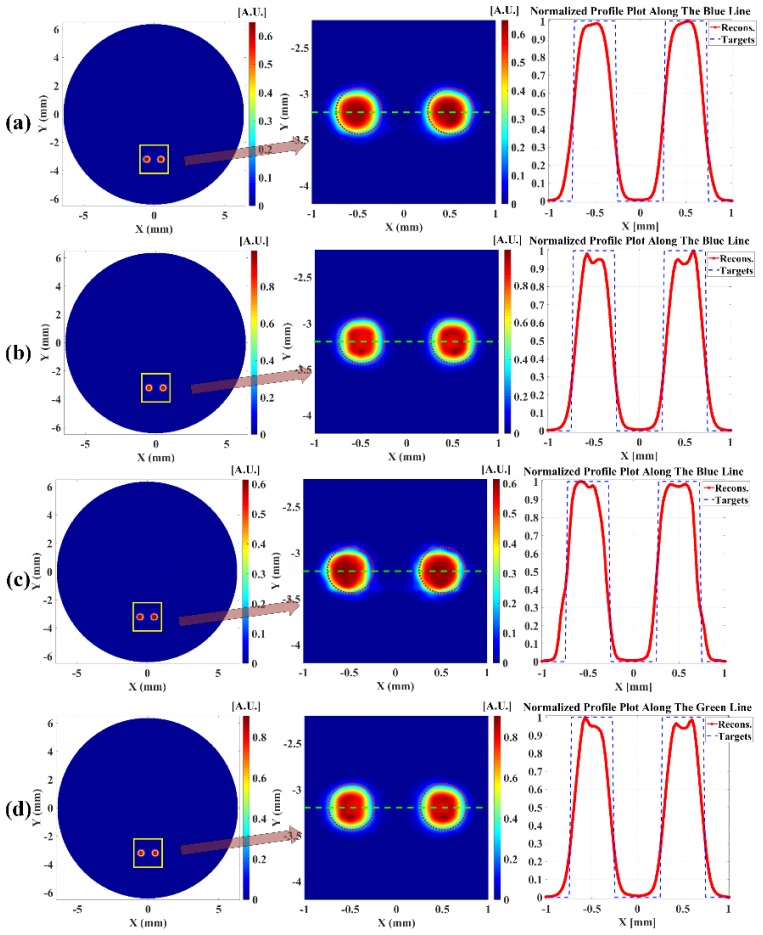
The scanned transverse section was discretized with a 2D grid having a pixel size of . The system matrix generated with the finite element mesh was interpolated to the fine 2D grid. During the reconstruction, L2 regularization method was applied in the MM reconstruction framework. Figures 11 and 12 show the reconstructed XLCT images for numerical simulations of two target case and six target case, respectively.
Fig. 11.
Reconstructed XLCT images (left column), zoomed in regions (middle column) and normalized profile plots (right column) for numerical simulation with two targets. (a) Reconstructed XLCT image with single parallel X-ray beam scan; (b) Reconstructed XLCT image with single conical X-ray beam scan; (c) Reconstructed XLCT image with four parallel X-ray beam scan; (d) Reconstructed XLCT image with four conical X-ray beam scan. The dotted green line indicates the profile position.
Fig. 12.
Reconstructed XLCT images (left column), zoomed in regions (middle column) and normalized profile plots (right column) for numerical simulation with six targets. (a) Reconstructed XLCT image with single parallel X-ray beam scan; (b) Reconstructed XLCT image with single conical X-ray beam scan; (c) Reconstructed XLCT image with four parallel X-ray beam scan; (d) Reconstructed XLCT image with four conical X-ray beam scan. The dotted green line indicates the profile position.
For the two target case, Figs. 11(a) and 11(c) show the reconstruction results of the parallel X-ray beam model, by using single and four X-ray beam scanning methods, respectively. Figures 11(b) and 11(d) show the reconstructed results using the cone shaped X-ray beam model with single and four X-ray beam scanning methods, respectively. The reconstruction errors for the two targets case were calculated as shown in Table 1. From Fig. 11 and Table 1, we see that the two targets have been reconstructed successfully with good shapes at correct locations and with a clean background according to the zoomed in image (middle column in Fig. 11). For the two target case, the image quality metrics degrade slightly when we applied the parallel X-ray beam in the XLCT reconstruction with the DICE of 81.68%. The DICE is 91.34% when we used the true conical X-ray beam in the XLCT reconstruction. From Table 1, we know that the TSE, CDE, and DICE are 8.35%, 0.23% and 93.74% for single conical X-ray beam case, and 11%, 0.45% and 91.34% for the four conical X-ray beam case. The error increases are very small when we used four X-ray beam scan, which means that we can use four X-ray beam scan in the future XLCT imaging.
Table 1. Quantitative imaging quality metrics for numerical simulation with two targets using different X-ray beams.
| Diameter (mm)/TSE | CtCD (mm)/CDE | DICE | |
|---|---|---|---|
| Single parallel beam | 0.608/21.6% | 1.0235/2.35% | 84.57% |
| Single conical beam | 0.5417/8.35% | 1.0023/0.23% | 93.74% |
| Four parallel beams | 0.6115/22.3% | 1.022/2.2% | 81.68% |
| Four conical beams | 0.555/11% | 1.0045/0.45% | 91.34% |
From Fig. 12, we see that all six targets have also been reconstructed at the right positions with an acceptable shape. Figures 12(a) and 12(c) show the reconstruction results of the parallel X-ray beam model, by using single and four X-ray beam scanning methods, respectively, while Figs. 12(b) and 12(d) show the reconstructed results using the conical X-ray beam model with single and four X-ray beam scanning methods, respectively. For simplicity, we only drew the profile plot across the middle row targets in Fig. 12 and calculated the reconstructed errors of the two targets as shown in Table 2. We can see that the single conical beam scanning method has a better performance in terms of TSE, CDE and DICE than other scanning methods as shown in Table 2. The image quality metrics degrades slightly when using four X-ray beam scanning. The DICE reduced from 71.6% to 65.25%, which is acceptable. Compared with traditional parallel X-ray beam model, the conical X-ray beam model can improve the reconstruction results and obtain smaller errors, especially regards to CDE and DICE.
Table 2. Quantitative imaging quality metrics for numerical simulation with six targets using different X-ray beams.
| Diameter (mm)/TSE | CtCD (mm)/CDE | DICE | |
|---|---|---|---|
| Single parallel beam | 0.3112/55.62% | 0.4177/4.44% | 58.04% |
| Single conical beam | 0.2663/33.14% | 0.4032/0.81% | 71.6% |
| Four parallel beams | 0.372/86% | 0.372/7% | 51.98% |
| Four conical beams | 0.3165/58.25% | 0.3755/6.13% | 65.25% |
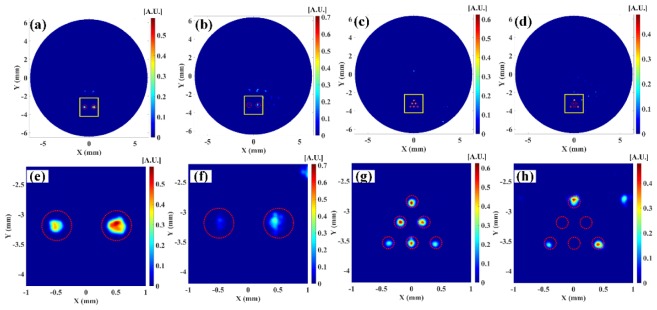
Figure 13 plots the reconstructed XLCT images and the zoomed in region of the targets. We found that the image quality has degraded substantially but can recover the targets when 8 parallel X-ray beams were used. The reconstructed XLCT image could not reconstruct all the six targets when 16 beams were used. This is probably due to the mutual effects of the simultaneously emitted optical photons at multiple locations with short distances when we applied more X-ray beams together. With sparse X-ray beams such as two beams and four beams, the optical emission locations are resolved well with our XLCT reconstruction algorithm.
Fig. 13.
Reconstructed XLCT images (top row) and zoomed regions (bottom row) for numerical simulation with two and six targets: reconstructed images for two target case with 8 parallel X-ray beam scan (a) and 16 parallel X-ray beam scan (b); reconstructed images for six targets with 8 parallel X-ray beam scan (c) and 16 parallel X-ray beam scan (d). The images in bottom row (e-h) are the zoomed images of their corresponding images of the same column in the top row.
3.3 Results of the phantom experiment
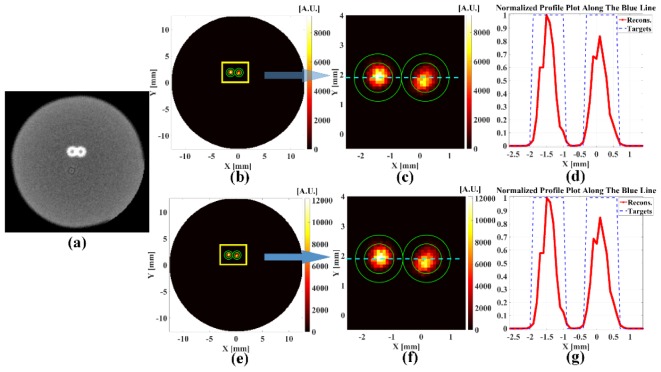
For the XLCT reconstruction, the phantom was discretized by a finite element mesh with 26,638 nodes, 153,053 tetrahedral elements and 11,456 face elements. The reconstructed section was discretized with a 2D grid with a pixel size of 100×100µm2. The sensitivity matrix of the 2D grid was interpolated from a sensitivity matrix based on the finite element mesh. The L2 regularized MM algorithm was applied here to reconstruct the XLCT image, as shown in Fig. 14. We have applied the X-ray beam diameter changes and the X-ray attenuation models in the XLCT reconstruction (the conical X-ray beam case) with the reconstructed XLCT image plotted in Fig. 14(e). For comparison, we have also used the parallel X-ray beam model (the unchanged beam diameter and intensity) in the XLCT reconstruction and plotted the image in Fig. 14(b). Figure 14(a) plots the microCT image of the phantom with two targets. From Figs. 14(a), 14(b) and 14(e), we see that two targets have been reconstructed successfully at the correct location. To analyze the reconstructed XLCT image quantitatively, we have calculated the image quality metrics as shown in Table 3. The TSE, CDE and DICE are 10%, 16.74 and 85.82% for the parallel beam case and 8.21%, 2.84 and 85.11% for the conical beam case. All these quantitative image quality metrics indicate that multiple deeply embedded targets can be reconstructed successfully by using multiple-beam scanning method and the conical beam model performs slightly better than the parallel beam model, which is consistent with our findings in the numerical simulations.
Fig. 14.
(a) A transverse section from the reconstructed microCT image of the phantom with two targets; (b) The reconstructed XCLT image with two parallel X-ray beams; (c) The zoomed in region in (b); (d) The normalized profile plot across the targets in (c); (e) The reconstructed XLCT image with two conical X-ray beams; (f) The zoomed region in (e); (g) The normalized profile plot across the targets in (f). The green circles are the inner and outer walls of the plastic tubes. The dotted line indicates the profile position.
Table 3. Quantitative imaging quality metrics for phantom experiment.
| Diameter (mm)/TSE | CtCD (mm)/CDE | DICE | |
|---|---|---|---|
| Two parallel beams | 0.9/10% | 1.3322/16.74% | 85.82% |
| Two conical beams | 0.9179/8.21% | 1.5546/2.84% | 85.11% |
3.4 Radiation dose in XLCT
The total accumulated exposure was 156.9 mR. Using an f-factor (conversion of exposure in air to absorbed dose in muscle at a diagnostic X-ray energy of 70 keV) of 0.94 rad/R or (cGy/R) [18], we calculate the absorbed dose to be 0.1475 cGy or 1.475 mSv which is in the range of a typical CT scan.
4. Discussion and conclusions
The multiple pinhole collimator based XLCT is an upgraded version of the traditional single X-ray narrow/pencil beam XLCT design, in which the data acquisition time and reconstructed image quality are primarily determined by the collimated X-ray beam size and the number of angular projections. In this paper, we have used four X-ray beams in our numerical simulation study and two X-ray beams in our experimental study. We believe these are sufficient to demonstrate our approach of multiple X-ray beam scanning in XLCT. In the future, if needed, we can further reduce the data acquisition time by using more X-ray beams. Certainly, there is an upper bound of the number of X-ray beams before we see the reconstructed XLCT image quality becomes compromised as shown in Fig. 13. For the numerical simulation cases with two and six targets, we have performed simulation studies with 8 and 16 X-ray beams as shown in Fig. 13. We believe there is a trade-off between the number of X-ray beams and the XLCT image quality, which deserves further investigations.
Although the measurement time of XLCT imaging is long, the X-ray beam size is small thus the accumulated X-ray dose in the object should be small, which was validated by our dose measurement experiment. Since the size of our ion chamber was large, we required a larger phantom in order to embed the chamber inside the phantom. In future studies, we plan to use a small ion chamber for more accurate measurement of the radiation dose in XLCT. Another point is that we could not find the f-factor to convert ion chamber measurement to the dose measurement in tissues for the energy of 30 keV. We used the f-factor for the energy of 70 keV, which may cause slight errors. Considering above factors, we believe our dose measurement in XLCT, the first reported dose measurement, is qualitative and is in the range of a typical CT scan.
To reduce the measurement time of XLCT and the radiation dose, it is better to take measurements in less angular projections. As reported in [12], we can reconstruct XLCT image very well with measurements at two projections for sparse targets. We have validated this conclusion in our simulation of two target case. However, for complicated target case such as the six target case, two projections are not enough. We have to use measurement in six projections to reconstruct good XLCT images.
As demonstrated in our numerical simulations and phantom experiment, the consideration of X-ray beam size and intensity changes in the XLCT reconstruction improves the image quality. And, as shown in Figs. 8 and 9, the two X-ray beam sizes were not the same. In the future, we have to measure all the X-ray beam size for multiple-beam XLCT imaging.
In our numerical simulations, we used the X-ray beam with a diameter of 0.1 mm, which can be achieved in two ways. One is to use a superfine pinhole collimator as described in [11] where we achieved an X-ray beam with a diameter of 0.192 mm. Another way is to use an X-ray tube with a polycapillary focusing lens (X-Beam, XOS, East Greenbush, NY 12061) with an focusing spot size of 50 micrometers, which is one of our future research plans. Our numerical simulations, not reported yet, indicate that XLCT can have better spatial resolution with smaller X-ray beam size.
In our numerical simulations, we just added 50% Gaussian noise to the numerical measurements. In the future studies, advanced noise models to include the Poisson noise from X-ray tube and the shot noise for the EMCCD camera will be investigated.
In summary, we proposed a multiple pinhole collimator based XLCT system design, and introduced a multiple-beam scanning strategy which reduced the data acquisition time by multiple times. The feasibility of the multiple-beam scanning method has been validated by numerical simulations and phantom experiments. In the numerical simulation studies, the multiple deep targets have been reconstructed successfully at the correct locations with good shapes. In the phantom experiments, by using a two pinhole collimator, compared with the traditional XLCT imaging, the total acquisition time was reduced by 50% without sacrificing the image quality. Two deeply embedded tiny targets have been reconstructed with very good accuracy in size and center-to-center distance. We have also measured the collimated X-ray beam size at different distance away from the collimator and included the changed beam size in the forward modeling and the reconstruction algorithms. We have measured the X-ray radiation dose during XLCT imaging and demonstrated that the dose is in the range of a typical CT scan.
Acknowledgement
This work is partially supported by Grants (R21 EB013828, R03 EB022305) from the National Institute of Health (NIH) and Start-up fund from UC Merced. The authors thank Prof. Simon R. Cherry in University of California, Davis for lending us the X-ray detector.
References and links
- 1.Pratx G., Carpenter C. M., Sun C., Xing L., “X-Ray Luminescence Computed Tomography via Selective Excitation: A Feasibility Study,” IEEE Trans. Med. Imaging 29(12), 1992–1999 (2010). 10.1109/TMI.2010.2055883 [DOI] [PMC free article] [PubMed] [Google Scholar]
- 2.Lu Y., Machado H. B., Bao Q., Stout D., Herschman H., Chatziioannou A. F., “In vivo mouse bioluminescence tomography with radionuclide-based imaging validation,” Mol. Imaging Biol. 13(1), 53–58 (2011). 10.1007/s11307-010-0332-y [DOI] [PMC free article] [PubMed] [Google Scholar]
- 3.Du J., Yang Y., Berg E., Bai X., Gola A., Ferri A., Zorzi N., Piemonte C., Cherry S. R., “Evaluation of linearly-graded SiPMs for high resolution small-animal PET,” Biomed. Phys. Eng. Express 1(4), 045008 (2015). 10.1088/2057-1976/1/4/045008 [DOI] [Google Scholar]
- 4.Li C., Yang Y., Mitchell G. S., Cherry S. R., “Simultaneous PET and multispectral 3-dimensional fluorescence optical tomography imaging system,” J. Nucl. Med. 52(8), 1268–1275 (2011). 10.2967/jnumed.110.082859 [DOI] [PMC free article] [PubMed] [Google Scholar]
- 5.Li C., Di K., Bec J., Cherry S. R., “X-ray luminescence optical tomography imaging: experimental studies,” Opt. Lett. 38(13), 2339–2341 (2013). 10.1364/OL.38.002339 [DOI] [PMC free article] [PubMed] [Google Scholar]
- 6.Pratx G., Carpenter C. M., Sun C., Rao R. P., Xing L., “Tomographic molecular imaging of x-ray-excitable nanoparticles,” Opt. Lett. 35(20), 3345–3347 (2010). 10.1364/OL.35.003345 [DOI] [PMC free article] [PubMed] [Google Scholar]
- 7.Chen D., Zhu S., Yi H., Zhang X., Chen D., Liang J., Tian J., “Cone beam x-ray luminescence computed tomography: a feasibility study,” Med. Phys. 40(3), 031111 (2013). 10.1118/1.4790694 [DOI] [PubMed] [Google Scholar]
- 8.Liu X., Liao Q., Wang H., “In vivo x-ray luminescence tomographic imaging with single-view data,” Opt. Lett. 38(22), 4530–4533 (2013). 10.1364/OL.38.004530 [DOI] [PubMed] [Google Scholar]
- 9.Cong W., Liu F., Wang C., Wang G., “X-ray micro-modulated luminescence tomography (XMLT),” Opt. Express 22(5), 5572–5580 (2014). 10.1364/OE.22.005572 [DOI] [PMC free article] [PubMed] [Google Scholar]
- 10.Cong W., Pan Z., Filkins R., Srivastava A., Ishaque N., Stefanov P., Wang G., “X-ray micromodulated luminescence tomography in dual-cone geometry,” J. Biomed. Opt. 19(7), 076002 (2014). 10.1117/1.JBO.19.7.076002 [DOI] [PMC free article] [PubMed] [Google Scholar]
- 11.Zhang W., Zhu D., Zhang K., Li C., “Microscopic x-ray luminescence computed tomography,” Proc. SPIE 9316, 93160M (2015). 10.1117/12.2076797 [DOI] [Google Scholar]
- 12.Li C., Martínez-Dávalos A., Cherry S. R., “Numerical simulation of x-ray luminescence optical tomography for small-animal imaging,” J. Biomed. Opt. 19(4), 046002 (2014). 10.1117/1.JBO.19.4.046002 [DOI] [PMC free article] [PubMed] [Google Scholar]
- 13.Li C., Wang G., Qi J., Cherry S. R., “Three-dimensional fluorescence optical tomography in small-animal imaging using simultaneous positron-emission-tomography priors,” Opt. Lett. 34(19), 2933–2935 (2009). 10.1364/OL.34.002933 [DOI] [PMC free article] [PubMed] [Google Scholar]
- 14.Zhu D., Li C., “Nonuniform update for sparse target recovery in fluorescence molecular tomography accelerated by ordered subsets,” Biomed. Opt. Express 5(12), 4249–4259 (2014). 10.1364/BOE.5.004249 [DOI] [PMC free article] [PubMed] [Google Scholar]
- 15.Zhu D., Li C., “Nonconvex regularizations in fluorescence molecular tomography for sparsity enhancement,” Phys. Med. Biol. 59(12), 2901–2912 (2014). 10.1088/0031-9155/59/12/2901 [DOI] [PubMed] [Google Scholar]
- 16.Cong W., Shen H., Wang G., “Spectrally resolving and scattering-compensated x-ray luminescence/fluorescence computed tomography,” J. Biomed. Opt. 16(6), 066014 (2011). 10.1117/1.3592499 [DOI] [PMC free article] [PubMed] [Google Scholar]
- 17.Chen D., Zhu S., Cao X., Zhao F., Liang J., “X-ray luminescence computed tomography imaging based on X-ray distribution model and adaptively split Bregman method,” Biomed. Opt. Express 6(7), 2649–2663 (2015). 10.1364/BOE.6.002649 [DOI] [PMC free article] [PubMed] [Google Scholar]
- 18.“Standardized methods for measuring diagnostic X-ray exposures,” AAPM Diagnostic X-ray Imaging Committee Task Group #8, Report No. 31, (1991).


