

Abstract
A novel 3D reconstruction and fast imaging system for subcutaneous veins by augmented reality is presented. The study was performed to reduce the failure rate and time required in intravenous injection by providing augmented vein structures that back-project superimposed veins on the skin surface of the hand. Images of the subcutaneous vein are captured by two industrial cameras with extra reflective near-infrared lights. The veins are then segmented by a multiple-feature clustering method. Vein structures captured by the two cameras are matched and reconstructed based on the epipolar constraint and homographic property. The skin surface is reconstructed by active structured light with spatial encoding values and fusion displayed with the reconstructed vein. The vein and skin surface are both reconstructed in the 3D space. Results show that the structures can be precisely back-projected to the back of the hand for further augmented display and visualization. The overall system performance is evaluated in terms of vein segmentation, accuracy of vein matching, feature points distance error, duration times, accuracy of skin reconstruction, and augmented display. All experiments are validated with sets of real vein data. The imaging and augmented system produces good imaging and augmented reality results with high speed.
OCIS codes: (110.0110) Imaging systems, (110.3080) Infrared imaging, (170.0110) Imaging systems, (100.0100) Image processing, (100.3010) Image reconstruction techniques
1. Introduction
Intravenous injection is a basic and rapid medical method in bedside care. Intravenous therapy can quickly deliver electrolytes, nutrients, and water to the body by inserting a catheter into the veins. Among the 500 million intravenous insertions performed annually worldwide, nearly 14 million failure cases occur on the first attempt [1]. Failed insertions generally cause pain and bruising, and may even lead to venous sclerosis. The primary reason for failure insertions is the difficulty of locating veins precisely based only by virtue of visual and tactile experience of medical professionals. Small veins in women and children, veins beneath dark skin color, or veins in fat layer in obese patients are extremely difficult to visualize or feel by practitioners. Moreover, narrow veins caused by increasing blood pressure resulting from anxiety aggravate the difficulty in identifying veins.
Enhancing the localization of subsurface veins may improve the success rate of intravenous injection [2]. Ultrasound can visualize the blood vessel but with extra assistance and expense. White or red light source may also be transmitted through thin body parts. However, skin burns may be caused by excessive heat production. Non-invasive near-infrared light (NIR) may also be used. High absorption of blood with more deoxygenated hemoglobin for NIR develops the veins much darker than surrounding tissues in the wavelength of 700–900 nm [3]. NIR imaging systems are commercially available to increase the success of phlebotomists, nurses, and anesthesiologists.
VascuLuminator (de Konigh Medical Systems, Arnhem, the Netherlands), developed in [2], was based on transillumination of the puncture site with NIR. The maximum depth of visibility is 5.5 mm for a 3.6 mm blood vessel of phantom data. However, the high intensity of transillumination light needed may cause a burning sensation in opisthenar. Two other devices currently on the market, namely, VeinViewer Vision [4] (Christy Medical Corporation, Memphis, TN, USA) and the AccuVein (AccuVein AV300; Avant Medical, Cold Spring Harbor, NY, USA), use the reflection of NIR light instead of transillumination. VeinViewer Vision allows maximum 10 mm depth of clinically relevant veins to be observed [5].AccuVein provides a permanently alignment, and the center line accuracy of which is less than the width of a human hair [6]. Both instruments are designed as vein contrast enhancers to reveal vessels invisible to the eyes by locating subcutaneous veins and back projecting them on the skin surface. However, the relative depth or diameter of vessels is not provided by both devices. Additionally, VueTek Veinsite [7] (VueTek Scientific LLC, Grey, Maine, USA), a head-mounted vascular imaging system, is commercially designed to offer hands-free and portable operation. Concentrating on automatic intravenous insertion, robotics is combined with image analysis software. The performance of the system is evaluated by counting the number of the emerging veins for patients with different ages, genders, heights, weights, ethnicities and skin colors. Veebot (Veebot LLC) [8] and 7 DOF robotic IV insertion system [9] are developed to achieve automatic vein recognition and intravenous catheterization autonomously. Veebot achieves 83% accuracy rate in selecting the best vein for insertion [10]. 76% of individuals are successfully inserted according to the subjective judgment of medical doctors by 7 DOF robotic IV insertion system. The aforementioned systems do not provide the 3D topography of the surface and vein structures that are significant factors for precise injection. In addition, Doshisha University designed a 3D blood vessel search system, which is installed in a portable self-monitoring blood glucose device [11]. Blood vessel locations are investigated using this device. Only phantom data are evaluated, and bifurcation of vessels is not considered. The results on real vein imaging present serious errors because of the exclusion of complex blood vessel structures. The portable robot for autonomous venipuncture developed in [12] presents a stereo camera system to construct the 3D vein by moving cameras. The system requires a precise motorized system to control the motion of cameras, thus, the implementation complexity of the system is high. On the other hand, the reconstruction of 3D skin is not described in detail and the depth below the skin surface is not obviously available. The mean completion time is 18.46s for imaging, image processing, and stereo. A 3D imaging system [13] is developed to provide 3D information of the arm surface and automatically detect veins. The system requires a laser stripe line generator for 3D skin reconstruction and no 3D structure of veins is given. The detailed overviews for subcutaneous veins localization using imaging techniques are referred to a recent review [14].
The improvement of subcutaneous vein recognition has received much attention. NIR imaging for subcutaneous veins has generally a lower image quality, and blood vessel contours are relatively obscure. Traditional methods cannot be directly used to segment subcutaneous veins. To date, state-of-the-art segmentation methods for subcutaneous veins are mainly divided into two categories, namely, image patch-based threshold selection segmentation methods and structure feature-based vein segmentation methods. For the first category, Zhou et al. proposed a simple linear iterative clustering technique which divides the image into small polygon patches and completes vein segmentation with the NiBlack threshold for each patch [15]. Chen et al. [16] proposed a fast local threshold calculation method based on grayscale morphology to realize the local adaptive threshold segmentation. These methods are fast but susceptible to the environment and illumination changes, because only the gray-level distribution, instead of the structural characteristics of blood vessels, is considered. For the second category, Naoto et al. introduced a repeated line tracking method based on the characteristic of the gray ridge distribution of blood vessel contours [17] to track for vein recognition. Marios et al. combined Hessian matrix and template matching by considering the blood vessel structure to enhance the vein [18], and applied KNN and NNCA for vein segmentation [19]. Yang used a multi-channel Gabor filter-based vein enhancement method [20]. Veins with different angles and widths were enhanced by the Gabor parameter model and reconstructed to obtain the final vein enhancement image. Zhao et al. [21, 22] proposed an infinite perimeter active contour model with hybrid region information. Image orientation field [23] uses the distribution ratio of directional fields and a specific threshold to perform vein segmentation. An active contour-based method [24] improves local binary fitting by fuzzy localness to segment veins with inhomogeneous intensity. However, these two methods obtain abundant blood vessel information with high noise in the vein segmentation results.
The specificity and visualizing depth of subcutaneous vein are considered in the development of 3D vein reconstruction systems. These systems commonly assist in intravenous injection and identification of veins to enhance the success rate of intravenous injection further. Hu et al. [25] used edge extraction and the sum of absolute difference matching to realize 3D vein reconstruction and visualize a relatively complete structure. However, this method attained a rough reconstruction of 3D vessels, which was only used to match the structural similarity and could not be applied to 3D localization of venous vessels [26, 27]. Paquit et al. [28] introduced a method to visualize the 3D skin surface and subcutaneous structures using 3D modeling, ray tracing, and Monte Carlo light propagation modeling. However, reconstructing and visualizing veins with a complete structure and accurate positioning are difficult using the existing methods.
Fast and precise guidance to define the position of subcutaneous veins better still needs to be addressed. An imaging system is expected to perform as follows: 1) find vein boundaries with high sensitivity; 2) reconstruct the 3D topography of the surface and veins with high precision; and 3) visualize processed veins intuitively. The imaging system should also be cost effective. Thus, a prototype imaging and augmented system (IAS), which satisfies the aforementioned design requirements, is developed to assist intravenous injection effectively. The advantage of the IAS is based on two inseparable parts, namely, hardware design (imaging system) and software development (image processing). Seven components are integrated to construct the system based on the design scheme, control flow and calibration method. These components include two industrial cameras, a color micro projector, NIR light sources, control circuit, a computer monitor, a support structure with multi-degree of freedom, and an underpan. The following methods are proposed for image processing: 1) a vein segmentation method by combining multi-scale information and structural information; 2) 3D reconstruction of subcutaneous veins according to epipolar constraints and hierarchical optimization, and back-projection on the skin surface for augmented reality; and 3) skin surface reconstruction using active structured light with spatial encoding values, and fusion displayed with the reconstructed vein with indicative vein depth. Thus, we present an improvement of state-of-the-art devices by considering all the requirements for intravenous injection. Figure 1 shows the prototype IAS and will be demonstrated in detail.
Fig. 1.

Prototype of the imaging and augmented system: (a) front view; (b) front view without cover; and (c) enlarged view of the part in the red box.
The contributions of this work are summarized as follows:
We build a novel augmented reality system for real-time subcutaneous vein imaging, including system construction and system calibration.
The special processing methods for the IAS are proposed to segment and reconstruct veins which are further fused with reconstructed skin and projected into the real skin.
The whole process for subcutaneous vein imaging is realized with a quick and accurate response in real-time.
The reconstructed veins and the skin are simultaneously visualized, and the indication of vein depth below the skin surface is provided.
2. Imaging system
2.1. System construction
The overall assembly drawing for IAS is shown in Fig. 2. The imaging system is composed of two industrial cameras C1 and C2, a color micro projector P, a set of NIR rings of LEDs L, NIR light source control circuit, a computer monitor, a support structure with six-degree of freedom, and a underpan with a hand rail H. In Fig. 2(e), Φ1, Φ2,...,Φ6 denote six-degree of freedom: rotation Φ1 and Φ3 of two cameras, translation Φ2 of the NIR rings, translation Φ4 and rotation Φ5 of the projector, and height adjustment Φ6. The support structure cannot be arbitrarily adjusted when the visual field of patients hand is fixed. L, C1 and C2 form the visual system of the 3D reconstruction of subcutaneous vein. P, C1 and C2 form the visual system of 3D reconstruction of the skin surface. The computer monitor controls the cameras and projector, system calibration, segmentation and reconstruction of subcutaneous veins, reconstruction of skin surface, 3D data visualization, and vein back-projection.
Fig. 2.

(a) The overall system assembly drawing; (b) Front view; (c) Left view; (d) overlooking; (e) Six-degree of freedom of the support structure.
Industrial cameras are used for imaging both subcutaneous veins and skin surface because three kinds of system design are considered as follows. (1) The crosswise size of the system is reduced with camera multiplexing. (2) The angle between cameras is enlarged by adding a number of cameras for close imaging distance. Thus, the difficulty of time control is reduced and the imaging cross region is expanded with camera multiplexing. (3) The relative position between veins and skin is directly obtained with camera multiplexing. Camera multiplexing requires that the photosensitive range of cameras should simultaneously cover NIR light (700–900 nm) and visible light (450–700 nm). Meanwhile, exposure time and luminance gain should be adjusted in a certain range to guarantee the clarity and contrast of images during mode conversion of imaging. Mini USB cameras DH-HV1351UM-ML with 1.3 megapixels (Daheng IMAVISION, China) meet all the above requirements and are used as industrial cameras. Monofocal lenses M1214-MP2 with 12mm fixed focal length (Computar, Japan) are selected for close-up applications required in image processing.
Veins appear much darker than the surrounding tissue at 850nm NIR wavelength. Thus, the 30°Infrared 36-LED Illuminator Board Plate (FY-10036A-30) with peak velocity at 850nm is used as a light source. The LEDs are focused on the target area, that is, the dorsum of the hand, and set in the middle of the cameras to compensate illumination during imaging.
Projecting encoding images and back-projecting reconstructed veins are achieved by a micro projector. Acer C205 with rated brightness of 200 lumens and native WVGA (854 × 480 pixels) resolution is used as the micro projector and satisfies the requirement of small size (140 × 108 × 27mm3) and maximum focal length (7.18 mm).
The light source and cameras are placed on the same side of the target area. The reflected light by LEDs is captured by the cameras on the same side. The distance between the target area and the cameras is set to 35cm. A control circuit is connected to a computer monitor by a serial port. The circuit is designed to control the alternate conversion between NIR and encoding light sources. The circuit uses MSP430 single-chip microcomputer as control chip, N channel field-effect tube SI2320 A2SHB as the electronic switch, and USB-SERIAL CH340 as the serial port.
The handrail H placed on the underpan limits the hand shapes of patients. Making a fist when holding the handrail could improve the contrast of veins in the NIR images because of tauter skin. Moreover, this practice can reduce the influence of subcutaneous tissues for imaging. The dark substrate of NIR diffuse reflectance is tiled under the handrail to guarantee the gray difference between the background and dorsum of the hand.
2.2. System calibration
The IAS is calibrated to determine the internal and external parameters of the two cameras and the projector. Calibration is performed when the positions of the cameras and projector have been fixed.
(1) Camera calibration
Assuming that the monocular camera is pinhole imaging. We denote a 2D point as p0 = [u, v]T and a 3D point as pW = [XW, YW, ZW]T. After adding 1 as the last element of p0 and pW (i.e. p0 = [u, v, 1]T and pW = [XW, YW, ZW, 1]T), we express the relationship between the 3D point pW and its image projection p0 by the following calibration model [29]:
| (1) |
where λ is an arbitrary scale factor, is the internal parameter matrix, and [R T] is the external parameter matrix. R and T indicates the rotation and translation between the world and camera coordinate systems, and includes three parameters (θ1, θ2, θ3) and (t1, t2, t3), respectively. To correct the image distortion caused by the curved lens, the distortion parameters are usually introduced into the calibration model, including the radial distortion parameters [k1, k2, k3, k4, k5, k6] and the tangential distortion parameters [p1, p2]. The conversion relationship between the imaging and distortion coordinate systems is as follows:
| (2) |
where, (x, y) is the imaging coordinate, (xd, yd) is the distortion coordinate, and . Moreover, the conversion relationship between the imaging and image systems is
| (3) |
Based on the conversion relationship between different coordinate systems, planar check-board patterns are used to calibrate the camera by calculating 18 parameters of the camera [29]. These parameters include the internal (i.e., [ax, ay], [u0, v0], and [k1, k2, k3, k4, k5, k6, p1, p2]) and the external (i.e., [θ1, θ2, θ3] and [t1, t2, t3]) parameters. The external parameters (the number is 6) are the same for each planar checkboard pattern if the world coordinates are fixed. The internal parameters (the number is 12) are the same for all planar checkboard patterns. According to Eq. (2), one square corner (xd, yd) in the planar checkboard pattern provides two equations. Assuming that K planar checkboard pattern images in different orientations are used to calibrate the camera, and N square corners are extracted for each image. Thus, to calculate all the parameters, the number of 2NK should be larger than the number of the parameters of all the images (i.e., 2NK > 6K + 12). Moreover, only four square corners in a planar checkboard pattern are linearly independent, which indicates that N = 4 and 2 × 4K > 6K + 12 ⇔ K > 6. Thus, at least six images are required to ensure the parametric solution. In this study, to reduce the calibration error, 50 planar checkboard patterns in different orientations are collected for an accurate calibration. The simulation diagram for 50 planar checkboard patterns is shown in Fig. 3. Back-projection errors calculated from the left and right views of cameras are shown in Fig. 4.
Fig. 3.

Pose relationship of binocular vision system.
Fig. 4.

Back-projection error of left and right views.
(2) Projector calibration
The projector without an imaging function can only obtain the image coordinate system without the world coordinate system. The left camera C1 as a calibrated camera is utilized to access the world coordinate system. The calibration plate for the projector consists of marked points and projection area. The calibration plate is designed as Fig. 5.
Fig. 5.
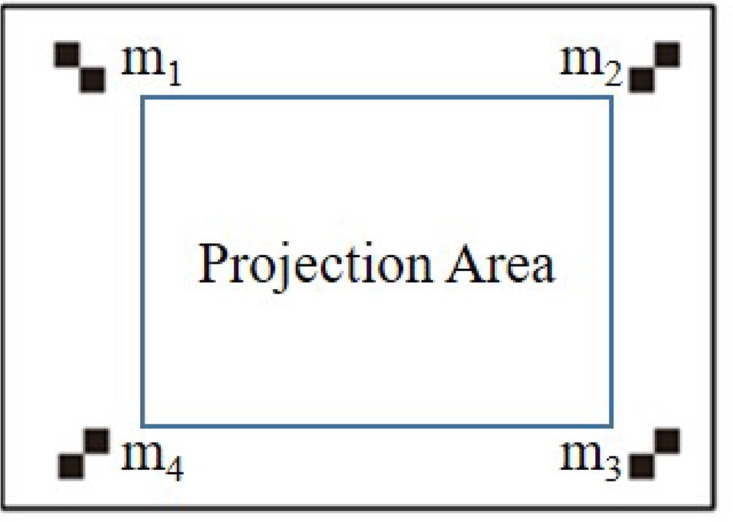
The projector calibration plate.
The four-step projector calibration is performed as follows. First, relative positions among the projector, calibrated camera, and calibration plate are fixed. Second, marked points (m1, m2, m3, m4) are then extracted from the calibration plate by the camera, and the external parameters between the camera and world coordinate systems are calculated. Third, the planar checkboard pattern is projected into the projection area by the projector. The image composed of projected planar checkboard pattern and marked points is taken by the camera. The world coordinate system of the marked points is calculated by external parameters. Finally, linear equations of the internal and external parameters of the projector are set up and solved based on the world and image coordinates of the marked points. According to the internal and external parameters of the projector, the projected planar checkboard patterns are back-projected into image coordinates, and the error of the projector calibration is shown in Fig. 6.
Fig. 6.

Back-projection error of the projector calibration.
3. Imaging processing
The NIR images have low contrast; thus, the subcutaneous vein images are further analyzed and processed using Microsoft Visual Studio C++ with OpenCV library and Qt for graphical user interfaces after the images are captured. Vein segmentation, 3D reconstruction of subcutaneous veins, and skin surface are implemented to obtain the 3D topological structure of veins and the skin. The processed subcutaneous veins are further back-projected onto the dorsum of patients - hands for augmented veins.
3.1. Vein segmentation
Isotropic undecimated wavelet transform (IUWT) is composed of wavelet decomposition and image reconstruction. Wavelet decomposition gives wavelet scale images and wavelet decomposition images wi+1 = Ci − Ci+1. Here, I0 is the original image, and hi−1 is the multiple scale kernel function. The procedure of wavelet decomposition obtains the detail information of the image. The procedure of image reconstruction is a combination of different wavelet decomposition images. Since vascular characteristics are mainly contained within a continuous scale range [σ1, σ2], the reconstructed image can enhance the multiscale veins: exclusion of small-scale suppress image noise, while exclusion of large-scale correct non-uniform illumination.
Tubular structure analysis is achieved by eigen-decomposition of a Hessian matrix according to the second-order partial derivative of the image. Eigenvalues λ1 and λ2, as well as the corresponding eigenvectors v1 and v2, are obtained by singular value decomposition of the Hessian matrix and |λ1| ≤ |λ2|. Four feature images are further obtained as follows:
-
(a)
Rough segmentation image: according to the eigenvalue λ2, the rough vein segmentation result are obtained by . The threshold t2 is determined in each scale σk.
-
(b)
Vein similarity image: , where, σmax and σmin are the maximum and minimum scales of the Gaussian kernel function; t is the filtration factor, which filters the background without destroying the integrity of veins [30].
-
(c)
Vein scale image: maximum scale of each pixel for ; and
-
(d)
Vein direction image: direction of each pixel denoted by the eigenvector v1.
According to four feature images shown in Fig. 7, refined segmentation is implemented. The vein centerlines are obtained by thinning the rough segmented veins in Fig. 7 (a). The endpoints and bifurcation points as the feature points of veins are extracted according to the neighborhood information of points in the vein centerlines. The veins are further split into branches by tracking and going through all the feature points. The vein direction image shown in Fig. 7(d) is further used to repair the structural deficiency in the bifurcation, end of veins, and weak contrast regions. Piecewise spline fitting proposed in [31] is used to simultaneous fit and interpolate the veins to obtain the uniform branch center lines and accurate direction information of the branch. Based on the method proposed in [32], a contour image is generated. 2D features for each pixel are obtained by projecting the vein similarity image Fig. 7(b) and IUWT image Fig. 7(c) into the contour image, which are further clustered into three categories, namely, veins, fuzzy region, and background. The relative categories are projected into the original image space. The refined veins are then finally segmented by filled holes in the blood vessel with morphological closing operation, and the small area in the image is removed with morphological connected-domain method.
Fig. 7.

Feature images: (a) rough segmentation image, (b) vein similarity image, (c) vein scale image, and (d) vein direction image.
3.2. 3D reconstruction of veins
Without loss of generality, veins are assumed to locate in a plane because of the long imaging distance between veins and cameras. Thus, homography, as a weak constraint of the relationship between left/right views, is used to assist vein matching. The aforementioned assumption ensures a fast, real-time and relatively accurate 3D reconstruction of veins. Speeded-up robust features (SURF) [33] are extracted as candidate points from the vein feature image obtained by proportionally fusing the vein similarity image and vein enhancement image. Homography matched relationship between candidate points in the left and right views is fixed with the RANdom SAmple Consensus (RANSAC) method, and homography-matched points are obtained. The merit of RANSAC is that the model parameters are robustly estimated and not affected by outliers.
The strict constraint of relationship between the homogeneous coordinates of the left and right views is described by the polar line constraint equation. Assuming that points p1 and p2 are in the vein centerlines of the left and right views, respectively, we limit point p2 in the corresponding pole line of p1 to find the matching point p2 for p1. For points in the left view, the candidate matching points in the right view are obtained by the polar line constraint. This result indicates that the intersection between the polar line of p1 and centerline in the right view denotes the candidate matching points. The matching points are screened with matching difference degree D between homography-transformed points and candidate matching points. The matching difference degree D is defined by combining Euclidean and Cosine distances, as follows:
| (4) |
where pH and denote the coordinate and vein direction of homography-transformed point of p1, respectively. p′ and denote the coordinate and vein direction of the candidate matching point of p1, respectively. If the coordinate (pH and p′) and vein direction ( and ) are similar, the matching difference degree D is small. The strict matching of the vein centerline is achieved by estimating the matching difference degree D and used to optimize further the homography matrix calculated with SURF matching points. The candidate matching points in the complex regions are screened based on the known vascular segments to correct the vein centerlines matching. The matching difference degree D between vascular segments is calculated with known centerline matched points and then used to screen the un-matched points. For matched points q1 and q2, the relationship between the image coordinate and corresponding 3D space coordinate X is based on a binocular vision imaging model and shown as follows:
| (5) |
| (6) |
where P1 and K1 are the projection and internal reference matrices of camera C1, whereas corresponding matrices for camera C2 are denoted by P2 and K2. [R|t] is the rotation and translation matrix, and denotes the jth row of the projection matrix Pi (i = 1, 2; j = 1, 2, 3). The 3D coordinates of vein centerlines are attained using the relationship between matched points.
The 2D vessel fitting method [33] is extended in our system to ensure the continuity and smoothness of vein centerlines. The vein centerline is divided into equal segments. The polynomial fitting is implemented between different segments, while, three-spline interpolation is executed in each segment. The number of the segments is determined by the trade-off between the bendability and smoothness of veins. In the vein segmentation procedure, the 2D diameter information is obtained by left and right views, respectively. This information is used to estimate the vein radius and assist the 3D vessel wall reconstruction. The vein radius are processed by polynomial fitting and interpolation. Vein surfaces are obtained by generating cylindrical ring along the tangent direction of 3D vein centerlines, which are shown in Fig. 8.
Fig. 8.

Surface rendering of 3D reconstructed vein structures with scales in four different views using a real image.
3.3. 3D reconstruction of skins
Skin surface is difficult to reconstruct densely under passive imaging or uniform illumination imaging without a large number of feature points. Thus, the space binary encoder based on Gray code is used for skin surface encoding and generates adequate feature points. Assuming FuncG(x) transforms binary code x into the corresponding Gray code. For an image of size D1 × D2, the row/column encoding is as:
| (7) |
where, phase shift ps = ⌊(2n − Di)/2⌋, n = ⌈log2 (Di)⌉, i ∈ {1, 2}, Di is dimension of the image; Gray(j) is the jth row or column. The system projects structure light encoding patterns on the back of the skin surface according to the fixed time sequence, which is shown in Fig. 9. The deformation of the projected lines is due to the spatial variation of opisthenar.
Fig. 9.

Row/column Gray encoding project on the back of the skin surface.
Decoding is the process of determining the column/row encoding values on the area of opisthenar, including judgment of opisthenar area, pixel decoding, and code-word combination. The opisthenar area is judged by calculating the difference between the positive ( ) and negative ( ) code images. The decoding in the opisthenar area is limited by placing a dark diffuse substrate under the handle and the adjusting exposure time of imaging device. This step ensures that evident black and white flips arise only on the hand area. Pixel decoding is performed to solve the encoding value of each pixel using an image sequence. The ith Gray encoding value of a pixel p in the image sequence Gi (p) is calculated by a set of ( ) and ( ). If the difference between and is more than a default threshold, Gi (p) is equal to one. Otherwise, Gi (p) is equal to zero. Pixels with same code value may be in the adjacent area because of the low contrast of the image. Thus, the center coordinate of the adjacent area is re-calculated as the coordinate of the code value. The decoding image is obtained by transforming the Gray code into binary values, and the results are shown in Fig. 10.
Fig. 10.

Decoding images obtained by transforming the Gray code into binary values: (a) Column decoding image in the left view; (b) Row decoding image in the left view.
Dense point cloud reconstruction of skin surface is implemented according to the decoding images captured from the binocular cameras. For a point in the left view, we find the corresponding matched point with the same decoding value in the right view using the Hash structure. The skin surface is reconstructed according to the principle of triangulation with all matched point sets. The 3D reconstruction of the skin surface is illustrated in Fig. 11.
Fig. 11.

Surface rendering of 3D reconstruction skin in three different direction using a real hand.
4. System performance
A sequence of experiments is conducted to evaluate the performance of the developed IAS for vein segmentation, 3D reconstruction of veins and skins, and augmented display.
4.1. Real vein segmentation
The real subcutaneous vein image is processed to investigate the robustness of the proposed segmentation method. The contrast and acutance of edges are low in the subcutaneous vein image shown in Fig. 12, especially in areas a, b, and c. The contrast of veins in area a is influenced by the light shadow. The veins in deep-seated vessels in area b are almost invisible compared with the superficial-seated vessels. The vein edges in the area c are extremely obscured because of the intersection of multiple vessels.
Fig. 12.
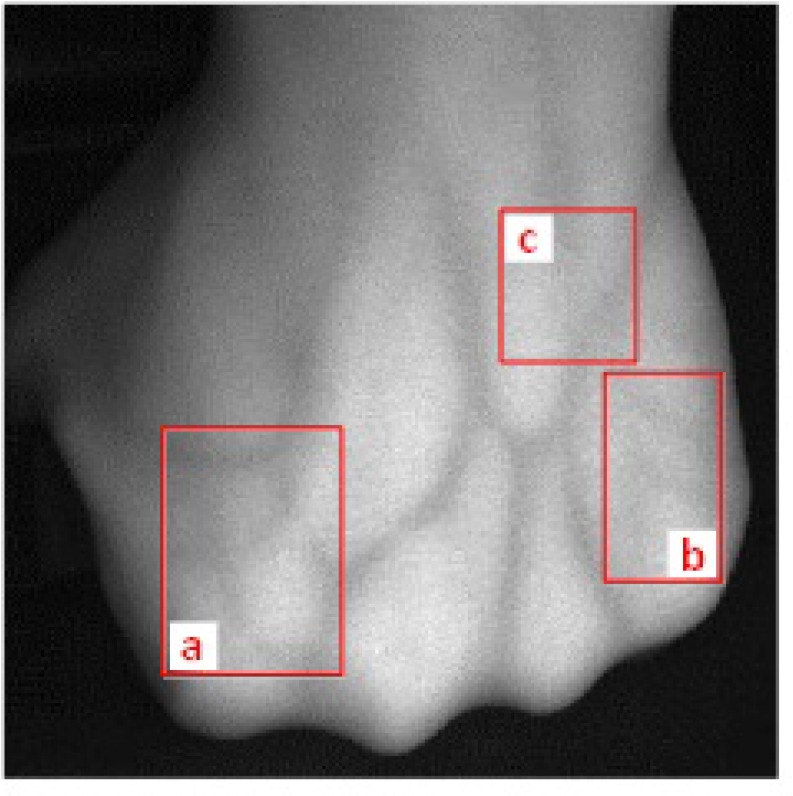
Real subcutaneous vein image with low contrast and acutance of edges: (a) influenced by the light shadow; (b) deep-seated vessels; (c) obscured intersection of multiple vessels.
The vein segmentation results shown in Fig. 13 are obtained using the proposed method and Gaussian matched filters (GMFs) [34]. The proposed method accesses the veins with complete structure, smooth edge, and precise diameter information. By contrast, GMF cannot adapt for both vein structure and noise interference because the threshold varies in different images.
Fig. 13.

The segmentation results of real subcutaneous vein image by using (a) the proposed method; (b d) the Gaussian matched filtering method of three thresholds 1.0, 0.95 and 0.92.
4.2. Accuracy of vein matching
Accuracy of vein matching is an important measure of successful vein 3D reconstruction. Ground truth of the structure of real subcutaneous veins is unavailable, so the vein back-projection error is applied to describe the accuracy of vein matching. Vein back-projection denotes the vein image that is obtained by projecting the 3D reconstructed vein structure into the imaging plane according to the internal and external parameters of cameras [R T]. The back-projection error is mainly caused by the segmentation accuracy, vein matching accuracy and the internal/external parameters of cameras. Assuming that the proposed segmentation method could obtain the ground truth segmented veins for detecting the accuracy of vein matching. Moreover, a precise system calibration is implemented. Thus, the larger vein matching error reflects the higher back-projection error.
Five different groups of real subcutaneous veins are imaged in the left and right views and shown in the first two rows (a1∼a5 and b1∼b5) in Fig. 14, respectively. These five sets of vein images with various characteristics are collected from different subjects studying in Beijing Institute of Technology. The ground truth segmented veins is shown in the middle two rows (c1∼c5 and d1∼d5) in Fig. 14, respectively. According to the proposed 3D vein reconstruction method, the 3D vein structure is obtained and back-projected into two imaging planes, shown in the last two rows (e1∼e5 and f1∼f5) in Fig. 14, respectively. The red lines in the back-projection images denote the segmented veins without corresponding matching results and cannot be reconstructed. The black areas are the background. The pink, white, and yellow lines denote the veins that are segmented and matched with different back-projection errors. The matching error gradually increases from pink to yellow. The vein structures are evidently sparse and simple in Figs. 14(c1, d1) and (c4, d4). The segmented vein structures in the left view exhibit clear corresponding structures in the right view. Thus, vein matching can be easily achieved using the proposed method. However, the vein structures in left-right views in Fig. 14(c2, d2), (c3, d3) and (c5, d5) are more complex with evident difference. Not all branches of blood vessels in one view can capture the corresponding matching vein in the other view. For these images, the proposed matching method can suppress the disturbance of mismatched blood vessels to complete vein matching. The back-projection error in Figs. 14(e2, f2) and (e3, f3) increases in the area of the end of the opisthenar close to the elbow. This finding is due to the fact that the elbows do not meet the hypothesis of planes, and have large parallax between left-right views. Furthermore, back-projection errors become large near the intersection of blood vessels.
Fig. 14.

Vein back-projection error. (a1∼a5, b1∼b5) Five different groups of real subcutaneous veins are imaged in the left and right views; (c1∼c5, d1∼d5) The ground truth segmented veins; (e1∼e5, f1∼f5) Obtained 3D vein structure back-projected into two imaging planes.
The distribution of back-projection errors is shown in Fig. 15. The mean back-projection errors for the 3D reconstructed veins in the left and right views show the back-projection errors produced in the binocular view system. The back-projection errors for 75% of matched points are less than one pixel. The maximum back-projection errors for the Fig. 14(e1, f1), (e4, f4) and (e5, f5) are less than one pixel. Even the end of the opisthenar does not satisfy the hypothesis of planes for Fig. 14(e2, f2) and (e3, f3), the maximum back-projection errors are less than two pixels. Thus, the proposed vein matching method is proved to be accurate.
Fig. 15.

Back-projection error of vein center lines.
4.3. Distance error of feature points
2D image processing software CorelDraw is used to automatically measure the distances between different feature points in the simulated vein image, which are indicated as standard distances. Meanwhile, 3D point cloud processing software MeshLab is used to manually measure the corresponding distances between feature points in 3D point clouds, which are as reconstructed distances. The bifurcation points of veins are selected as feature points. Distances between corresponding feature points in 3D space and 2D image are shown in Fig. 16.
Fig. 16.

Measurement for distance between corresponding feature points in 3D space and 2D image. (a) distance between feature points in 3D point clouds; (b) distance between feature points in the simulated vein image.
Nine simulated vein images are designed to evaluate the distance error. 10 distance error distribution are measured for each image and shown in Fig. 17. In Fig. 17, all the mean distance errors are less than 1mm, and 75% distance errors are less than 1.5mm.
Fig. 17.

Distance errors of vein feature points for nine simulated vein images.
4.4. Duration times
The completion augmented reality imaging is implemented on single-core single-thread Intel(R) Core(Tm) i7-4720HQ CPU @ 2.6GHz. The mean times of augmented reality back-projection across all 50 trials is 579ms. Figure 18 shows the comparison of duration times with [12] for real-time capability based steps, including vein segmentation, 3D vein reconstruction and vein back-projection. The real-time back-projection overcomes the latency between a movement of the patient hand and the projected vein image updating to reflect that movement. And it effectively assists doctors for locating the injection veins. On the other hand, the projector resolution is of 1280 × 720. Eleven (i.e. ⌈log2 (1280)⌉) Gray coded images are required to label each projector column and ten (i.e. ⌈log2 (780)⌉) for each projector row. This is a total of 21 images which would require 6.7s to acquire on 3D skin reconstruction. The visualization of fusion display takes only 116ms. Thus, 3D fusion display is total 6.81s, which gives intuitive guidance for vein depth below the skin surface and not real-time.
Fig. 18.

Comparison of duration times for each real-time step.
4.5. Accuracy of skin reconstruction
The main parameters of the 3D reconstruction of skin surface include structure light encoding parameter (PixelsPerCode) and decoding threshold (Th). The PixelsPerCode determines the encoding spatial resolution. Large PixelsPerCode indicates that a single code value corresponds to a large area, spatial encoding is sparse, and skin point cloud is also sparse. By contrast, excessive dense spatial encoding may cause encoding error caused by limited camera resolution. Experimentally, PixelsPerCode=2 by considering the projection-range/resolution of the system and the imaging-range/resolution of the cameras. Around 6000 points are rebuilt for the dorsum of the hand. Th is varied and related to brightness of the projector, gray scale of projection images, camera exposure time, and camera gain. We set Th=50 to suppress noise interference.
The accuracy of skin reconstruction is evaluated by analyzing the 3D reconstruction of structure light with space plane measurement method. The 3D reconstruction of a plane is shown in Fig. 19, including flat top and plane side views. Gray code-based 3D reconstruction of structure light is evidently effective for reconstructing of space plane.
Fig. 19.

3D reconstruction of a plane. (a) flat top view; (b) plane side view.
Meanwhile, the relationship between the precision of structure light reconstruction and the plane dip angle is investigated and shown in Fig. 20. The precision of point cloud reconstruction is less than 0.25mm using Gray code-based 3D reconstruction of structure light. Meanwhile, the precision of point cloud decreases with increasing plane dip angle.
Fig. 20.

Relationship between the plane dip angle (0°10°20°30°) and the reconstruction precision of structure light.
4.6. Augmented display
Figure 21 shows four sets of back-projection results of testers by using IAS. The first row in Fig. 21 shows four real subcutaneous veins. The veins are difficult to be identified by eyes. The corresponding back-projection images are shown in the second row in Fig. 21. It is obvious that IAS can find and back project the reconstructed structures into the skin surface to enhance the veins, which effectively assists doctors for locating the injection veins. Three practitioners are employed to evaluate with real veins. According to the opinions of the practitioners, IAS has a superior and fast imaging. Based on the calibration process of the cameras and projector, the 3D reconstructions of veins and skin surface are projected into the same coordinate on the basis of the system calibration parameters. The 3D rendering and fusion display of the subcutaneous veins and skin surface are shown in the last four rows in Fig. 21.
Fig. 21.

Back-projection of the real subcutaneous veins. The first row shows four real subcutaneous veins; the second row shows the corresponding back-projection images; the last four rows are the 3D rendering and fusion display of the subcutaneous veins and skin surface.
5. Conclusion and discussion
We have presented a novel 3D reconstruction and fast imaging system for subcutaneous veins by augmented reality. This study is performed to reduce the failure rate and time required for intravenous injection by providing augmented vein structures that are back-projected and superposed on the skin surface of the hand. IAS is not going through the costly and time-consuming process of alignment between the real veins and the back-projected images. Meanwhile, an early evidence of the potential to improve clinical efficacy is provided by giving the fusion display of vein depth below the skin surface. The subcutaneous vein is captured by two industrial cameras with extra reflective NIR lights. A local adaptive subcutaneous vein segmentation method based on multiple feature clustering was proposed to overcome the problems of inaccurate segmentation in bifurcations and tails of veins. The proposed segmentation method provides better peripheral veins, bifurcation structures, and vein edges than those obtained through the Gaussian-matched filter method. Afterwards, the vein structures that are captured in the two cameras are matched and reconstructed based on a novel vein matching and 3D reconstruction method, and back-projected on the skin surface. It overcomes the matching problems caused by the incomplete structure of vein segmentation and asymmetric structures of veins in the left and right views based on the epipolar constraint and homographic property. The skin surface is reconstructed using active structured light with spatial encoding values and fusion displayed with the reconstructed vein. The 3D reconstruction of the skin is designed to limit the reconstruction error within 0.25 mm. The system implements time-sharing multiplex between NIR and visible imaging to reduce the number of required cameras by utilizing the spectral response characteristics of cameras. The system performance has been evaluated with regard to real vein segmentation, vein matching accuracy, distance error of feature points, duration times, skin reconstruction accuracy, and augmented display. All experiments were validated with sets of real vein data. The construction system produced good 3D fusion display results for both subcutaneous veins and skin, even for imaging with low contrast and ambiguous borders. The developed IAS increases the success rate and efficiency of intravenous injection.
In future studies, reflection imaging will be replaced by transmission-reflection imaging using time switching to improve the image quality. Transmission imaging produces the major structure of the vein, while details of the vein structure and the dorsum of the hand are extracted using reflective imaging. Multi-thread will be employed to accelerate the speed of the system and achieves real-time 3D reconstruction of the skin. Furthermore, the intersection of veins will be investigated more intensively to enhance the details of images.
Acknowledgments
This work was supported by the National Basic Research Program of China (2013CB328806), the Key Projects in the National Science & Technology Pillar Program (2013BAI01B01), the National Hi-Tech Research and Development Program (2015AA043203), National Science Foundation Program of China (61527827, 61501030).
References and links
- 1.Deepa P., Mohanavelu K., Sundersheshu B.S., Padaki V.C., “Vein Identification and Localization for Automated Intravenous Drug Delivery System,” Volume 292 of the series Communications in Computer and Information Science, (2012), pp. 270–281. [Google Scholar]
- 2.Cuper N.J., Klaessens J.H., Jaspers J.E., de Roode R., Noordmans H.J., de Graaff J.C., Verdaasdonk R.M., “The use of near-infrared light for safe and effective visualization of subsurface blood vessels to facilitate blood withdrawal in children,” Med. Eng. Phys 35(4), 433–440 (2013). 10.1016/j.medengphy.2012.06.007 [DOI] [PubMed] [Google Scholar]
- 3.Delpy D., “Quantification in tissue near-infrared spectroscopy,” Philos Trans R Soc Lond B. 352(1354), 649–659 (1997). 10.1098/rstb.1997.0046 [DOI] [Google Scholar]
- 4.Zeman H.D., Lovhoiden G., Vrancken C., “Prototype vein contrast enhancer,” Proc. SPIE 5318, 39–49 (2004). 10.1117/12.517813 [DOI] [PubMed] [Google Scholar]
- 5. https://www.christiemed.com/products/veinviewer-models/veinviewer-vision
- 6.AccuVein AV400: The only handheld, non-contact vein illumination device, http://medidyne.dk/wp-content/uploads/ENG-accuvein-data-sheet.pdf
- 7.Chiao F.B., Resta-Flarer F., Lesser J., Ng J., Ganz A., Pino-Luey D., Bennett H., Perkins C., Jr, Witek B., “Vein visualization: patient characteristic factors and efficacy of a new infrared vein finder technology,” Brit. J. Anaesth 110(6), 966–971 (2013). 10.1093/bja/aet003 [DOI] [PubMed] [Google Scholar]
- 8.Perry T.S., “Veebot: Making a robot that can draw blood faster and more safely than a human can,” http://spectrum.ieee.org/robotics/medical-robots/profile-veebot (2013).
- 9.Brewer R.D., Salisbury J.K., “Visual Vein-Finding for Robotic IV Insertion,” IEEE International Conference on Robotics and Automation, (2010), pp. 4597–4602. [Google Scholar]
- 10.Veebot’s Robot Technician Draws Blood From Patients, With Higher Accuracy Rate, http://www.medicaldaily.com/veebots-robot-technician-draws-blood-patients-higher-accuracy-rate-video-248176
- 11.Nakamachi E., Morita Y., Mizuno Y., “Development of Automatic 3D Blood Vessel Search and Automatic Blood Sampling System by Using Hybrid Stereo-Autofocus Method,” International J. Opt. 2012, 258626 (2011). [DOI] [PubMed] [Google Scholar]
- 12.Chen A., Nikitczuk K., Nikitczuk J., Maguire T., Yarmush M., “Portable robot for autonomous venipuncture using 3D near infrared image guidance,” Technology (Singap World Sci) 01 (2013). [DOI] [PMC free article] [PubMed] [Google Scholar]
- 13.Paquit V.C., Tobin K.W., Price J.R., Mriaudeau F., “3D and multispectral imaging for subcutaneous veins detection,” Opt. Express 17(14), 11360–11365 (2009). 10.1364/OE.17.011360 [DOI] [PubMed] [Google Scholar]
- 14.Shahzad A., Naufal Mohamad Saad M., Walter N., Saeed Malik A., Meriaudeau F., “A review on subcutaneous veins localization using imaging techniques,” Curr. Med. Imaging Rev 10(2), 125–133 (2014). 10.2174/157340561002140715102953 [DOI] [Google Scholar]
- 15.Zhou M., Wu Z., Chen D., Zhou Y., “An improved vein image segmentation algorithm based on SLIC and Niblack threshold method,” Proc. SPIE 9045, 90450D (2013). 10.1117/12.2037345 [DOI] [Google Scholar]
- 16.Zhou L., Rzeszotarski M.S., Singerman L.J., Chokreff J.M., “The detection and quantification of retinopathy using digital angiograms,” IEEE Trans. Med. Imaging 13(14), 619–626, (1994). 10.1109/42.363106 [DOI] [PubMed] [Google Scholar]
- 17.Miura N., Nagasaka A., Miyatake T., “Feature extraction of finger-vein patterns based on repeated line tracking and its application to personal identification,” Mach. Vision Appl. 15(4), 194–203 (2004). 10.1007/s00138-004-0149-2 [DOI] [Google Scholar]
- 18.Vlachos M., Dermatas E., “Vein segmentation in infrared images using compound enhancing and crisp clustering,” Volume 5008 of the series Lecture Notes in Computer Science, (2008) pp. 393–402.
- 19.Vlachos M., Dermatas E., “Supervised and unsupervised finger vein segmentation in infrared images using KNN and NNCA clustering algorithms,” XII Mediterranean Conference on Medical and Biological Engineering and Computing (2010), pp. 741–744. [Google Scholar]
- 20.Yang J., Yang J., “Multi-channel gabor filter design for finger-vein image enhancement,” Fifth International Conference on Image and Graphics (2009), pp. 87–91. [Google Scholar]
- 21.Zhao Y., Rada L., Chen K., Harding S.P., Zheng Y., “Automated Vessel Segmentation Using Infinite Perimeter Active Contour Model with Hybrid Region Information with Application to Retina Images,” IEEE Trans. Med. Imaging 34(9), 1797–1807 (2015). 10.1109/TMI.2015.2409024 [DOI] [PubMed] [Google Scholar]
- 22.Zhao Y., Liu Y., Wu X., Harding S.P., Zheng Y., “Retinal Vessel Segmentation: An Efficient Graph Cut Approach with Retinex and Local Phase,” PLoS ONE 10(4), e0122332 (2015). 10.1371/journal.pone.0122332 [DOI] [PMC free article] [PubMed] [Google Scholar]
- 23.Kang W., Deng F., “Vein Image Segmentation Based on Distribution Ratio of Directional Fields,” Acta Automatica Sinica 35, 1496–1502 (2009). 10.3724/SP.J.1004.2009.01496 [DOI] [Google Scholar]
- 24.Chen M.M., Guo S.X., Qian X.H., “Finger vein image segmentation based on an improved LBF active contour model,” J. Jilin University 41, 1171–1176 (2011). [Google Scholar]
- 25.Hu X., Zhou Y., Wu Z., “A 2.5 dimensional vein imaging system for venipuncture,” Proc. SPIE 8668, 86685A (2013). 10.1117/12.2006913 [DOI] [Google Scholar]
- 26.Cong W.J., Yang J., Ai D.N., Chen Y., Liu Y., Wang Y.T., “Quantitative Analysis of Deformable Model-Based 3-D Reconstruction of Coronary Artery From Multiple Angiograms,” IEEE Trans. Biomed. Eng. 62(8), 2079–2090 (2015). 10.1109/TBME.2015.2408633 [DOI] [PubMed] [Google Scholar]
- 27.Yang J., Cong W.J., Chen Y., Fan J.F., Liu Y., Wang Y.T., “External force back-projective composition and globally deformable optimization for 3-D coronary artery reconstruction,” Phys. Med. Biol. 59(4), 975–1003 (2014). 10.1088/0031-9155/59/4/975 [DOI] [PubMed] [Google Scholar]
- 28.Paquit V.C., Meriaudeau F., Price J.R., Tobin K.W., “Simulation of skin reflectance images using 3D tissue modeling and multispectral Monte Carlo light propagation,” 30th Annual International Conference of the IEEE Engineering in Medicine and Biology Society (2008), 447–450. [DOI] [PubMed] [Google Scholar]
- 29.Zhang Z., “A Flexible New Technique for Camera Calibration,” IEEE Trans. Pattern Anal. 22(11), 1330–1334 (2000). 10.1109/34.888718 [DOI] [Google Scholar]
- 30.Shoujun Z., Jian Y., Yongtian W., Wufan C., “Automatic segmentation of coronary angiograms based on fuzzy inferring and probabilistic tracking,” Biomed. Eng. Online 9, 40 (2010). 10.1186/1475-925X-9-40 [DOI] [PMC free article] [PubMed] [Google Scholar]
- 31.Bankhead P., Scholfield C. N., McGeown J. G., Curtis T. M., “Fast retinal vessel detection and measurement using wavelets and edge location refinement,” PloS One 7, e32435 (2012). 10.1371/journal.pone.0032435 [DOI] [PMC free article] [PubMed] [Google Scholar]
- 32.Friman O., Hindennach M., Khnel C., Peitgen H. O., “Multiple hypothesis template tracking of small 3D vessel structures,” Med. Image Anal. 14(2), 160–171 (2010). 10.1016/j.media.2009.12.003 [DOI] [PubMed] [Google Scholar]
- 33.Bay H., Tuytelaars T., Van Gool L., “Surf: Speeded up robust features,” 9th European Conference on Computer Vision (2006), pp. 404–417. [Google Scholar]
- 34.Al-Rawi M., Qutaishat M., Arrar M., “An improved matched filter for blood vessel detection of digital retinal images,” Comput. Biol. Med 37, 262–267 (2007). 10.1016/j.compbiomed.2006.03.003 [DOI] [PubMed] [Google Scholar]