Abstract
Accurate monitoring of blood oxy-saturation level (SO2) in human breast tissues is clinically important for predicting and evaluating possible tumor growth at the site. In this work, four different non-invasive frequency-domain photoacoustic (PA) imaging modalities were compared for their absolute SO2 characterization capability using an in-vitro sheep blood circulation system. Among different PA modes, a new WM-DPAR imaging modality could estimate the SO2 with great accuracy when compared to a commercial blood gas analyzer. The developed WM-DPARI theory was further validated by constructing SO2 tomographic images of a blood-containing plastisol phantom.
OCIS codes: (140.3298) Laser beam combining, (170.0110) Imaging systems, (170.1470) Blood or tissue constituent monitoring, (170.2655) Functional monitoring and imaging
1. Introduction
In the field of medical diagnostics and monitoring for human breast carcinogenesis, development of non-invasive optical modalities that can potentially replace current imaging techniques, such as ultrasound and magnetic resonance imaging (MRI), has been the subject of interest for many years. Among many potential alternatives, biomedical photoacoustic (PA) imaging is a non-invasive hybrid optical-ultrasonic modality which can evaluate quantitative functional information of tissues based on tissue specific optical properties [1, 2]. Biomedical PA utilizes non-ionizing NIR (near-infrared; 700-1000 nm) radiation to generate the corresponding acoustic pressure response from deep light-absorbing tissue chromophores, and takes advantage of the outstanding contrast of purely optical imaging and sub-mm spatial resolution of ultrasound imaging at the same time [1, 2].
It is widely accepted that tissue or blood oxygen saturation level (SO2) is one of the most important breast carcinogenesis benchmarks as it is closely associated with physiological activities of breast tumors such as growth rate, invasiveness, and even resistance to neoadjuvant therapies [3]. Many studies suggest that local decrease in SO2 (hypoxia) can forecast the possible tumor development at that specific site in the breast before any angiogenic, structural or biochemical indications are apparent [3–5]. However, those independent studies, that utilized today’s golden standard methodologies for SO2 characterization such as Diffuse Optical Spectroscopy (DOS) and Optical Mammography (OM), exhibited severe conflicts in their quantitative SO2 results for different stages of breast tumor (benign, pre-malignant, or malignant) [6–9]. While human breast optical properties could vary considerably by a number of factors such as menopausal status, age or even ethnic origin of patients, it clearly appears that today’s modalities, in general, are limited to some degree in accurately quantifying SO2 in human breast [10, 11].
At the Center for Advanced Diffusion Wave Technologies, University of Toronto, the potential of wavelength-modulated differential photoacoustic spectroscopy (WM-DPAS) for sensitive SO2 monitoring has been thoroughly studied and reported [12, 13]. Rather than using a single wavelength optical source, the WM-DPAS system utilizes two continuous-wave (CW) lasers of different wavelengths where two single frequency waveforms are modulated with 180° degree phase difference (out-of-phase). The two wavelengths are carefully chosen based on the human hemoglobin (Hb) absorption spectrum, so that oxy- and deoxy- Hb extinction coefficients show noticeable difference at the first wavelength (680 nm) while overlapping at the other wavelength (808 nm; isosbestic point). Therefore, the WM-DPAS methodology can efficiently suppress undesired background absorptions while amplifying the small Hb-specific PA signals [12, 13]. In the studied in-vitro model, the sensitivity of the differential PA signal to small changes in sheep SO2 was shown to be better by about 160 fold than other existing non-invasive SO2 quantification modalities [13]. However, use of single frequency modulation lacks depth-resolved information of the target, therefore WM-DPAS is not suitable for imaging purposes. In this study, a new wavelength-modulated differential PA radar imager (WM-DPARI) is introduced. It uses frequency-swept (chirped) optical excitation and frequency-domain signal processing. It enables quantitative depth-resolved SO2 imaging with sub-mm spatial resolution and improved contrast, sensitivity and Hb-specificity over the previous WM-DPAS system [12, 13].
Using the principles of frequency-domain PA, absolute SO2 imaging and monitoring may be achieved in several PA modes. While single-ended PA amplitude or phase signals may provide useful functional information of the tumor, multiple wavelengths can be employed simultaneously so as to improve the accuracy and reliability of the measurement. By comparing these typical PA modes theoretically and experimentally, this study demonstrates that the WM-DPARI modality performs better and shows higher accuracy than its PA counterparts for absolute SO2 characterization. The WM-DPARI modality was further employed to generate quantitative SO2 images of in-vitro sheep blood contained inside a polyvinyl chloride-plastisol (PVCP) phantom.
2. Theoretical background
This section provides the theoretical background of four different frequency-domain PA methodologies that can be used for absolute SO2 characterization and imaging. While the detailed derivation of the Fourier-Domain PA signal generation was covered elsewhere [14, 15], a simple proportionality of the PA amplitude can be described as:
| (1) |
where μa is the absorption coefficient (cm−1) of the light absorber (blood in this study), Γ is the Grüneisen coefficient which represents the efficiency of thermo-elastic excitation and Φ is the laser intensity (W/cm2). The Grüneisen coefficient is assumed to be constant throughout the measurements under one specific experimental set-up, therefore, from Eq. (1), the PA signal normalized by Φ is directly proportional to μa. In blood, Hb is the dominant light absorber [12]. Therefore, the absorption coefficient of blood is represented as:
| (2) |
where C is the concentration of oxy- or deoxy-Hb, and ɛ is the molar extinction coefficient (mM−1·cm−1) of oxy- or deoxy-Hb at the specific wavelength (λ). Equation (2) can be transformed to Eq. (3) so that it expresses μa in terms of SO2 instead of the Hb concentration.
| (3) |
where CHb is the total Hb concentration, equal to the sum of Cox and Cde. Therefore, SO2 can be defined as Cox/CHb = Cox/(Cox + Cde).
For the depth-resolved PA image reconstruction using CW lasers, a frequency-swept optical excitation is employed where its bandwidth is selected based on the center frequency of the PA signal detector, a piezoelectric transducer. Received PA chirp is then processed with the reference input chirp for pulse compression and matched filtering. Such signal processing increases the signal-to-noise ratio (SNR) by several orders of magnitude and provides the depth information of the chromophores in a way similar to radar systems.
2.1 Two-wavelength single-ended amplitude imaging
Combining Eqs. (1) and (3), the relationship between two single-ended measurements (680 nm and 808 nm) and SO2 can be represented as:
| (4) |
If is denoted by R, then Eq. (4) can be solved for SO2 in terms of the two single-ended PA signals as the factor of PA proportionality at each wavelength is canceled out.
| (5) |
This methodology can directly estimate absolute SO2 from the two single-ended PA signals. Since it utilizes the ratio of two signals, this method is free from any effects caused by wavelength-independent parameters such as local CHb variation and the system transfer function. However, for this approach to be reliable, the received raw PA signals need to be carefully normalized by individual laser peak intensities. The fact that the Gaussian shape beam profiles of different lasers are not necessarily similar makes such normalization process difficult and unreliable.
2.2 Two-wavelength single-ended phase imaging
This methodology where two single-ended PA phase signals are used to estimate SO2 was studied theoretically and experimentally elsewhere [15]. The idea was that the Hb absorption coefficient difference between two wavelengths is proportional to the difference in the two single-ended PA phase signals at the corresponding wavelengths as shown in Eq. (6) [15].
| (6) |
where Ɵ is the phase signal in degrees at the delay time τ, fc is the center frequency of the modulation chirp, Bch is the frequency bandwidth of the chirp, and Ca is the speed of sound in soft tissue (ca. 1500 m/s). Since it utilizes the phase signal instead of the amplitude, this method does not assume uniform fluence in tissue when it comes to in-vivo measurements.
Even though this approach showed great accuracy in estimating SO2 in a 1-D in-vitro model, the fact that the phase signal is extremely sensitive to the surface geometry of the absorber makes this method alone not ideal for in-vivo SO2 imaging in heterogeneous tissues such as the human breast.
2.3 Two-wavelength differential amplitude imaging (WM-DPARI)
Wavelength modulated differential PA provides many advantages compared to its single-ended counterparts when it comes to in-vivo imaging targeting Hb. By modulating two wavelengths (680 nm and 808 nm) out-of-phase, undesired system noise and background absorptions are highly suppressed at all frequencies, but the specific PA signals from Hb are amplified, increasing signal-to-noise ratio (SNR) and the dynamic reserve of the image. By developing Eq. (2) further, the differential PA signal can be represented as:
| (7) |
where k is the system constant which is determined by the amplitude ratio (A680/A808) and phase difference (P680 – P808) between the two lasers. However, finding the experimental k value is difficult unless μa680 and μa808 at the reference blood sample are known. From Eq. (7), it is possible to find the proportionality between differential PA signal and the constant k, but in order to use this relative k, a second calibration is required. Therefore, to avoid the second calibration, the differential PA signals from the samples need to be processed relative to the reference differential PA signal so that the effect of constant k is eliminated. The terms Cox and Cde in Eq. (7) can be converted in terms of SO2 as shown in Eq. (3), and the raw differential signals are processed relative to the reference differential PA signal, PAdiff(ref), to eliminate the k effects. When η is the constant which includes all other system constants such as the factor of PA proportionality and the transducer transfer function, the expression can be simplified as follows:
| (8) |
where
From Eq. (8), the unknown SO2 can be directly estimated from the raw differential PA signal with one reference sample calibration where η is experimentally obtained and CHb is assumed to be constant. In practice, this reference can be any sample near the imaging area of interest with higher SO2 than the hypoxic tumor. At the isosbestic point, α becomes 0 and Eq. (8) can be further simplified. While this mode enjoys improved sensitivity and Hb-specificity with great noise reduction, it is dependent on the local CHb variation unlike the previous single-ended approach in section 2.1. Therefore, an error reflecting the possible CHb variation (if any) needs to be introduced when estimating the absolute SO2 using this mode.
2.4 Three-wavelength differential amplitude imaging
Assuming that the Hb absorption coefficient at a third wavelength is known, employing the third wavelength should provide more accuracy and reliability in characterizing absolute SO2. Three wavelengths can be used for two independent two-wavelength differential measurements. Each differential signal can be represented as Eq. (7) and theoretically the two equations can be solved for individual Cox and Cde, and thus for SO2. As mentioned in the previous paragraph, however, finding the exact k value requires an extra amount of work for measuring absorption coefficient of the reference sample at the corresponding wavelengths. Unfortunately, in the three-wavelength differential PA mode, unlike the two-wavelength differential mode discussed in section 2.3, there is no way to process the signals in a way that the k effect is eliminated, therefore, relative k should be used for absolute CHb-independent SO2 estimation. This requires two samples to calibrate the system; one sample with high and the other one with low SO2. In an in-vivo setting for tumor detection, it is relatively easy to calibrate the system for the oxy- sample because the surrounding healthy tissues have higher SO2 than the tumor, but it is particularly difficult to calibrate for the deoxy-sample.
3. Experimental set-up
3.1 Instrumentation
For two-wavelength single-ended and differential experiments, two CW lasers with λ = 680 nm (LDX-3230-680, RPMC, MO, USA) and λ = 808 nm (JOLD-7-BAFCM-12, RPMC, MO, USA) were used. Both lasers were integrated with the customized drivers (MESSTEC, BY, DE). Both drivers were modulated by a dual-channel function generator (33522B, Agilent, CA, USA) and synchronized with the trigger from a National Instruments (NI) card. The two laser beams were modulated by a chirp waveform in the range 300 kHz–3 MHz with 180-degree phase difference. The radar approach (chirp modulation, followed by pulse compression and matched filtering) is necessary for producing depth-resolved differential PA spectroscopic images. The two lasers were combined into a single beam using a customized wavelength coupler (WDM-680/810, OZ Optics, Ottawa, ON, CA) and collimated into ~1 mm diameter by the collimator (F230SMA-B, Thorlabs, NJ, USA). The generated PA signals were picked up by a single-element 3.5 MHz unfocused transducer (C383, Olympus Panametrics, CA, USA) and amplified by 40 dB (5662, Olympus Panametrics, CA, USA). Data acquisition and signal processing were controlled by the NI card (NI PXIe-5122, TX, USA) and locally-developed Labview software. For the three-wavelength differential system, one extra CW laser with λ = 1064 nm (IPG Photonics, MA, USA) was employed in the same way as the 680 nm laser, but modulated by an AOM (97-02855-51, Gooch&Housego, CA, USA).
For the imaging system, as the sample was located at the center of the imaging tank, the transducer and the lasers together were rotated 360-degrees around the sample with 1-degree resolution by the stepper motor to obtain a full tomographic cross-sectional image of the sample. The motor controller system was also locally programmed using Labview.
3.2 Sample preparation and blood deoxygenation
The blood circulation system which mimics the human vasculature system was built in-house as shown in Fig. 1. While the details of the system assembly are described elsewhere [13], it can circulate heparinized sheep blood (CL2581-500H, Cederlane, ON, CA) using a peristaltic pump (5201, Heidolph, BY, DE) at 15 rpm for several hours without having any coagulation within the tube. A flat plastic flow cell (CFCAS0004, IBI Scientific, IA, USA) was added to the circulation system to provide the flat measurement window. Without disrupting the blood flow, blood deoxygenation was achieved using sodium dithionite (Sigma-Aldrich, MO, USA) based on the published protocol [13, 16]. After the addition of sodium dithionite, a 10-minute stabilization time was allowed to ensure blood homogeneity.
Fig. 1.
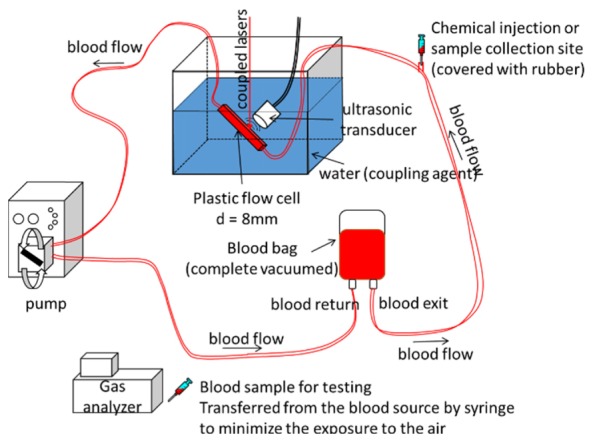
Schematic diagram of the blood circulation system. This system is isolated from the air to prevent any blood coagulation during the experiment.
For the imaging experiment, a polyvinyl chloride-plastisol (M-F Manufacturing Co., TX, USA) phantom was prepared with three identical holes with 2.5 mm diameters. Each hole was filled with pre-made heparinized sheep blood of different SO2. The degree of deoxygenation was varied in two different experiments (one in the 91.4-84.0% and the other in the 91.3-87.2% range) to assess the sensitivity of the system. Once the blood was loaded in each hole, the holes were blocked by screw caps to prevent blood exposure to air. This ensured constant SO2 of the blood samples in each set of tomographic measurements (<20 minutes).
The SO2 and CHb of every blood sample tested were confirmed using a commercial blood gas analyzer (CCA-TS, OPTImedical, GA, USA). This analyzer uses a cassette and accurately measures SO2 and CHb with 0.1% and 0.1 g/dL resolution, respectively. Therefore, it provides a reliable comparison and validation for the experimental SO2 estimation (Figs. 1 and 2).
Fig. 2.
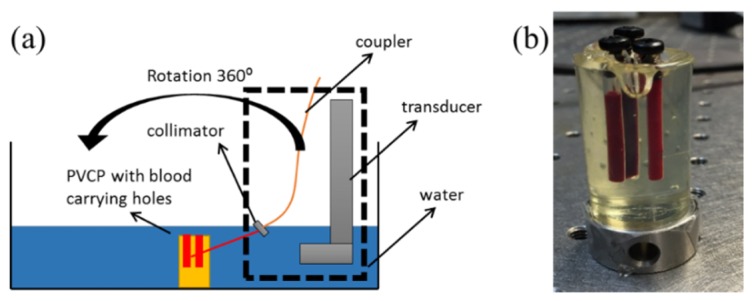
(a) Schematic diagram of the WM-DPARI system. The sample was fixed at the center while other components rotated around to obtain cross-sectional images. (b) PVCP sample containing blood with variable SO2.
4. Results and discussion
The distinct molecular extinction coefficient values of sheep oxy- and deoxy- Hb in the NIR region were widely available up to 1000 nm. Therefore, those values at 680 nm and 808 nm could be easily obtained from previous studies as: ɛox(680) = 0.131, ɛde(680) = 0.674, ɛox(808) = 0.234 and ɛde(808) = 0.220 mM−1·cm−1 [17]. However, the extinction coefficients at 1064 nm were extrapolated to be ɛox(1064) = 0.205 and ɛde(1064) = 0.015 mM−1·cm−1 [17].
4.1 Experimental comparison of different PA modes in an in-vitro blood circulating system
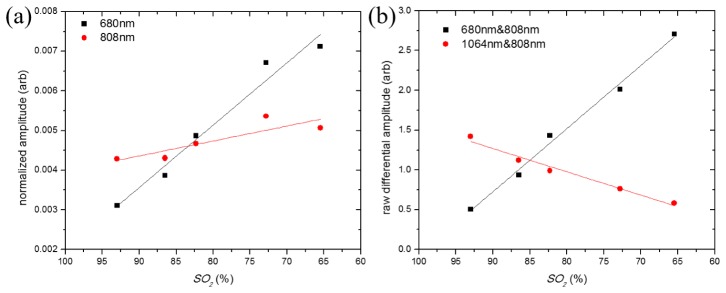
As expected, in Fig. 3(a), the degree of PA amplitude changes at 808 nm, near the isosbestic point (~802 nm for sheep blood [17]), is much smaller compared to that at 680 nm. The single-ended PA signal from the 808 nm laser was expected to stay relatively constant in the studied range of SO2, but it increases slightly instead. This can be explained by the system variation over time since both single-ended signals showed same the deviation pattern from the individual best fits. As shown in Eq. (4), in the two-wavelength single-ended mode, such a variation effect is cancelled out from each wavelength and only the relative amplitude between the two signals is considered when calculating absolute SO2.
Fig. 3.
(a) normalized PA amplitude of single-ended signals for decreasing SO2. (b) raw differential PA amplitude signals of the two pair differential system for decreasing SO2. Each data point was obtained from 200 signal averages. Lines are the linear best fits for each set of data points.
For the two-wavelength single-ended method, the relative beam size of the 680 nm laser to the 808 nm laser was estimated using their molar extinction coefficient relationship on the reference sample (one with the highest SO2) since accurate beam profiles of the lasers could not be obtained easily. While the laser powers were 424 mW and 435 mW at 680 nm and 808 nm, respectively, the relative beam size of the 680 nm laser was calculated to be around 0.718 cm−1 while that of the 808 nm laser was assumed to be 1 cm−1. The estimated absolute SO2 is tabulated in Table 1 and compared with the values from the blood gas analyzer. It is seen that the two-wavelength single-ended method estimated in-vitro SO2 with less than 4.28% error over the range of this study.
Table 1. The measured absolute blood SO2 from three different PA modes.
| Blood sample | Blood gas analyzer SO2 (%) | Two-wavelength single-ended PA with error % | Two-wavelength differential PA with error %a |
Three-wavelength differential PA with error % |
|---|---|---|---|---|
| 1 | 93 | 93 (ref.) | 93 (ref.) – 93 (ref.) | 93 (ref.) |
| 2 | 86.5 | 85.74 (0.87) | 86.75 (0.29) – 87.22 (0.83) | 85.63 (1.00) |
| 3 | 82.3 | 79.73 (3.13) | 79.55 (3.34) – 80.57 (2.10) | 78.86 (4.18) |
| 4 | 72.8 | 71.07 (2.38) | 71.06 (2.39) – 72.72 (0.11) | 70.14 (3.65) |
| 5 | 62.2 | 64.86 (4.28) | 60.94 (2.03) – 63.36 (1.86) | 62.2 (ref.) |
CHb values of 93% SO2 and 62.2% SO2 blood samples (1.923 mM and 2.070 mM, respectively) were used to obtain the range of the estimated absolute SO2 that consider the possible local CHb variation.
In Fig. 3(b), it is shown that both differential pairs exhibit a linear relationship with SO2. However, comparing to 680&808 pair, the 1064&808 differential signal is less sensitive to the SO2 change. This makes sense because the molar extinction coefficient of oxy- and deoxy- Hb at 1064 nm is smaller than those at 680 nm. For the three-wavelength differential system which utilizes two independent differential measurements, relative k values for each pair were calculated as −0.22 (680&808) and −1.83 (1064&808) at the first reference sample with 93% SO2. Then using Eq. (7) for each differential pair, un-normalized SO2 values were obtained by finding Cox and Cde. These SO2 values from the relative k constant could be eventually normalized using the second reference sample with 62.2% SO2 (mostly deoxygenated sample). As shown in Table 1, this three-wavelength differential method underestimated SO2 over the full range of study.
The differential PA amplitude signal, obtained by modulating the 680 nm and 808 nm lasers out-of-phase, showed strong linearity with SO2 as shown in Fig. 3(b). As discussed in the theoretical part, in the two-wavelength differential method which is the principle of WM-DPARI, raw differential data can be directly used to estimate SO2 using Eq. (8) with great sensitivity and Hb-specificity. Similar to the previous two-wavelength single-ended method, the mostly oxygenated sample with 93% SO2 (1.923 mM CHb) was used as a reference and experimental η was obtained to be 5.11. Even though a constant CHb was assumed over the full range of SO2, from Fig. 4 and Table 1, it is shown that the two-wavelength differential method gives smaller errors than the CHb-independent methods when compared to the blood gas analyzer. To assess the SO2 degree of dependence on local CHb variation, the CHb value of the blood sample with the lowest SO2 (62.2%) was obtained from the blood gas analyzer as 2.070 mM, and used for the estimation. Even when the full range of CHb variation was considered, the two-wavelength differential system exhibited the best accuracy in terms of quantifying SO2 among studied PA modalities when compared to the commercial blood gas analyzer.
Fig. 4.
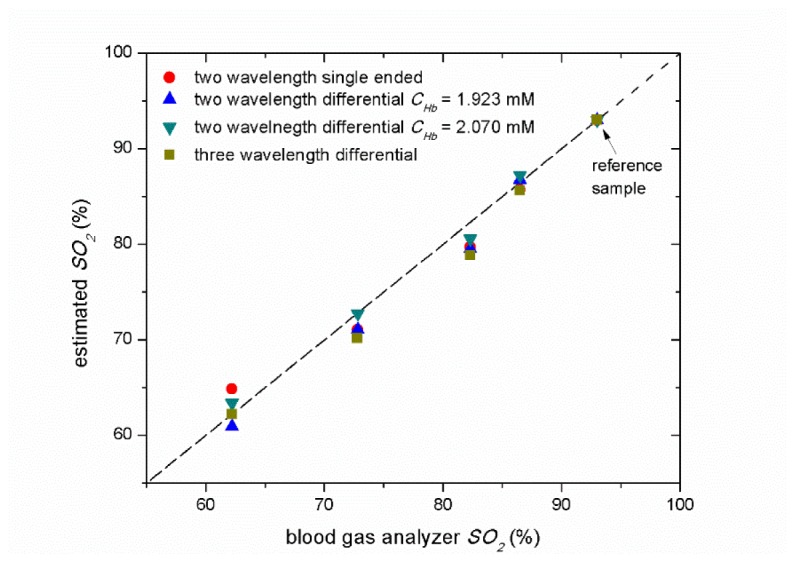
Measured absolute SO2 from various PA modes. For the two-wavelength differential system, the CHb of the 93% sample (mostly oxygenated) and the 62% sample (mostly deoxygenated) were used for sample calibration to show the CHb effect on SO2 estimation. Estimated values were compared to SO2 obtained from the commercial blood gas analyzer. Each data point was obtained from 200 signal averages.
Figure 4 is the graphic representation of Table 1, summarizing how the estimated SO2 values from the various PA modes match the values from the blood gas analyzer. It is shown that the studied PA modes generally underestimated SO2 over the entire range. All measurement modes required at least one sample calibration with the mostly oxygenated sample. Since these measurements were taken from a rather ideal in-vitro set-up with a flat measurement window, the values from different modes match well, with small differences. However, with improved sensitivity and specificity towards Hb, the differential method is expected to perform better than the single-ended method for SO2 quantification purposes in an in-vivo heterogeneous environment. Table 2 summarizes some pros/cons of each PA mode to determine their suitability for in-vivo accurate absolute SO2 quantification measurement. Considering a number of different aspects of the various PA modes, the two-wavelength differential PA mode shows the greatest potential to be used for in-vivo imaging of absolute SO2 as it has high sensitivity and specificity towards Hb while requiring only one sample calibration.
Table 2. Comparison of different PA modes for in-vivo SO2 quantification potential.
| PA mode | # of sample calibration needed | Sensitivity and specificity to blood in a heterogeneous in-vivo environment | Suited for in-vivo accurate SO2 measurement? |
|---|---|---|---|
| Two-wavelength single-ended amplitude | 1 | No | No |
| Two-wavelength single-ended phase | 1 | No | No |
|
Two-wavelength differential (WM-DPARI) |
1 | Yes | Yes |
| Three-wavelength differential | 2 | Yes | No |
4.2 SO2 imaging potential of the two-wavelength differential PA using breast mimicking PVCP phantoms
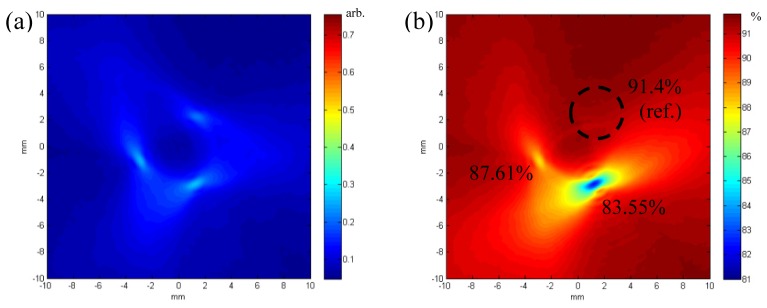
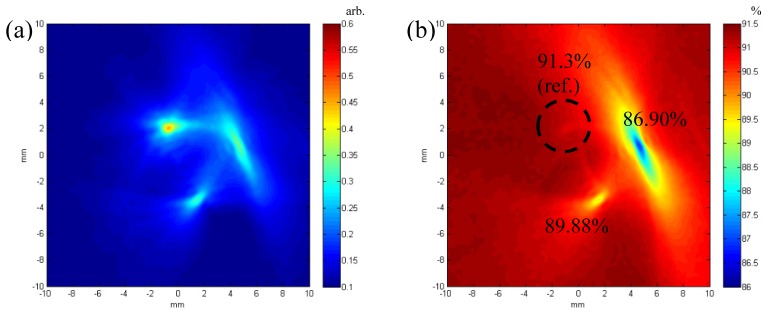
Table 2 shows that the two-wavelength differential PA mode fits best for in-vivo SO2 imaging purposes. Therefore, this method was developed further into the WM-DPARI system by generating an actual SO2 image of an in-vitro blood-containing PVCP phantom. As shown in Fig. 2(b), a PVCP phantom, which barely has any absorption at the wavelengths of this study, contains three blood samples with different SO2. The sample with the highest SO2 was used as a reference, therefore the corresponding differential signal was zeroed out in the images. Such an experiment was performed twice with different ranges of SO2; one from 91.4% to 84.0% with CHb = 1.737 mM and the other from 91.3% to 87.2% with CHb = 1.706 mM to assess the sensitivity of the system in different ranges. In each case, an experimental η was obtained to be 4.98 and 4.87, respectively. From the generated images, the location and the SO2 status of deoxygenated blood samples could be estimated with excellent accuracy. As shown in Figs. 5(b) and 6(b), the reference signal was highly suppressed as if there was no absorption at all, but the location was indicated by dashed circles based on the 808 nm single-ended amplitude image of the corresponding sample. Along with the reference samples, the backgrounds of Figs. 5(b) and 6(b) appear to be red as pseudo-oxygenated blood areas because their differential signals are all close to the zero baseline. This ensures the high sensitivity and superior specificity of the system to deoxygenated hemoglobin. As expected, in Figs. 5(a) and 6(a), three blood samples in each experiment showed relatively small change in amplitude because the extinction coefficient difference between oxy- and deoxy- Hb is small near the isosbestic point.
Fig. 5.
(a) 808 nm single-ended PA amplitude image. (b) 680 nm&808 nm WM-DPARI absolute SO2 image with CHb = 1.737 mM. The values from the blood gas analyzer were 91.4%, 87.5% and 84.0%.
Fig. 6.
(a) 808 nm single-ended PA amplitude image. (b) 680 nm&808 nm WM-DPARI absolute SO2 image with CHb = 1.706 mM. The values from the blood gas analyzer were 91.3%, 90.0% and 87.2%.
In both ranges shown in Figs. 5 and 6, the WM-DPARI method showed superior accuracy in terms of quantifying absolute sheep SO2. The estimated SO2 in each measurement is described in Table 3. The SO2 estimation error percentages here were much smaller than the previous one point measurement because it was a static system where no blood circulation was simulated. For the mostly deoxygenated blood sample in Fig. 6, the image was shown to be somewhat elongated while it was supposed to have circular shape. This distortion occurred because this sample was located too far (~6 mm) from the transducer rotation center. Such a distortion is an intrinsic problem of the full 360-degree tomography system where highly off-centered samples would experience unbalanced signal amplitude between their opposite sides due to the imaging depth differences. However, it should be emphasized that the distortion would not affect the quantitative SO2 results since the WM-DPARI measures the SO2 from the highest differential amplitude peak of the image which truly reflects the properties of the chromophores. Also, in potential clinical applications to breast tissue diagnosis, patients are expected to have ~90 – ~180-degree imaging arc scans, rather than full 360-degree tomography. In such cases, the distortion will be minimized.
Table 3. The measured absolute blood SO2 from an in-vitro PVCP image generated by the WM-DPARI method.
In the conducted study, the second wavelength of WM-DPARI, 808 nm, did not exactly match with the isosbestic point of sheep blood (~802 nm [17]). Therefore, the sensitivity and Hb-specificity of the WM-DPARI system are expected to improve even further with human blood which has its isosbestic point near 808 nm.
5. Summary
A wavelength-modulated differential photoacoustic radar imager (WM-DPARI) for potential in-vivo breast absolute SO2 characterization and monitoring was introduced both theoretically and experimentally. It was shown that the WM-DPARI system could use the raw differential signals to estimate various sheep SO2 concentrations in the range of 93.0% and 62.2% with less than 3.34% error from a human-vasculature-mimicking in-vitro blood circulation (dynamic) model when compared to the commercial blood gas analyzer. The WM-DPARI also successfully generated cross-sectional absolute SO2 images of an in-vitro blood-containing (static) PVCP phantom with less than 0.54% error when compared to the commercial blood gas analyzer. With enhanced sensitivity and specificity to hemoglobin, the WM-DPARI system can be used for accurate quantitative imaging of absolute SO2 in breast tissues for various clinical purposes.
Acknowledgment
AM is grateful to Natural Sciences and Engineering Research Council of Canada (NSERC) and Canadian Institutes of Health Research (CIHR) for a Collaborative Health Research Project (CHRP) grant. The support of the Canada Research Chairs Program is gratefully acknowledged.
References and links
- 1.Beard P., “Biomedical photoacoustic imaging,” Interface Focus 1(4), 602–631 (2011). 10.1098/rsfs.2011.0028 [DOI] [PMC free article] [PubMed] [Google Scholar]
- 2.Xu M., Wang L. V., “Photoacoustic imaging in biomedicine,” Rev. Sci. Instrum. 77(4), 041101 (2006). 10.1063/1.2195024 [DOI] [Google Scholar]
- 3.Anderson P. G., Kainerstorfer J. M., Sassaroli A., Krishnamurthy N., Homer M. J., Graham R. A., Fantini S., “Broadband optical Mammography: Chromophore Concentration And Hemoglobin Saturation Contrast in Breast Cancer,” PLoS One 10(3), e0117322 (2015), doi:. 10.1371/journal.pone.0117322 [DOI] [PMC free article] [PubMed] [Google Scholar]
- 4.Kondepati V. R., Heise H. M., Backhaus J., “Recent applications of near-infrared spectroscopy in cancer diagnosis and therapy,” Anal. Bioanal. Chem. 390(1), 125–139 (2008). 10.1007/s00216-007-1651-y [DOI] [PubMed] [Google Scholar]
- 5.van Veen R. L., Sterenborg H. J. C. M., Marinelli A. W. K. S., Menke-Pluymers M., “Intraoperatively assessed optical properties of malignant and healthy breast tissue used to determine the optimum wavelength of contrast for optical mammography,” J. Biomed. Opt. 9(6), 1129–1136 (2004). 10.1117/1.1803547 [DOI] [PubMed] [Google Scholar]
- 6.Shah N., Cerussi A. E., Jakubowski D., Hsiang D., Butler J., Tromberg B. J., “Spatial variations in optical and physiological properties of healthy breast tissue,” J. Biomed. Opt. 9(3), 534–540 (2004). 10.1117/1.1695560 [DOI] [PubMed] [Google Scholar]
- 7.Cerussi A. E., Berger A. J., Bevilacqua F., Shah N., Jakubowski D., Butler J., Holcombe R. F., Tromberg B. J., “Sources of absorption and scattering contrast for near-infrared optical mammography,” Acad. Radiol. 8(3), 211–218 (2001). 10.1016/S1076-6332(03)80529-9 [DOI] [PubMed] [Google Scholar]
- 8.Cheng X., Mao J. M., Bush R., Kopans D. B., Moore R. H., Chorlton M., “Breast cancer detection by mapping hemoglobin concentration and oxygen saturation,” Appl. Opt. 42(31), 6412–6421 (2003). 10.1364/AO.42.006412 [DOI] [PubMed] [Google Scholar]
- 9.Jakubowski D. B., Cerussi A. E., Bevilacqua F., Shah N., Hsiang D., Butler J., Tromberg B. J., “Monitoring neoadjuvant chemotherapy in breast cancer using quantitative diffuse optical spectroscopy: a case study,” J. Biomed. Opt. 9(1), 230–238 (2004). 10.1117/1.1629681 [DOI] [PubMed] [Google Scholar]
- 10.Campbell L. L., Polyak K., “Breast Tumor Heterogeneity: Cancer Stem Cells or Clonal Evolution?” Cell Cycle 6(19), 2332–2338 (2007). 10.4161/cc.6.19.4914 [DOI] [PubMed] [Google Scholar]
- 11.Polyak K., “Heterogeneity in breast cancer,” J. Clin. Invest. 121(10), 3786–3788 (2011). 10.1172/JCI60534 [DOI] [PMC free article] [PubMed] [Google Scholar]
- 12.Choi S.S. S., Mandelis A., Guo X., Lashkari B., Kellnberger S., Ntziachristos V., “Wavelength-modulated Differential Photoacoustic Spectroscopy (WM-DPAS): Theory of a High-sensitivity Methodology For The Detection of Early-stage Tumors In Tissue,” Int. J. Thermophys. 35(5), 1305–1311 (2014). [Google Scholar]
- 13.Choi S.S. S., Mandelis A., Guo X., Lashkari B., Kellnberger S., Ntziachristos V., “Wavelength-Modulated Differential Photoacoustic Spectroscopy (WM-DPAS) for noninvasive early cancer detection and tissue hypoxia monitoring,” J. Biophotonics 9(4), 388–395 (2016). 10.1002/jbio.201500131 [DOI] [PubMed] [Google Scholar]
- 14.Lashkari B., Mandelis A., “Comparison between pulsed laser and frequency-domain photoacoustic modalities: signal-to-noise ratio, contrast, resolution, and maximum depth detectivity,” Rev. Sci. Instrum. 82(9), 094903 (2011). 10.1063/1.3632117 [DOI] [PubMed] [Google Scholar]
- 15.Lashkari B., Choi S.S. S., Dovlo E., Dhody S., Mandelis A., “Frequency-Domain Photoacoustic Phase Spectroscopy: A Fluence-Independent Approach for Quantitative Probing of Hemoglobin Oxygen Saturation,” IEEE J. Sel. Top. Quantum Electron. 22(3), 6801010 (2016). 10.1109/JSTQE.2015.2494532 [DOI] [Google Scholar]
- 16.Briley-Sæbø K., Bjørnerud A., “Accurate de-oxygenation of ex-vivo whole blood using sodium dithionite,” Proc. Intl. Soc. Magn. Reson. Med. Sci. Meet. Exhib. 8, 2025 (2000). [Google Scholar]
- 17.Zijlstra W. G., Buursma A., van Assendelft O. W., Visible and Near Infrared Absorption Spectra of Human and Animal Haemoglobin: Determination and Application (VSP, 2000). [Google Scholar]


