Abstract
The “glucose-linked wavelength” in the short-wavelength near-infrared (NIR) region, in which the light intensity reflected from the hand palm exhibits a good correlation to the blood glucose value, was investigated. We performed 391 2-h carbohydrate tolerance tests (CTTs) using 34 participants and a glucose-linked wavelength was successfully observed in almost every CTT; however, this wavelength varied between CTTs even for the same person. The large resulting data set revealed the distribution of the informative wavelength. The blood glucose values were efficiently estimated by a simple linear regression with clinically acceptable accuracies. The result suggested the potential for constructing a personalized low-invasive blood glucose sensor using short-wavelength NIR spectroscopy.
OCIS codes: (170.3890) Medical optics instrumentation; (170.1470) Blood or tissue constituent monitoring; (300.6340) Spectroscopy, infrared; (300.1030) Absorption
1. Introduction
Diabetes is one of the most serious metabolic diseases worldwide and more than 380 million people suffered from it in 2013 [1]. Because diabetes increases the risk of the onset of many complicating diseases, such as heart disease, blindness, kidney failure, and nerve damage, diabetic patients require tight glycemic control by frequent monitoring of blood glucose levels to prevent or delay complications [2]. The prevalent self-monitoring of blood glucose (SMBG) methods require a finger-stick blood sample; therefore, the associated pain, distress, and test-strip costs have been major sources of concern for patients.
Recently, commercially available state-of-the-art continuous glucose monitoring systems (CGMSs) have been used; these systems require few daily calibrations and enable effective diabetic management. Most CGMSs are based on invasive techniques and employ a complex procedure to determine the glucose level in the interstitial fluid. The diabetic patient must be trained in the use of a CGMS and must change its invasive sensor every few days. The significantly high cost of a CGMS sensor, presently at approximately 78 USD for six days, restricts its routine use by diabetics [3].
Diabetes can be diagnosed based on glycated hemoglobin (HbA1c) criteria or plasma glucose criteria, using either the fasting-state or the 2-h value after a 75-g oral glucose tolerance test (OGTT) [2]. The OGTT is difficult for both patients and medical staff because of the time-consuming and frequent blood sampling. Although 2-h OGTT for non-diabetic people are required to determine the glycemic index (GI) of food [4], CGMSs are presently used only for diabetics. The GI is defined as the incremental area under the blood glucose response curve of a 50-g carbohydrate portion of a test food expressed as a percent of the response to the same amount of carbohydrate from a standard food taken by the same participant. The protocol of the GI determination is described in detail in the FAO publication [5]. The GI values provide valuable information for the selection of foods when controlling the postprandial glycemic level [6]. However, six or more healthy participants are required for a series of GI tests that include one test for each test food and at least three tests for the standard food, and the resulting GI values are averaged. For each GI test, seven finger-stick blood samples are needed.
Considering these circumstances, non- or low-invasive techniques for blood glucose measurements are still strongly desired. Various technologies have been studied for this purpose, such as optical spectroscopy, fluorescence spectroscopy, impedance spectroscopy, and electromagnetic sensing [7,8]. Among these, near-infrared (NIR) spectroscopy has received the most attention [9,10]; however, to our knowledge, no practical methods have yet been developed. The most serious problem regarding NIR technologies is weak glucose-specific absorption in the NIR region (700–2500 nm) owing to the low glucose concentration in blood and interstitial fluid. Moreover, stronger overlapping absorptions of other components in skin tissue hinder the development of an in vivo measurement technique. Finally, individual differences owing to the complexity of human biological tissues, environmental changes, such as those of temperature or humidity, and slight variations in the spectral measurement site or the contacting pressure to the probe could be major disturbance factors.
The NIR wavelength region is generally divided into two regions according to the absorption characteristics. In the long-wavelength NIR region (1300–2500 nm), absorptions attributed to the combinations or the first overtones of the OH, CH, and NH vibrations are mainly observed. These are stronger and sharper than the absorptions corresponding to the vibration of the second or third overtones, which are observed in the short-wavelength NIR region (700–1300 nm). The disadvantage of the long-wavelength region is the shallow penetration depth of the light, because of which major measuring sites examined in previous studies were probably interstitial fluid in the epidermis layer of the skin [11–13]. In the short-wavelength region, the well-known optical window between the visible absorption of hemoglobin and the NIR absorption of water can provide information from the deeper layers of the tissue [14–16].
Our previous studies demonstrated that individual calibration models can be successfully built for certain persons by applying partial least squares (PLS) regression [17] to the absorbance values in the short-wavelength NIR region [18,19]. Our most recent study suggested that the body mass index, which may affect the physical measurement conditions, was more effective for the development of a successful calibration model than the change of blood constituents [20]. Nevertheless, the individual calibration models were not successful for some persons because the structures of these models were too complicated to allow the identification of the causes of the failure.
In this study, we employed a simple approach. We used a large data set consisting of approximately 400 carbohydrate tolerance tests (CTTs) to investigate the presence of a direct correlation between blood glucose level and NIR absorbance at every wavelength for each individual over a limited period of time.
2. Materials and methods
2.1 Carbohydrate tolerance test (CTT)
A total of 34 healthy Japanese females (age: 20.7 ± 0.5; body mass index: 20.3 ± 1.8 kg/m2) participated in this study. Written informed consent was obtained from all participants and the study protocol was approved by the ethics committee of Kagawa Education Institute of Nutrition. For one CTT, the participants ate a meal containing 50 g carbohydrates in the morning after overnight fasting, and conventional invasive blood glucose measurements were conducted with a SMBG meter (GLUCOCARD GT-1830, ARKRAY, Inc., Kyoto, Japan) at 0 (fasting state), 15, 30, 45, 60, 90, and 120 min after the first bite of the meal. Each participant contributed at least six CTTs, resulting in a total of 391 CTTs.
2.2 NIR spectra measurement
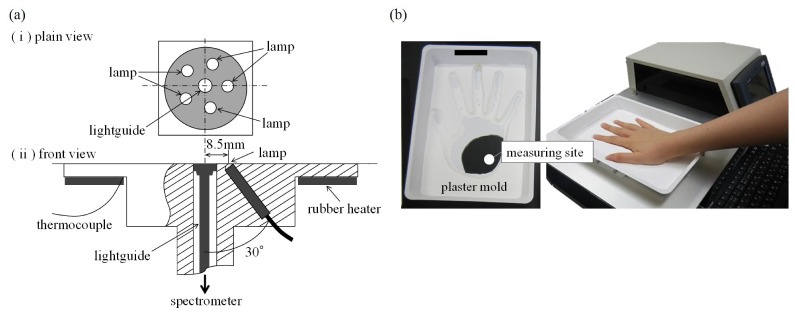
The acquisition of the NIR spectra (700–1050 nm, 1-nm intervals) of the right-hand palm of each participant was performed almost simultaneously with the SMBG measurements. The measuring site was determined based on our previous work [18]. The absorbance spectrum was obtained in 15 s as the average of 50 scans with an exposure time of 300 ms each. A polytetrafluoroethylene plate (ϕ = 40 mm, thickness 15 mm) was used as the reference material. The experimental instrument consisted of a light source, an NIR spectrophotometer (S-2930, Soma Optics, Ltd., Tokyo, Japan), a control unit (a touch-panel PC with Windows OS), and a temperature controller. The interactance probe was equipped with five small tungsten halogen lamps (1 W) placed in a circle with a radius of 8.5 mm and the light guide for the spectrometer was placed at the center of the circle (Fig. 1(a)). The probe detected the light that was diffusely reflected by the skin tissue. To control the temperature of the measurement site, a rubber heater was attached to the rear side of the probe. The temperature of the probe was maintained at 36.0 ± 0.1 °C before the beginning of the measurement; the basic structure of the instrument is the same as that of our previous paper [20]. In the current study, plaster molds of each participant’s hand were fabricated and used for every NIR measurement to prevent the displacement of the measuring site (Fig. 1(b)). Therefore, the participants were only restrained on the NIR instrument during the measurement of the spectra.
Fig. 1.
(a) Detail of the interactance probe and (b) one of the plaster molds of hand for preventing the displacement of the measuring site.
2.3 Determining the glucose-linked wavelength
The absorbance value A at each wavelength was calculated as follows:
| (1) |
where R is the reflectance, calculated by dividing the diffusely reflected light intensity of the skin tissue with that of the reference material. To eliminate spectral baseline shifts, the second-order derivative was applied with a Savitzky-Golay filter [21] and the derivative intensity was defined as follows:
| (2) |
where A is the absorbance Eq. (1) and λ is the wavelength (700, 701, 702, …, 1050 nm). For convenience, I is hereafter called “light intensity” or “intensity”. The light intensity difference from that of the fasting state, ΔIλt, is defined as follows:
| (3) |
where Iλt is the intensity Eq. (2) at wavelength λ and time t (in minutes) after the first bite of the meal (t = 0, 15, 30, 45, 60, 90, and 120 min) and Iλ0 is the intensity at wavelength λ in the fasting state (t = 0). For every CTT, the correlation coefficient between the blood glucose value (BGt) and ΔIλt at each wavelength λ was calculated to obtain the glucose-linked wavelength, λ*, which corresponds to the highest correlation coefficient. The data analysis was performed using a custom-designed program written in R (The R Foundation for Statistical Computing, Vienna, Austria).
3. Results and discussion
A total of 2,737 data sets with a mean blood glucose value of 111.3 mg/dL (range: 68–202, standard deviation: 23.2) were recorded. Seven typical raw absorption spectra of one participant’s palm acquired in one CTT and the corresponding second-order derivative spectra are presented in Fig. 2.
Fig. 2.
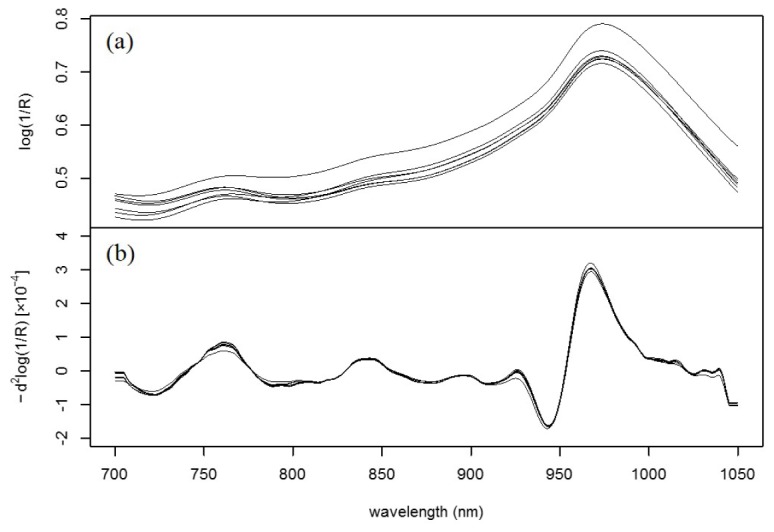
NIR spectra of a participant’s palm measured in one CTT: (a) Raw spectra and (b) second-order derivative spectra.
In the raw spectra (Fig. 2(a)), a strong and broad absorption attributed to the second overtone of the OH vibration of water is observed at approximately 970 nm [22]. The spectra also show relatively small absorptions attributed to deoxygenated hemoglobin near 760 nm [23] and attributed to the OH combination band of water overlapping with the CH combination band of fat [24] at approximately 840 nm. A baseline shift is observed owing to the difference of light scattering caused by the heterogeneity of the tissue matrix [25]. By applying the second-order derivative, the baseline was corrected and the absorptions attributed to the third overtone of the CH vibrations of protein and fat observed in the range of 910–930 nm [24] became discernible (Fig. 2(b)). Although absorptions attributed to sugar, including the third overtone of the CH vibration near 910 nm [22,26] and the third overtone of the CH2 vibration at approximately 930 nm [26] might be present, these were not observed in the spectra because they are concealed by the strong absorptions from the other components.
3.1 Existence of the glucose-linked wavelength
Figure 3 compares the time profiles of BGt (open circles) and the difference of the light intensity from that of the fasting state at the glucose-linked wavelengths ΔIλ*t (filled circles) obtained in the CTTs of four participants.
Fig. 3.
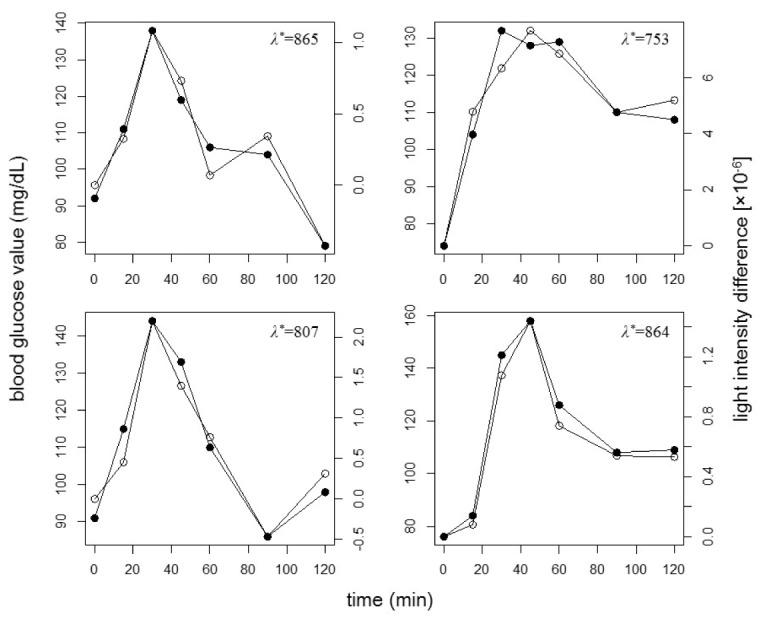
Typical time profiles of BGt (open circles) and ΔIλ*t (filled circles) during a CTT. Each figure panel corresponds to a different participant.
Although BGt and ΔIλ*t are plotted on different scales, they exhibit very similar time profiles. It is considered that λ* was determined by the information related to the absorptions due to not only glucose but also various metabolites; therefore, both λ* and the light intensity change per blood glucose value change fluctuated among CTTs. Similarly to these four cases, good similarities were obtained for most of the CTTs. As shown in Fig. 4, the distribution of the correlation coefficients between BGt and ΔIλ*t for all CTTs has a maximum in the high-value range 0.8–0.9; the corresponding mean value and the standard deviation were 0.82 and 0.12, respectively.
Fig. 4.
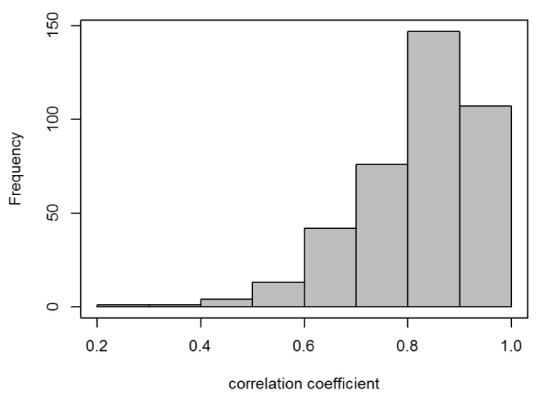
Histogram of correlation coefficients between BGt and ΔIλ*t for all 391 CTTs. The mean value and the standard deviation are 0.82 and 0.12, respectively.
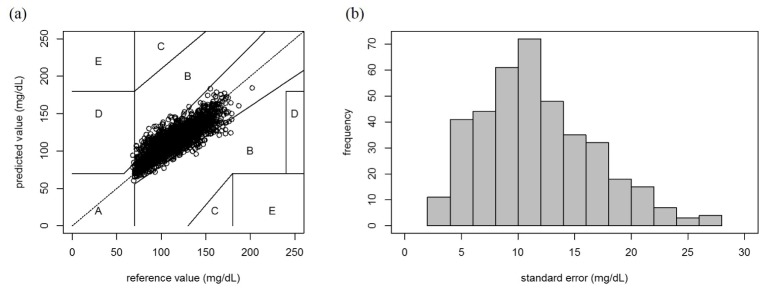
To verify the blood glucose prediction ability of the light intensities observed at λ*, we applied a simple linear regression (SLR) model to the BGt and ΔIλ*t data set obtained in each CTT. The scatter plots for the reference blood glucose value and the predicted value for every CTT are superimposed on the Clarke error grid displayed in Fig. 5(a). The predicted values in zones A and B are clinically acceptable, whereas those in zones C, D, or E would lead to clinically significant errors [27]. A total of 2,579 predicted values (94.2%) are located in zone A, 157 (5.7%) values in zone B, whereas only one value is in zone D. This result can sufficiently show the blood glucose prediction ability of the light intensities. Figure 5(b) shows the distribution of the standard errors of the prediction for all CTTs; the corresponding mean value and the standard deviation are 11.70 mg/dL and 5.03 mg/dL, respectively.
Fig. 5.
Accuracy of the in vivo non-invasive blood glucose prediction: (a) Scatter plots of the reference values and the predicted values calculated from ΔIλ*t for all CTTs. In the Clarke error grid, the results of the 391 CTTs are shown in sets of seven samples. (b) Histogram of the standard error of the prediction for all CTTs. The mean value and the standard deviation are 11.70 mg/dL and 5.03 mg/dL, respectively.
The accuracy and reproducibility of our method were verified by both the error grid analysis and the standard error distribution. Because the CTT data were collected in a single day, a temporal “chance correlation” due to external factors, such as lamp intensity drifts or temperature variations, may be a concern [28,29]. However, the observed high correlation in a large number of independent CTTs clearly indicates the existence of a glucose-linked wavelength at least within a 2-h window.
3.2 Fluctuation of the glucose-linked wavelength
Although we established the existence of the glucose-linked wavelength, this wavelength is different for each CTT; in other words, the glucose-linked wavelength fluctuates daily. This raises the question of whether the selected wavelengths exhibit any tendencies. Figure 6(a) shows the distribution of the probability of the occurrence for the correlation coefficient between ΔIλt and BGt being equal to or higher than 0.7 in a CTT (Phigh.cor). The fluctuation, which could be attributed to metabolism variations, biological tissue complexity, measurement environment, or other unknown factors, was observed even in CTTs of the same participant performed on different dates. This fluctuation is one of the factors that hinder the construction of a universal calibration model for an individual; however, it is sufficiently slow to allow the development of an effective model for at least 2-h periods. The 391 individual CTTs revealed that the distribution of Phigh.cor is not uniform as a function of wavelength, and high Phigh.cor peak are observed at 836, 846, 1013, 1030, and 1040 nm (Fig. 6(a)). At these bands, the frequencies of CTTs with high correlation coefficient were 66, 60, 65, 63 and 75, respectively. Phigh.cor at 948 nm is also high; however, there is no obvious absorption in the range (Fig. 6(b)). Although their assignment is very difficult owing to the broad, ill-defined, and overlapping bands of analytes in the short-wavelength NIR region, these five bands seems to correspond to the absorption peaks observed in the spectra of the hands. As mentioned above, the absorptions attributed to water and fat are observed around 840 nm. In a 2-h CTT, the main change is considered to be caused by intake of carbohydrate at the beginning, but subsequent glycolysis may consume water and produce molecules having alkyl group. For the other three bands, possible assignments include the combination vibrations of CH observed at 1018 nm [24], the second overtone of the NH vibration at 1030 nm and the combination vibrations of CH at 1042 nm [22]. The correct assignments for these bands and the interpretation of their relationship with blood glucose are currently difficult; however, these bands are considered characteristic for non-invasive in vivo blood glucose measurements. Additionally, it was found that Phigh.cor in the ranges 955–1000 nm and 750–780 nm in Fig. 6(a) are distinctly low. These ranges correspond to the strong water band and the band of deoxygenated hemoglobin, respectively. Surprisingly, these regions may be less significant in this study. Moreover, we confirmed that the distribution profile shown in Fig. 6(a) was reproduced by another data set of CTTs performed for 18 different participants (data not shown here).
Fig. 6.
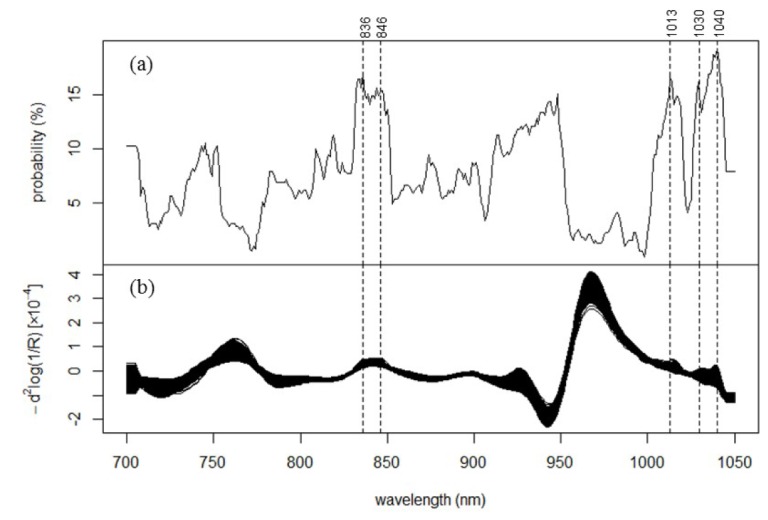
Glucose-linked wavelengths in the non-invasively measured in vivo NIR spectra: (a) Distribution of the probability of the occuerence for the correlation coefficient between ΔIλt and BGt being ≥ 0.70 in one CTT (Phigh.cor). (b) Spectra of the light intensity Eq. (2) for all CTTs.
Zhu et al. [30] reported a non-invasive blood glucose estimation based on the metabolic energy conservation method. They collected 300 data sets from 30 volunteers 1 h after a meal and successfully built a multiple linear regression model with four physiological parameters: heat metabolic rate, oxyhemoglobin saturation, blood flow volume, and pulse rate (the correlation coefficient was 0.876). In our study, the temperature of the measurement site was controlled and oxyhemoglobin saturation had a smaller effect, according to Fig. 6(a); however, further work must be performed considering blood flow volume and pulse rate.
4. Conclusion
To our knowledge, this study provides the first verification of the correlation between the blood glucose value and the light intensity at a single wavelength in the short-wavelength NIR region measured in a 2-h CTT using a large data set. We established the existence of glucose-linked wavelengths at which the light intensities are strongly correlated to the blood glucose values; however, these wavelengths fluctuate daily even for the same person. This fluctuation complicates the development of a universal prediction model for an individual. Nonetheless, the fluctuation is sufficiently small to allow the construction of a model that is applicable for a 2-h period. In addition, we determined that seven data sets for one CTT are insufficient for developing a model using multivariate regression methods, such as PLS regression; however, sufficient when using SLR. Although our results indicate that an individual prediction model must be based on the condition of a limited time period, it can decrease the frequency of finger-stick blood sampling for the continuous blood glucose monitoring of healthy persons, such as the diagnosis of diabetes and the determination of the GI of food. To demonstrate the practical application and reveal the principles of the model, further research is necessary. Our current work focuses on determining and prolonging the effective time for a given glucose-linked wavelength. We expect that the wearable probe can make the spectral measurement conditions, such as the measurement site or the contacting pressure to the probe, more stable and raise Phigh.cor at the informative bands. If Phigh.cor reaches a sufficiently high level, we will be able to determine one glucose-linked wavelength. Our studies are expected to achieve a method for minimally invasive real-time monitoring of blood glucose with a wearable sensor and a low-power light source.
Acknowledgments
No potential conflicts of interest, financial or otherwise, regarding the publication of this article are declared by the authors. The authors would like to thank the participants and staff who contributed to this study.
References and links
- 1.International Diabetes Federation, IDF Diabetes Atlas (International Diabetes Federation, 2013), Chap. 1. [Google Scholar]
- 2.American Diabetes Association , “Standards of medical care in diabetes—2015,” Diabetes Care 38, S1–S94 (2015). [Google Scholar]
- 3.Vashist S. K., “Continuous glucose monitoring systems: a review,” Diagnostics (Basel) 3(4), 385–412 (2013). 10.3390/diagnostics3040385 [DOI] [PMC free article] [PubMed] [Google Scholar]
- 4.Jenkins D. J. A., Wolever T. M. S., Taylor R. H., Barker H., Fielden H., Baldwin J. M., Bowling A. C., Newman H. C., Jenkins A. L., Goff D. V., “Glycemic index of foods: a physiological basis for carbohydrate exchange,” Am. J. Clin. Nutr. 34(3), 362–366 (1981). [DOI] [PubMed] [Google Scholar]
- 5.Food and Agriculture Organization of the United Nations, Carbohydrates in Human Nutrition: Report of a Joint FAO/WHO Expert Consultation (Food and Agriculture Org., 1998), Chap. 4. [Google Scholar]
- 6.International Diabetes Federation, Guideline for management of postmeal glucose (International Diabetes Federation, 2007). [DOI] [PMC free article] [PubMed] [Google Scholar]
- 7.Oliver N. S., Toumazou C., Cass A. E. G., Johnston D. G., “Glucose sensors: a review of current and emerging technology,” Diabet. Med. 26(3), 197–210 (2009). 10.1111/j.1464-5491.2008.02642.x [DOI] [PubMed] [Google Scholar]
- 8.So C.-F., Choi K.-S., Wong T. K. S., Chung J. W. Y., “Recent advances in noninvasive glucose monitoring,” Med. Devices (Auckl.) 5, 45–52 (2012). [DOI] [PMC free article] [PubMed] [Google Scholar]
- 9.Goodarzi M., Sharma S., Ramon H., Saeys W., “Multivariate calibration of NIR spectroscopic sensors for continuous glucose monitoring,” Trends Analyt. Chem. 67, 147–158 (2015). 10.1016/j.trac.2014.12.005 [DOI] [Google Scholar]
- 10.Yadav J., Rani A., Singh V., Murari B. M., “Prospects and limitations of non-invasive blood glucose monitoring using near-infrared spectroscopy,” Biomed. Signal Process. Control 18, 214–227 (2015). 10.1016/j.bspc.2015.01.005 [DOI] [Google Scholar]
- 11.Malin S. F., Ruchti T. L., Blank T. B., Thennadil S. N., Monfre S. L., “Noninvasive prediction of glucose by near-infrared diffuse reflectance spectroscopy,” Clin. Chem. 45(9), 1651–1658 (1999). [PubMed] [Google Scholar]
- 12.Arnold M. A., Liu L., Olesberg J. T., “Selectivity assessment of noninvasive glucose measurements based on analysis of multivariate calibration vectors,” J. Diabetes Sci. Technol. 1(4), 454–462 (2007). 10.1177/193229680700100402 [DOI] [PMC free article] [PubMed] [Google Scholar]
- 13.Maruo K., Yamada Y., “Near-infrared noninvasive blood glucose prediction without using multivariate analyses: introduction of imaginary spectra due to scattering change in the skin,” J. Biomed. Opt. 20(4), 047003 (2015). 10.1117/1.JBO.20.4.047003 [DOI] [PubMed] [Google Scholar]
- 14.Robinson M. R., Eaton R. P., Haaland D. M., Koepp G. W., Thomas E. V., Stallard B. R., Robinson P. L., “Noninvasive glucose monitoring in diabetic patients: a preliminary evaluation,” Clin. Chem. 38(9), 1618–1622 (1992). [PubMed] [Google Scholar]
- 15.Fischbacher Ch., Jagemann K.-U., Danzer K., Müller U. A., Papenkordt L., Schüler J., “Enhancing calibration models for non-invasive near-infrared spectroscopical blood glucose determination,” Fresenius J. Anal. Chem. 359(1), 78–82 (1997). 10.1007/s002160050539 [DOI] [Google Scholar]
- 16.Sämann A., Fischbacher C. H., Jagemann K.-U., Danzer K., Schüler J., Papenkordt L., Müller U. A., “Non-invasive blood glucose monitoring by means of near infrared spectroscopy: investigation of long-term accuracy and stability,” Exp. Clin. Endocrinol. Diabetes 108(6), 406–413 (2000). 10.1055/s-2000-8137 [DOI] [PubMed] [Google Scholar]
- 17.Wold S., Sjöström M., Eriksson L., “PLS-regression : a basic tool of chemometrics,” Chemom. Intell. Lab. Syst. 58(2), 109–130 (2001). 10.1016/S0169-7439(01)00155-1 [DOI] [Google Scholar]
- 18.Uwadaira Y., Adachi N., Ikehata A., Kawano S., “Factors affecting the accuracy of non-invasive blood glucose measurement by short-wavelength near infrared spectroscopy in the determination of the glycaemic index of foods,” J. Near Infrared Spectrosc. 18(1), 291–300 (2010). 10.1255/jnirs.895 [DOI] [Google Scholar]
- 19.Uwadaira Y., Adachi N., Ikehata A., Kawano S., “Development of a non-invasive blood glucose sensor using short-wavelength near-infrared spectroscopy and its application to glycemic index determination,” J. Jpn. Soc. Food Sci. 58(3), 97–104 (2011). 10.3136/nskkk.58.97 [DOI] [Google Scholar]
- 20.Uwadaira Y., Shimotori A., Ikehata A., Fujie K., Nakata Y., Suzuki H., Shimano H., Hashimoto K., “Logistic regression analysis for identifying the factors affecting development of non-invasive blood glucose calibration model by near-infrared spectroscopy,” Chemom. Intell. Lab. Syst. 148, 128–133 (2015). 10.1016/j.chemolab.2015.09.012 [DOI] [Google Scholar]
- 21.Savitzky A., Golay M. J. E., “Smoothing and differentiation of data by simplified least squares procedures,” Anal. Chem. 36(8), 1627–1639 (1964). 10.1021/ac60214a047 [DOI] [Google Scholar]
- 22.Osborne B., Fearn T., Hindle P., Practical NIR spectroscopy with Applications in Food and Beverage Analysis (Addison-Wesley Longman Ltd, 1993). [Google Scholar]
- 23.Sato H., Wada S., Ling M., Tashiro H., “Noninvasive measurement of oxygenation of hemoglobin by direct transmission of near-infrared energy (700–1000 nm) from an electronically tuned Ti:sapphire laser driven by a dual radio-frequency driving method,” Appl. Spectrosc. 54(8), 1163–1167 (2000). 10.1366/0003702001950977 [DOI] [Google Scholar]
- 24.Sasić S., Ozaki Y., “Short-wave near-infrared spectroscopy of biological fluids. 1. Quantitative analysis of fat, protein, and lactose in raw milk by partial least-squares regression and band assignment,” Anal. Chem. 73(1), 64–71 (2001). 10.1021/ac000469c [DOI] [PubMed] [Google Scholar]
- 25.Alexeeva N. V., Arnold M. A., “Near-infrared microspectroscopic analysis of rat skin tissue heterogeneity in relation to noninvasive glucose sensing,” J. Diabetes Sci. Technol. 3(2), 219–232 (2009). 10.1177/193229680900300202 [DOI] [PMC free article] [PubMed] [Google Scholar]
- 26.Golic M., Walsh K., Lawson P., “Short-wavelength near-infrared spectra of sucrose, glucose, and fructose with respect to sugar concentration and temperature,” Appl. Spectrosc. 57(2), 139–145 (2003). 10.1366/000370203321535033 [DOI] [PubMed] [Google Scholar]
- 27.Clarke W. L., Cox D., Gonder-Frederick L. A., Carter W., Pohl S. L., “Evaluating clinical accuracy of systems for self-monitoring of blood glucose,” Diabetes Care 10(5), 622–628 (1987). 10.2337/diacare.10.5.622 [DOI] [PubMed] [Google Scholar]
- 28.Arnold M. A., Burmeister J. J., Small G. W., “Phantom glucose calibration models from simulated noninvasive human near-infrared spectra,” Anal. Chem. 70(9), 1773–1781 (1998). 10.1021/ac9710801 [DOI] [PubMed] [Google Scholar]
- 29.Zhang W., Liu R., Zhang W., Jia H., Xu K., “Discussion on the validity of NIR spectral data in non-invasive blood glucose sensing,” Biomed. Opt. Express 4(6), 789–802 (2013). 10.1364/BOE.4.000789 [DOI] [PMC free article] [PubMed] [Google Scholar]
- 30.Zhu J., Chen Z., “Research on the multiple linear regression in non-invasive blood glucose measurement,” Biomed. Mater. Eng. 26(S1), S447–S453 (2015). 10.3233/BME-151334 [DOI] [PubMed] [Google Scholar]


