Abstract
Although there is increasing interest in the investigation of cone reflectance variability, little is understood about its characteristics over long time scales. Cone detection and its automation is now becoming a fundamental step in the assessment and monitoring of the health of the retina and in the understanding of the photoreceptor physiology. In this work we provide an insight into the cone reflectance variability over time scales ranging from minutes to three years on the same eye, and for large areas of the retina (≥ 2.0 × 2.0 degrees) at two different retinal eccentricities using a commercial adaptive optics (AO) flood illumination retinal camera. We observed that the difference in reflectance observed in the cones increases with the time separation between the data acquisitions and this may have a negative impact on algorithms attempting to track cones over time. In addition, we determined that displacements of the light source within 0.35 mm of the pupil center, which is the farthest location from the pupil center used by operators of the AO camera to acquire high-quality images of the cone mosaic in clinical studies, does not significantly affect the cone detection and density estimation.
OCIS codes: (110.1080) Active or adaptive optics; (330.7331) Visual optics, receptor optics; (170.3880) Medical and biological imaging
1. Introduction
Since the introduction of adaptive optics (AO) into the field of retinal imaging, the photoreceptor mosaic can be imaged at a resolution high enough to resolve individual photoreceptors in patients. Most studies have focused on the analysis of the spatial distribution of the cones [1–4], showing how the characteristics of the cone mosaic can vary between subjects, who are either healthy or who present retinal disease [5–8].
In addition to their number and position, one of the most noticeable features of the photoreceptors is the spatial variability of their reflectance, which has been clearly detected with all AO imaging modalities [9–18]. From early observations, it has been shown that the cones change their reflectance with time even in healthy retinas [9]. As recently highlighted, in some clinical cases the cone reflectance is the only apparent feature of the cones that distinguishes a healthy cone mosaic from a mosaic with altered functionality, but unaltered spatial organization [19]. Nevertheless, the investigation of differences in cone reflectance between pathological and healthy retinas is still limited to a few isolated studies [20, 21]. In addition, studies have demonstrated that cones in the central retina may vary their sensitivity or pointing direction in order to compensate for the eye’s internal aberrations [22] or deterioration in the nearby cone’s functionality [23] and that cones in the peripheral retina may vary their pointing direction depending on the position of the center of the illumination pupil [24]. The use of AO Optical Coherence Tomography (OCT) has also provided information on the dependence of the reflectance on depth in the inner cone interfaces, leading for the first time to a 3D characterisation of the cone reflectance [14]. Phase-sensitive implementations of spectral-domain OCT were also developed, leading to a further improvement in OCT axial resolution [25].
For the above reasons, understanding of the cone reflectance variability could provide a unique insight into the physiology or pathophysiology of these cells and give functional information that is complementary to the structural mosaic organization described by spatial metrics [19,26]. At the same time, it is necessary to investigate whether the temporal variability of cone reflectance may influence the study of mosaic spatial metrics.
The variability of cone reflectance can be analysed in two ways: between different cones or on each cone at different times. It has been shown that the changes in reflectance occur independently between the cones [9] and that the cones change their brightness on time scales ranging from milliseconds [10, 17] and seconds [11, 15, 16] to hours [9, 12, 13], days [14], months or years [18].
Using an AO-Scanning Laser Ophthalmoscope (SLO)-OCT [14], it was possible to determine that the fluctuations in brightness due to the outer segment renewal are the sum of the reflectance fluctuations in the cone inner interfaces, and that they are independent of each other. A common aspect of previous studies is that the cone reflectance has been analyzed for short time periods, usually not exceeding one day, with high-frequency time observations. Another characteristic of the previous studies is that the windows within which the cones have been analysed were small (with maximum size being 0.94 × 0.70 degrees in [14]), and so the results may have been limited with regards to both the number of cones and the low-frequency spatial variations. The only long-term study [18] used an AO-SLO system and was specifically focused on the functionality of ten poorly reflective cones and therefore was not intended to be a survey of cone reflectance in AO-SLO images of the cone mosaic. Investigation of the cone reflectance in different retinal areas and over long time periods using an AO flood illumination camera is therefore lacking in the literature.
It has already been observed that the position of the light source in an AO flood illumination system has an influence on the reflectance of the cone mosaic [9, 24, 27–29], and this property has been used to study the angular tuning of single cones [15, 28, 30]. As the performance of the most commonly used cone detection algorithms depends on the quality of the images to which they are applied [31], it is also possible that the position of the light source itself affects not only the reflectance of the cones but also their detection and the subsequent estimation of the mosaic metrics. From a technical point of view, it would be useful for the operators of commercial AO flood illumination systems to know if there is a substantial difference in the detection results when changing the position of the light source within the central pupil area, which is the area commonly used for collecting high-quality AO images of the cone mosaic. Based on a thorough literature search, we are not aware of studies that examine the influence of the light source position on automated cone detection as a separate topic from the reflectance and angular tuning of the cones.
The aim of this work is to develop an automated approach for investigating the cone reflectance variability of a single eye. The reflectance of the cones was evaluated over time scales ranging from minutes to years, and for large areas of the retina (≥ 2.0 × 2.0 degrees) at two different retinal eccentricities using an AO flood illumination retinal camera. Our purpose is to understand and create a baseline for the comparison of data acquired on the same subject over long time scales. The ability to identify the same cones on different images over time could prove very useful in the analysis of retinal pathologies where the deterioration of individual cones can be observed [23], in which case an estimation of the performance of an automated method to identify and match the cones in a healthy eye is needed. We test here if the cone detection and identification in multiple images is affected by their time separation. In addition, we determine whether the displacement of the light source within 0.35 mm off the pupil center in a commercial AO camera, which is the farthest location from the pupil center used by clinical operators to acquire high-quality images of the cone mosaic, affects the automatic identification and matching of the cones. If this proves true then restrictive requirements on the data acquisition would be necessary during the follow-up of a patient.
2. Methods
2.1. Image acquisition
The research procedure described in this work adhered to the tenets of the Declaration of Helsinki. It is part of a study protocol approved by the local ethics committee (Azienda Sanitaria Locale Roma A, Roma, Italy), in which all the subjects recruited gave written informed consent after a full explanation of the procedure. The present data set consists of 61 images acquired with a commercial AO retinal camera (rtx1, Imagine Eyes, Orsay, France) on a healthy subject (female, 27 years old in 2015, −3.75 dioptres, axial length 24.38 mm) over a time span of three years, from 2012 to 2015. Each imaging session was conducted after dilating the pupil with one drop of 1% tropicamide. During imaging, fixation was maintained by instructing the subject to fixate on the internal target of the instrument moved by the investigator. A sequence of 40 frames was acquired by illuminating a retinal area subtending 4 degrees visual angle in the right eye of the subject with an illumination source of λ = 850 nm, Δλ = 35 nm that covered the whole pupil. The images were acquired at 2.5 degrees and 4.0 degrees temporal from the fovea of the right eye. The two eccentricities were chosen to be a compromise between the resolution limit of the instrument, which does not allow cones to be resolved too close to the fovea (i.e. closer than 1 degree), and the presence of rods, which alter the cone relative spacing enough to be detectable by the rtx1 when further than 5 degrees [32].
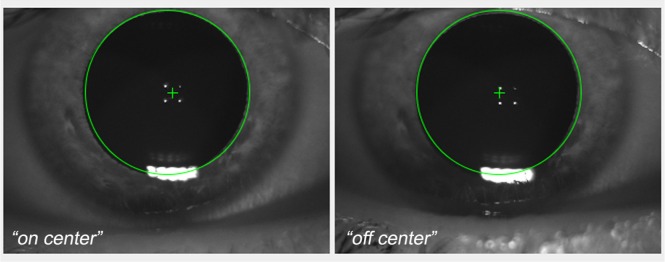
The time between the images ranged from 45 minutes to 3 years at 2.5 degrees and from 45 minutes to 4 months at 4.0 degrees. The images were divided into sub-sets according to their time separation. The final division allowed us to analyse the changes in the cone reflectance over time ranges of minutes, hours, days, months and years. All images (with the exception of the 24 May 2012, 30 June 2013 and 26 May 2015), were acquired focusing the light source at two different positions, on the pupil centre (“on center” illumination) and 0.35 mm temporal (“off center” illumination) from the pupil center (Fig. 1). No difference in image quality was found between the temporal and other meridians (data not shown). The data set and the sub-set division is available in Data File 1 (1.6KB, CSV) of the supplementary materials.
Fig. 1.
Screen shot of the anterior segment image of the viewer interface of the AO flood illuminated retinal camera showing the placement of the entry beam (green cross) in the right eye of the subject. The four white dots are the first Purkinje images of the cornea, which are taken by the AO camera operators as reference points for collecting high-quality images of the photoreceptor mosaic. The “on-center” represents the illumination position passing through the center of the pupil; in the “off-center” position, the illumination is 0.35 mm temporal from the pupil center. The corneal reflections allow images of the retina to be captured using the same illumination position over time.
2.2. Image pre-processing and processing
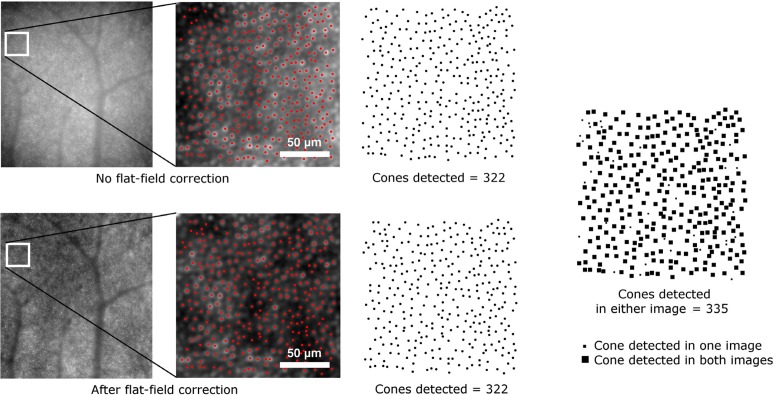
Each image was obtained by processing 40 raw 16-bit frames acquired by the AO camera with the procedure described in Ramaswamy and Devaney [33]. A new approach was used for background correction; as one of the objectives of this study was to analyse the cone reflectance, we corrected for the background using the same flat-field image for all the raw frames. The background correction is necessary in order to correct for non-uniform illumination of the retina. In this case, the use of the same flat-field ensured that the intensity values between all the images could be compared and that the intensity distribution of the images, and therefore of the cones, is not altered by non-uniform illumination. A preliminary analysis was performed on the low-frequency profile of the raw unregistered frames, which confirmed that the non-uniform illumination profile did not depend on the eccentricities or the time and the difference between the images and the flat field used was less than ± 7% in all cases. After this analysis, the flat-field image was obtained by averaging a total of 240 raw frames acquired at 1.0, 2.5 and 4.0 degrees eccentricities from the fovea. Additional frames were acquired at 1.0 degree only for the flat-field estimation as this eccentricity would not have been suitable for the cone analysis (section 2.1). The frames were averaged unregistered, so that the major retinal structures, such as blood vessels, are averaged out, as in previous works [12, 16]. All the raw frames were divided by the same flat-field image and then registered in order to produce the final images. The method used for background correction does not have any impact on the cone detection performance, as the first step of the cone detection algorithm that we used [34; section 2.3] is based on the localization of regional maxima in the images and the presence of the maxima is not influenced by low-frequency spatial variation (Fig. 2).
Fig. 2.
Example of detection on the same portion of two images obtained from the same frame series. In the upper image, the frames were not corrected for the flat-field prior to registration, in the image below the frames were divided by the flat-field image and then registered. The cone map on the right is the sum of the two cone maps resulting from the separate detections on the two images. The difference between the combined cone map and the two individual cone maps is less than 4% of the cones.
The final images were registered for each retinal location in order to analyse and compare the same area of the retina over time. This registration process was performed in two steps; coarse registration and fine registration. Firstly, the images were coarsely corrected for rotation using Log-Polar transformation followed by Normalized Cross Correlation [35] and for translation using Normalized Cross Correlation only. Images were finely registered for rotation and translation by identifying and tracking a limited selection of the cones that remain detectable across all the images, as in [33]. The use of bright cones assured the maximum possible accuracy of the process. The use of peak tracking assured that the registration was not affected by retinal features other than the local cone peaks, which change their intensity but retain their relative position along the time series.
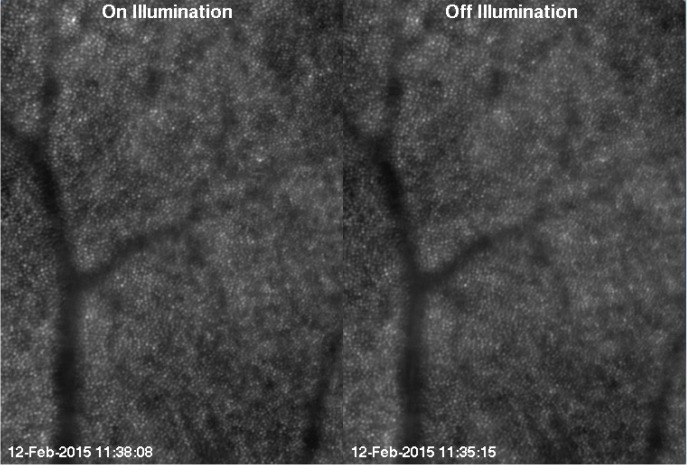
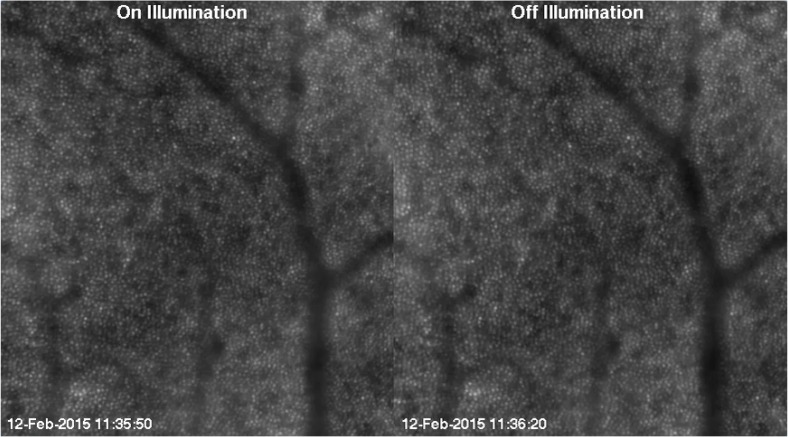
The registration process returned two series of registered images with areas of 2.0 × 2.8 degrees (0.61 × 0.83 mm) and 2.3 × 2.6 degrees (0.70 × 0.78 mm) at 2.5 and 4.0 degrees eccentricity from the fovea respectively, which were acquired at different times and with two different light source positions (Fig. 3 and 4), except for three images obtained at 2.5 degrees, which were obtained with on-center illumination only.
Fig. 3.
One frame of the time series at 2.5 degrees after registration and normalization ( Visualization 1 (1.2MB, MP4) ). An overview of the data set and the sub-set division is available in Data File 1 (1.6KB, CSV) .
Fig. 4.
First frame of the time series at 4.0 degrees after registration and normalization ( Visualization 2 (1.1MB, MP4) ). An overview of the data set and the sub-set division is available in Data File 1 (1.6KB, CSV) .
The area at each eccentricity was the maximum area common to all images after registration. The right side of the series at 4.0 degrees and the left side of the series at 2.5 degrees can be seen to overlap. However, we chose to analyse them separately in their entirety in order to test our method for the analysis of large retinal patches. Before proceeding with the reflectance analysis (section 2.4), all the images were normalized so that images collected at the same eccentricity had the same total intensity, i.e., the sum of all the pixel intensities. This was carried out by dividing each 16-bit image by its total intensity and then multiplying by the total number of pixels:
| (1) |
where M is the number of pixels on the horizontal axis and N is the number on the vertical axis. In this way, all the images had a total intensity that is proportional to their area and the intensity values between the two eccentricities and the different time scales images could be compared. Furthermore, this normalization can be useful to investigate if the image intensity or the cone intensity histograms have means that are displaced with respect to the mean value of the pixels, which with this normalization is 1.
Before applying the detection algorithm, we selected the area to be analysed. A vessel segmentation process was performed to exclude the region on which the retinal blood vessel shadows are projected [18]. As cone size and density change as a function of distance from the fovea, cone density has to be measured as a local value and it is common practice to select small windows, which do not include blood vessels, on the image of the cone mosaic. The purpose of segmenting the blood vessels is not to skip the selection of windows on the image, which is necessary, but to allow for both an automatic division of the image into windows and to increase the area that can be analysed. In fact, by automatically excluding the area occupied by the blood vessels, all the remaining area of the image can be analysed without further manual intervention.
We have used here a custom method developed for the segmentation of blood vessels on high resolution photoreceptor layer images, which has been described in a previous work [36]. The vessel segmentation was performed only once for each retinal location, using the average of all the registered images at that location. In this way, the area to be analysed was the same for all the images at each location.
2.3. Cone detection
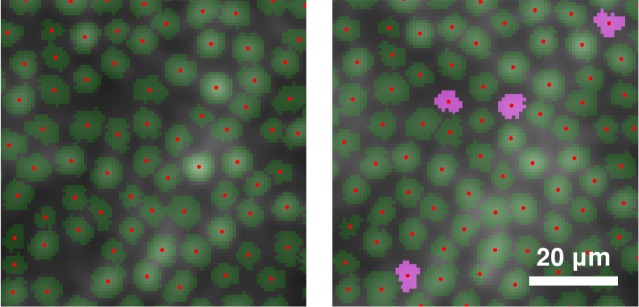
Before starting the detection process, we doubled the size of the images using bicubic interpolation in order to improve the final detection performance [31]. The size on the retina of the upsampled pixels was 0.8μm on an emmetropic eye. We averaged all the images registered at each retinal location in order to have two images of the cone mosaic that can be taken as references. The detection was performed using the Chiu et al. algorithm [34], which detects the cones and segments their shape, separating them from the background. It was carried out on all the images as well as on the average images. From previous work [31], we know that the typical mean percentage of cones correctly detected by the Chiu et al. algorithm on a single image at the same eccentricities is 97%. Since the average images have more cones than any single image of the series, the algorithm performed notably better, detecting also the cones that were missed in the images because they were too faint (Fig. 5) and 97% can therefore be taken as a lower limit for the accuracy. Because of this, we considered the results on the average images as the closest estimate of the “ground truth” data available for the cone coordinates. Two masks excluding the vessels were applied to the detections, both on the images and on the average images, so that only the cones outside the vessels were analysed.
Fig. 5.
Detail of detection and segmentation of cones at the same location of a single image (left) and the average image (right). The cones that are detected and segmented on the average image but not on the single image are shown in pink.
We calculated cone density (cones/mm2) in non-overlapping sampling windows of 200×200 pixels, which corresponds to approximately 0.16 × 0.16 mm on the retina, covering the whole image area. When detecting the cones and segmenting their shape, we excluded the cells for which the segmentation was not entirely inside the window borders or for which the central cone coordinates fell inside the segmented vessels. We compared density estimates for the two different illuminations with Bland-Altman plots in order to determine if the position of the light source significantly affects the identification of cones. In addition, the estimates of cone density on the single images were compared to the results on the average images.
2.4. Cone matching
In order to track the individual cones on multiple images over time, we performed a “cone matching” procedure. Two cone detections on two different images are taken to correspond to the same cone if they are closer than a defined tolerance distance. If more than one cone is inside the tolerance distance in the second image, then that which is closest to the cone in the first image is taken as the match. Since the physical size of the cones varies as a function of the distance from the fovea, using the same tolerance distance for the whole image would lead to inaccurate matching. For this reason, the tolerance distance was defined individually for each cone as half of its equivalent diameter (i.e., the diameter of a circle with the same area as its segmentation) on the reference image. The cone matching was performed between the images from the two series at 2.5 and 4.0 degree eccentricities and the average image.
2.5. Cone reflectance
The reflectance of the cones was investigated after image normalization, as described in section 2.2. The segmentation of the cones given by the algorithm on the average images was used to study how the reflectance of the cones changes with time. In general, the cone intensity can be measured either as the maximum or the mean intensity value inside the segmentation profile for each cone. After a preliminary comparison that showed minimal differences between the two methods (data not shown), we preferred to use the mean value (i.e., the sum of the intensity pixel values divided by the number of pixels). In all the images we used the segmentation profiles of the average images, insuring that cones with low intensity values (Fig. 5) are also included in the analysis.
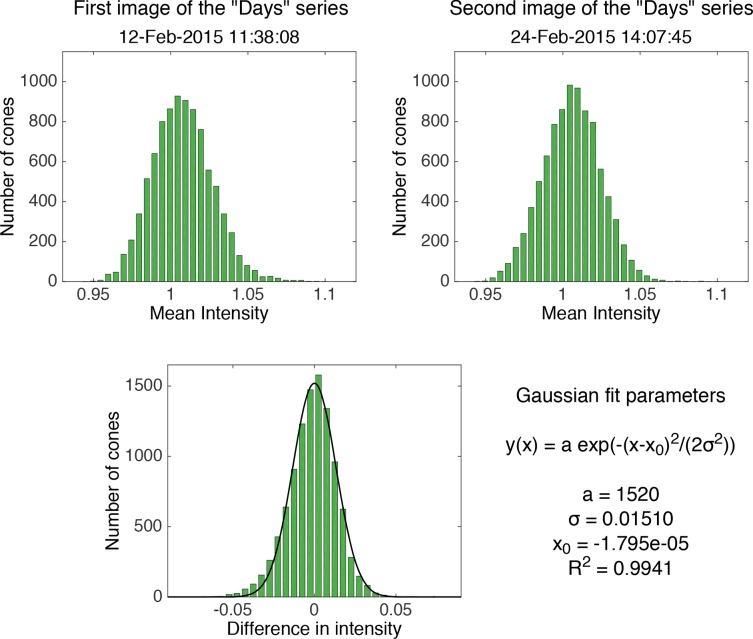
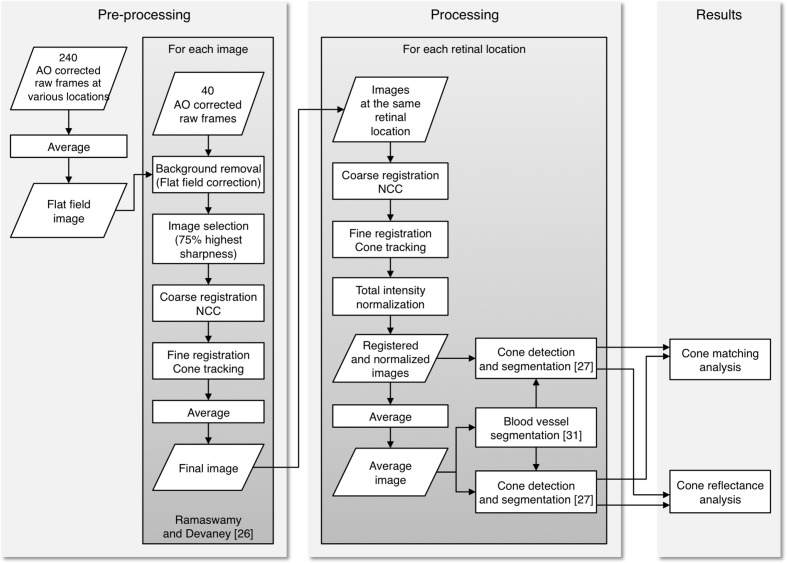
In order to determine if there is any pattern in cone reflectance with time, we calculated for each image the difference in intensity of the cones with respect to the intensity of the same cones in the first image of each time series (e.g., the intensity of each cone in the images of the “Days” series was subtracted from its intensity in the first “Days” image, see Fig. 6). The differences in intensities for each image presented a normal distribution, and we fitted the data with Gaussian curves. For the purpose of clarity, a flow chart of the entire analysis process is shown in Fig. 7.
Fig. 6.
Top row: histograms of the cone intensity in the first and second image of the “Days” series at 2.5 degrees. Bottom: histogram of the difference between the intensity of the cones in the second and the first image fitted with a Gaussian distribution, for which the parameters are shown on the right. These histograms are shown as representative of the results on all the images.
Fig. 7.
Flow chart of the entire analysis process. The processing algorithms enclosed in the left and right grey boxes were performed for all the images and for the two series of images at the two retinal locations respectively.
3. Methodological validation
In this section we provide a validation of the presented analysis methodology. Cone detection and matching are performed on pairs of images acquired with different positions of the light source, and the results are compared to the average images at the corresponding retinal locations.
3.1. Cone detection
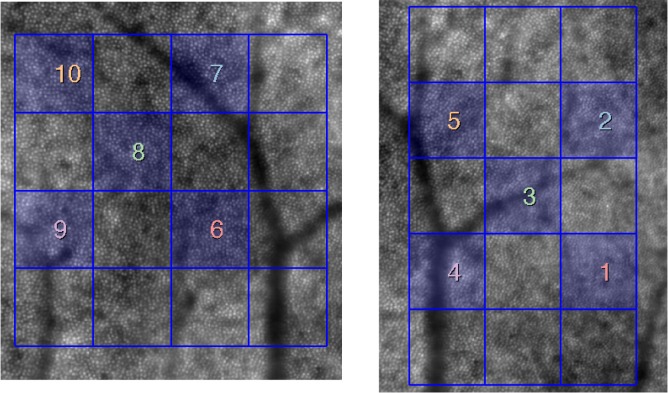
The agreement of cone density estimates between the single and average images of the cone mosaic was measured using 5 sampling windows of the grid at each retinal eccentricity (Fig. 8). We selected a number of windows that are distributed over the images and include regions both with and without vessel shadows (the shadowed areas were excluded automatically from analysis, as described in section 2.2).
Fig. 8.
Average images at 4.0 degrees (left) and 2.5 degrees (right) with the grid of 200 × 200 pixel (160 × 160μm) windows in the image series in which the parameters were calculated. The selected windows are highlighted and marked with numbers. The same numbers are used in the plot legend in Fig. 9.
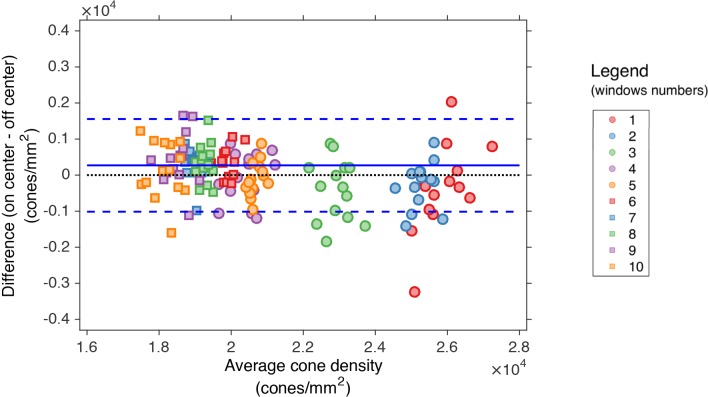
The two different illumination methods were compared in the estimation of the cone density with a Bland-Altman plot (Fig. 9). The analysis was carried out on the same 5 windows at each eccentricity, as described above. The points on the plot represent the comparison of the measurements between 14 pairs of “on center”-“off center” images acquired close together in time.
Fig. 9.
Bland-Altman plot of the cone density at 2.5 (circles) and 4.0 degrees (squares) in selected windows. The plot shows the mean of the differences (continuous lines) and ± 1.96 SD (dashed lines) of the cone density between the two illumination positions. The numbers represent the sampling windows shown in Fig. 8.
The average of the cone density as measured on “on-center” and “off-center” images was also compared to the “ground truth” values on the average images at the two retinal locations. The differences in cone density between all single images and the average images were within ≤ 9% in all sampling windows. The fact that the detection performed equally in all the sampling windows across the image positively confirms that the analysis of large retinal patches can be performed. If the isoplanatic area was smaller than the field of view then this would have resulted in the cone detection performance decreasing as a function of distance from the center of the images. This might be expected from previous studies of the isoplanatic angle [37], but was not evidenced in this work.
3.2. Cone matching - “on center” / “off center” images
The percentage of the cones on the average image that were matched with cones in the single images ranged between 81% and 94% at 2.5 degrees and between 89% and 97% at 4.0 degrees, in both cases compatible with the detection performance of the algorithm. The mean and standard deviation of cones successfully matched was 89.8% ± 2.8% at 2.5 degrees with on-center illumination, while at the same eccentricity the off-center percentages were 91.7% ± 1.3%. At 4.0 degrees, the on-center percentages were 94.6% ± 1.3% on-center and the off-center percentages were 95.5% ± 0.4% (the values for all the images are available in Data File 2 (1KB, CSV) of the supplementary materials).
The matching percentages improved as the distance from the fovea increased, due to the increased relative diameter of the cones and the increased distance between the neighbours. We performed the Student’s t-test on paired “on center” and “off center” illumination observations in order to establish if the matching performance between the two illumination methods is significantly different. The result is that there is evidence of a difference between the two methods (p = 0.04 at 2.5 degrees and p = 0.02 at 4.0 degrees), with off-center illumination performance being 2% better on average at 2.5 degrees and 1% better at 4 degrees. Even if the mean difference between the two illumination methods is significant, their absolute value is not clinically relevant.
4. Results
4.1. Cone matching - time scales
The matching analysis presented in the following paragraphs was performed only on the images with on-center illumination in order to analyse the matching percentages over all the possible time ranges. We determined how many cones on the average image could be successfully found in a sequence of images. The percentage of cones on the average image that can be successfully detected and tracked over 3 years and on all the 17 images drops to 40% at 2.5 degrees. At 4.0 degrees, the percentage over 4 months and on all 15 images drops to 64%. The percentage decreases as the time separation and accordingly the number of images analysed increases.
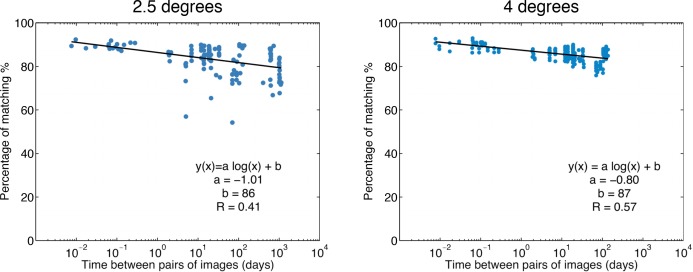
Figure 10 shows the results of matching cones performed on pairs of images as a function of the time separation between the two images. In this case, the matching was not performed with the average image but only considering two images at a time, in order to reproduce the case of a clinician with only two images available. All the possible combinations of image pairs have been tested. The plots show how the percentage of matching decreases as the time separation increases. When two images are acquired minutes or hours apart, on average 90% of the cones can be matched. As the time separation increases, the matching worsens on average to 80% when two images are 3 years apart.
Fig. 10.
Matching of cones performed on pairs of images as a function of the time between the two images, at 2.5 degrees and at 4.0 degrees. The x-axis is in logarithmic scale. The plots show how the percentage of matching decreases as the time increases with a logarithmic trend (linear fits on logarithmic scale).
The matching at 2.5 degrees presents a few low matching image pairs. The poor matching for these image pairs was found to be attributed to one specific image (26 May 2015), which showed signs of motion blur. The motion blur was responsible for a greater number of missed matches, as it altered the estimation of the cone positions.
4.2. Cone reflectance
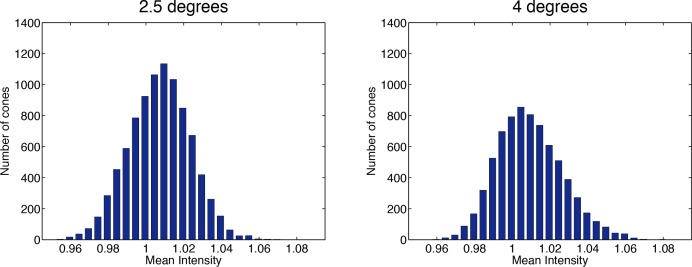
The histograms of the measured cone intensities on all the images had an approximately Gaussian shape (goodness of fit R2 ≥ 0.99 for all images) slightly skewed towards higher intensity (skewness values between 0.01 and 0.64), showing a limited excess of bright cones over dim cones. The means of the cone intensities were 1.0072 ± 0.0001 at 2.5 degrees and 1.0093 ± 0.0001 at 4.0 degrees and in all cases greater than 1.0053. This is consistent with the mean cone intensity being greater than the average image intensity, which with our normalization is set to 1. The averages of the standard deviations of the distributions were 0.0192±0.0001 at 2.5 degrees and 0.0201 ± 0.0001 at 4.0 degrees. Although the differences in mean intensities between the two retinal eccentricities were statistically significant (p < 0.001; ANOVA), all the values were within a small range, as can be seen by the small standard deviations. The cone intensity distributions are well represented by the histograms obtained on the average images (Fig. 11), showing the limited skewness of the distributions.
Fig. 11.
Histogram of the mean cone intensity (as measured inside the segmentations) on the average images at 2.5 degrees and 4.0 degrees. The intensity values are measured after the total intensity normalization.
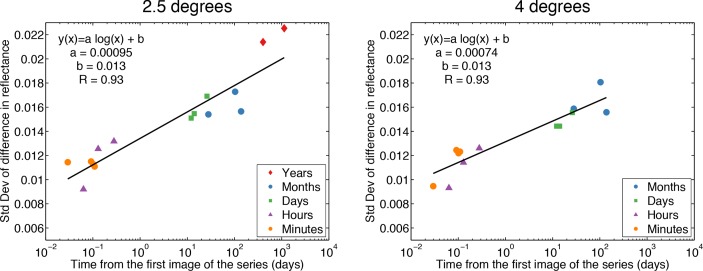
Histograms of the difference in intensity between cones on pairs of images were well fitted by Gaussian distributions. The centers of the distributions were all included in a range between −0.0021 and 0.0011, though their differences were statistically significant (p < 0.001; ANOVA). Nevertheless we can assume that the Gaussian distributions are centered on zero as their standard deviations were ten times greater than the difference from zero. Also, the displacement of the centers with respect to the zero are not dependent on time. The standard deviation of the difference in intensity as a function of time is plotted in Fig. 12, where it can be seen that the variation in cone reflectance increases logarithmically with time. This result is surprising as it implies long term correlation in the cone reflectance. We will consider the implications of this result in the following Discussion.
Fig. 12.
Standard deviation of the difference in cone reflectance as a function of time at 2.5 degrees and 4.0 degrees. The x-axis is in logarithmic scale. The standard deviation is calculated from the Gaussian fit of the histograms of the intensity difference of all the cones with respect to their intensity value in the first image of the different time series. It can be seen that the variability of cone reflectance increases logarithmically with time (linear fits on logarithmic scale). The variation in cone reflectance between images acquired more than one year apart is more than the double the variation observed on the cone mosaic on the same day.
5. Discussion
Our results suggest that identification and tracking of cones over time is not altered significantly by the precise positioning of the light source, when this is closer than 0.35 mm from the pupil center (section 3.1 and section 3.2). This can be beneficial to clinicians who use commercial AO flood cameras if the purpose of an imaging session is cone detection and estimation of cone density, as the operator knows that he does not need to center the source exactly. We found that simple tracking of a single cone becomes harder as the number of images and the time separation increases (Fig. 10). This phenomenon could be related to several factors, including the presence of faint cones (or rods) in each image, some of them tended also to disappear completely and then reappear again over time, regardless of the time range between the images. Dim cones are more likely to be missed and the cones that are not detected are different in each image, making it harder to follow one cone through all the images. However, we cannot exclude that some cones may have died or lost their function over three years follow-up, thus directly influencing cone matching [38]. Another possible cause for a missed match was when the cones were detected farther apart than the tolerance distance. This type of missed match can be caused by image registration errors. Even if the registration was performed in order to correct for displacements smaller than the cone size, we acknowledge that residual translational or rotational errors might affect the matching. However, this should not be the cause of the time dependence of the matching, but rather cause isolated mismatches (e.g. the poor matchings at 2.5 degrees), and the same will be true for the differences in intensities.
In recent years, there have been several studies focused on observation of the reflectance of living cones [9, 11–16, 18], and on its modelling, suggesting how the cone reflectance could be due to constructive interference of scattered light which increases with penetration depth in the cone outer segment [30], but the origin of its variability is still not fully understood. The reflectance studies have been performed with all AO imaging modalities, including AO-SLO [11–13, 16], AO-OCT [14] and flood-illuminated AO cameras [9, 17, 24]. The most common explanation so far for the cone reflectance variability of the order of an hour is the disc renewal process [9], which is thought to be the cause of both change in the outer segment length, observable through interference produced with a long-coherence light source AO-SLO [12], and in the refractive index at the interface between the inner and the outer segment, observable also with a short-coherence light source AO-SLO-OCT [14].
From our results, there is no evident pattern that regulates the time variation of cone reflectance in AO flood illumination images of the cones in the central retina. Over the short as well as the long time periods, the majority of cones showed little change in reflectance while others greatly increased or decreased their reflectance, resulting in an approximately normal distribution of the difference in reflectance. From the plots in Fig. 12 we see that the variation in cone reflectance that can be expected to be seen in the same cones increases with time, and as a result their identification in two images becomes more difficult as the time separation increases (Fig. 10). The variation in cone reflectance was found to increase logarithmically with time; this indicates that the intensity fluctuations are strongly correlated on timescales shorter than a day, becoming less correlated with time, but do not appear to be completely independent even on the longest timescales. This suggests the presence of some long-term trends in the cone reflectance could be related to changes in cone directionality or other cellular sources, as discussed previously [14]. The fact that the intensity fluctuations after hours are more pronounced than minutes was already observed by Pircher et al. [14], and here we extend the result to months and years separation. Since the coherence length for our light source was Lc = (2ln2λ2)/(nπΔλ) = 6.37μm (calculated as in [10]) and the cone outer segment length is greater than 20μm, we can exclude that the outer segment length is the source of the variability observed by us, as well as in [14]. The change in the refractive index at the inner segment-outer segment interface caused by the generation of new discs, a possible explanation for the reflectance variability that was pointed out in the cited study, could therefore be the source of the variability observed by us as well. Changes in the composition of the outer segments-RPE interface due to the migration of melanosomes or melanogenesis during disc shedding have been also considered to explain the changes in reflectance [9].
Nonetheless, the physiological processes that cause the changes in reflectance to increase with time separation still needs to be identified. Either waveguiding or cone pointing may change over time [9, 18]; for example, the reflections within a properly waveguiding cone may be reduced because the reflective interfaces within the cone (either between inner and outer segments or between the posterior tips of the outer segments and RPE) change in some way. In addition, the light coupled into a single cone can be either transmitted or absorbed differently over time and some cones may point at different points on the pupil over long time scales. Specifically related to imaging of the cones with an AO flood-illuminated camera, spatial variations may arise also in the inner retina, such as those caused by blood vessels, which influence the reflectance of cones. However, we automatically excluded the area of the cone mosaic occupied by the blood vessels, reducing the effects of stray light on cone reflectance and making it easier to study the reflectance changes that are intrinsic to cones.
The two representative entry pupil positions used in this work have been chosen in order to understand the influence of the illumination positions commonly used to acquire high-quality images of the cone mosaic in clinic. Since oblique incidence of light increases the amount of light which traverses more than one outer segment before being absorbed, this could affect the overall image quality of the cones and hence their identification with automated algorithms. However, Vohnsen [30] has previously shown that this can only have an impact when the angle of incidence on the retina is greater than 7 degrees corresponding to a pupil entrance displacement of 2.7 mm. In previous work [24], the reflectance of the cones in AO flood-illuminated images of the retinal periphery has been shown to be greatly influenced by large displacements of the entry pupil. It is well known that the cones have relatively narrow angular reflectance functions, returning much more of the incident light towards a point near the center of the pupil than towards points farther away from the center. This phenomenon is closely related to the Stiles-Crawford effect [9, 27–29], which describes the variation in the visual effectiveness of light entering through different locations in the pupil.
In this study, we used a commercial AO flood-illuminated camera; with the method developed for processing of these images, which is largely automated, it is possible to establish an analysis routine that can be applied in clinics as part of a research procedure for assessing the health of the cone mosaic in patients. Changes in cone reflectance have already been associated with retinal conditions [39, 40] and with this work we are moving towards the identification of additional properties of the cones, which are complementary to their spatial organization.
Limitations of the current work include the lack of a measure of the absolute reflectance of cones since processing of flood-illuminated AO images included normalization in order to compare images acquired at different times and under different conditions, which unavoidably altered photoreceptor reflectance. In addition, we only studied one subject. Another limitation could be the automatic detection of the cones. Even if we used the algorithm with the best performance and that best suited our needs, the detection process cannot be regarded as perfect [31]. Nonetheless, we note here that the analysis of such a large amount of data would not have been possible using manual cone detection only, and one of our purposes is to move towards the automation of the analysis process.
With the methodology developed for the cone detection and area selection, we plan to extend the analysis of the changes over time in the cone mosaic to the metrics related to the cone spatial distribution (density, regularity metric and nearest neighbour distance). Moreover, we plan to carry out this analysis procedure on healthy and diseased eyes, in order to identify suitable markers for the identification of retinal conditions. Future work will also include further development of image processing techniques that will help us to determine the causes of changes in cone reflectance, especially over long time scales. An example includes the separation of the light reflected by the background, visible as low-frequency spatial intensity, and the individual cones, and determine if and how the two are related.
6. Conclusions
We developed a largely automated procedure for the analysis of a cone mosaic and its monitoring over time, which can be used also in clinical environments. We assessed that for the purpose of cone detection there is no significant difference in the images acquired with a light source that is within 0.35 mm off from the pupil center, which is the farthest location from the pupil center used by operators of the AO flood camera to acquire high-quality images of the cone mosaic in the clinic. In addition, the light position does not affect the ability to identify and track individual cones on a series of images. On the other hand, the time separation between two or more images makes the identification of the same cone more difficult. We determined that important changes in cone reflectance also occur on long time scales (days, months and years) and that these changes increase logarithmically with time.
Acknowledgments
Research for this work was supported by the Irish Research Council (GOIPG/2013/775), the National Framework Program for Research and Innovation PON (grant n. 01_00110), the Italian Ministry of Health (grant 5 × 1000) and Fondazione Roma.
References and links
- 1.Li K. Y., Roorda A., “Automated identification of cone photoreceptors in adaptive optics retinal images,” J. Opt. Soc. Am. A 24, 1358–1363 (2007). 10.1364/JOSAA.24.001358 [DOI] [PubMed] [Google Scholar]
- 2.Xue B., Choi S. S., Doble N., Werner J. S., “Photoreceptor counting and montaging of en-face retinal images from an adaptive optics fundus camera,” J. Opt. Soc. Am. A 24, 1364–1372 (2007). 10.1364/JOSAA.24.001364 [DOI] [PMC free article] [PubMed] [Google Scholar]
- 3.Lombardo M., Serrao S., Ducoli P., Lombardo G., “Eccentricity dependent changes of density, spacing and packing arrangement of parafoveal cones,” Ophthalmic Physiol. Opt. 33, 516–526 (2013). 10.1111/opo.12053 [DOI] [PubMed] [Google Scholar]
- 4.Lombardo M., Serrao S., Lombardo G., “Technical factors influencing cone packing density estimates in adaptive optics flood illuminated retinal images,” PLoS ONE 9, 7402 (2014). 10.1371/journal.pone.0107402 [DOI] [PMC free article] [PubMed] [Google Scholar]
- 5.Choi S. S., Doble N., Hardy J. L., Jones S. M., Keltner J. L., Olivier S. S., Werner J. S., “In vivo imaging of the photoreceptor mosaic in retinal dystrophies and correlations with visual function,” Invest. Ophthalmol. Vis. Sci. 47, 2080–2092 (2006). 10.1167/iovs.05-0997 [DOI] [PMC free article] [PubMed] [Google Scholar]
- 6.Duncan J. L., Zhang Y., Gandhi J., Nakanishi C., Othman M., Branham K. E., Swaroop A., Roorda A., “High-resolution imaging with adaptive optics in patients with inherited retinal degeneration,” Invest. Ophthalmol. Vis. Sci. 48, 3283–3291 (2007). 10.1167/iovs.06-1422 [DOI] [PubMed] [Google Scholar]
- 7.Merino D., Duncan J. L., Tiruveedhula P., Roorda A., “Observation of cone and rod photoreceptors in normal subjects and patients using a new generation adaptive optics scanning laser ophthalmoscope,” Biomed. Opt. Express 2, 2189–2201 (2011). 10.1364/BOE.2.002189 [DOI] [PMC free article] [PubMed] [Google Scholar]
- 8.Lombardo M., Parravano M., Lombardo G., Varano M., Boccassini B., Stirpe M., Serrao S., “Adaptive optics imaging of parafoveal cones in type 1 diabetes,” Retina 34, 546–557 (2014). 10.1097/IAE.0b013e3182a10850 [DOI] [PubMed] [Google Scholar]
- 9.Pallikaris A., Williams D. R., Hofer H., “The reflectance of single cones in the living human eye,” Invest. Ophthalmol. Vis. Sci. 44, 4580–4592 (2003). 10.1167/iovs.03-0094 [DOI] [PubMed] [Google Scholar]
- 10.Jonnal R. S., Rha J., Zhang Y., Gao W., Miller D. T., “In vivo functional imaging of human cone photoreceptors”, Opt. Express 15, 16141–16160 (2007). 10.1364/OE.15.016141 [DOI] [PMC free article] [PubMed] [Google Scholar]
- 11.Rha J., Schroeder B., Godara P., Carroll J., “Variable optical activation of human cone photoreceptors visualized using a short coherence light source,” Opt. Lett. 34, 3782–3784 (2009). 10.1364/OL.34.003782 [DOI] [PMC free article] [PubMed] [Google Scholar]
- 12.Jonnal R., Besecker J., Derby J., Kocaoglu O., Cense B., Gao W., Wang Q., Miller D., “Imaging outer segment renewal in living human cone photoreceptors,” Opt. Express 18, 5257–5270 (2010). 10.1364/OE.18.005257 [DOI] [PMC free article] [PubMed] [Google Scholar]
- 13.Cooper R. F., Dubis A. M., Pavaskar A., Rha J., Dubra A., Carroll J., “Spatial and temporal variation of rod photoreceptor reflectance in the human retina,” Biomed. Opt. Express 2, 2577–2589 (2011). 10.1364/BOE.2.002577 [DOI] [PMC free article] [PubMed] [Google Scholar]
- 14.Pircher M., Kroisamer J., Felberer F., Sattmann H., Götzinger E., Hitzenberger C., “Temporal changes of human cone photoreceptors observed in vivo with SLO/OCT,” Biomed. Opt. Express 2, 100–112 (2011). 10.1364/BOE.2.000100 [DOI] [PMC free article] [PubMed] [Google Scholar]
- 15.Rativa D., Vohnsen B., “Analysis of individual cone-photoreceptor directionality using scanning laser ophthalmoscopy,” Biomed. Opt. Express 2, 1423–1431 (2011). 10.1364/BOE.2.001423 [DOI] [PMC free article] [PubMed] [Google Scholar]
- 16.Bedggood P., Metha A., “Variability in bleach kinetics and amount of photopigment between individual foveal cones,” Invest. Ophthalmol. Vis. Sci. 53, 3673–3681 (2012). 10.1167/iovs.11-8796 [DOI] [PubMed] [Google Scholar]
- 17.Bedggood P., Metha A., “Optical imaging of human cone photoreceptors directly following the capture of light”, PLoS ONE 8, e79251 (2013). 10.1371/journal.pone.0079251 [DOI] [PMC free article] [PubMed] [Google Scholar]
- 18.Bruce K. S., Harmening W. M., Langston B. R., Tuten W. S., Roorda A., Sincich L. C., “Normal perceptual sensitivity arising from weakly reflective cone photoreceptors normal perceptual sensitivity of weakly reflective cones,” Invest. Ophthalmol. Vis. Sci. 56, 4431–4438 (2015). 10.1167/iovs.15-16547 [DOI] [PMC free article] [PubMed] [Google Scholar]
- 19.Godara P., Cooper R. F., Sergouniotis P. I., Diederichs M. A., Streb M. R., Genead M. A., McAnany J. J., Webster A. R., Moore A. T., Dubis A. M., Neitz M., Dubra A., Stone E. M., Fishman G. A., Han D. P., Michaelides M., Carroll J., “Assessing retinal structure in complete congenital stationary night blindness and oguchi disease,” Am. J. Ophthalmol. 154, 987–1001 (2012). 10.1016/j.ajo.2012.06.003 [DOI] [PMC free article] [PubMed] [Google Scholar]
- 20.McAllister J. T., Dubis A. M., Tait D. M., Ostler S., Rha J., Stepien K. E., Gail Summers C., Carroll J., “Arrested development: High-resolution imaging of foveal morphology in albinism,” Vision Research 50, 810–817 (2010). 10.1016/j.visres.2010.02.003 [DOI] [PMC free article] [PubMed] [Google Scholar]
- 21.Land M., Cooper R., Young J., Berg E., Kitchner T., Xiang Q., Szabo A., Ivacic L., Stepien K., Page C., Carroll J., Connor T., Brilliant M., “Cone structure in subjects with known genetic relative risk for amd,” Optom. Vis. Sci. 91, 939–949 (2014). 10.1097/OPX.0000000000000323 [DOI] [PMC free article] [PubMed] [Google Scholar]
- 22.Vohnsen B., “Photoreceptor waveguides and effective retinal image quality,” J. Opt. Soc. Am. A 24, 597–607 (2007). 10.1364/JOSAA.24.000597 [DOI] [PubMed] [Google Scholar]
- 23.Ziccardi L., Giannini D., Lombardo G., Serrao S., Dell’Omo R., Nicoletti A., Bertelli M., Lombardo M., “Multimodal approach to monitoring and investigating cone structure and function in an inherited macular dystrophy,” Am. J. Ophthalmol. 160, 301–312 (2015). 10.1016/j.ajo.2015.04.024 [DOI] [PubMed] [Google Scholar]
- 24.Miloudi C., Rossant F., Bloch I., Chaumette C., Leseigneur A., Sahel J. A., Meimon S., Mrejen S., Paques M., “The negative cone mosaic: A new manifestation of the optical stiles-crawford effect in normal eyes,” Invest. Ophthalmol. Vis. Sci. 56, 7043–7050 (2015). 10.1167/iovs.15-17022 [DOI] [PubMed] [Google Scholar]
- 25.Jonnal R. S., Kocaoglu O. P., Wang Q., Lee S., Miller D. T., “Phase-sensitive imaging of the outer retina using optical coherence tomography and adaptive optics,” Biomed. Opt. Express 3, 104–124 (2012). 10.1364/BOE.3.000104 [DOI] [PMC free article] [PubMed] [Google Scholar]
- 26.Jacob J., Paques M., Krivosic V., Dupas B., Couturier A., Kulcsar C., Tadayoni R., Massin P., Gaudric A., “Meaning of visualizing retinal cone mosaic on adaptive optics images,” Am. J. Ophthalmol. 159, 118–123 (2015). 10.1016/j.ajo.2014.09.043 [DOI] [PubMed] [Google Scholar]
- 27.Burns S. A., Wu S., Delori F., Elsner A. E., “Direct measurement of human-cone-photoreceptor alignment,” J. Opt. Soc. Am. A, 12, 2329–2338 (1995). 10.1364/JOSAA.12.002329 [DOI] [PubMed] [Google Scholar]
- 28.Roorda A., Williams D. R., “Optical fiber properties of individual human cones,” J. Vis., 2, 404–412 (2002). 10.1167/2.5.4 [DOI] [PubMed] [Google Scholar]
- 29.Gao W., Cense B., Zhang Y., Jonnal R. S., Miller D. T., “Measuring retinal contributions to the optical Stiles-Crawford effect with optical coherence tomography”, Opt. Express, 16, 6486–6501 (2008). 10.1364/OE.16.006486 [DOI] [PMC free article] [PubMed] [Google Scholar]
- 30.Vohnsen B., “Directional sensitivity of the retina: A layered scattering model of outer-segment photoreceptor pigments,” Biomed. Opt. Express 5, 1569–1587 (2014). 10.1364/BOE.5.001569 [DOI] [PMC free article] [PubMed] [Google Scholar]
- 31.Mariotti L., Devaney N., “Performance analysis of cone detection algorithms,” J. Opt. Soc. Am. A 32, 497–506 (2015). 10.1364/JOSAA.32.000497 [DOI] [PubMed] [Google Scholar]
- 32.Muthiah M. N., Gias C., Chen F. K., Zhong J., McClelland Z., Sallo F. B., Peto T., Coffey P. J., da Cruz L., “Cone photoreceptor definition on adaptive optics retinal imaging”, Br J Ophthalmol, 98(8), 1073–1079 (2014) 10.1136/bjophthalmol-2013-304615 [DOI] [PMC free article] [PubMed] [Google Scholar]
- 33.Ramaswamy G., Devaney N., “Pre-processing, registration and selection of adaptive optics corrected retinal images,” Ophthalmic Physiol. Opt. 33, 527–539 (2013). 10.1111/opo.12068 [DOI] [PubMed] [Google Scholar]
- 34.Chiu S. J., Lokhnygina Y., Dubis A. M., Dubra A., Carroll J., Izatt J. A., Farsiu S., “Automatic cone photoreceptor segmentation using graph theory and dynamic programming,” Biomed. Opt. Express 4, 924–937 (2013). 10.1364/BOE.4.000924 [DOI] [PMC free article] [PubMed] [Google Scholar]
- 35.Wolberg G., Zokai S., “Robust image registration using log-polar transform,” in 2000 International Conference on Image Processing, (IEEE, 2000), vol. 1, pp. 493–496. [Google Scholar]
- 36.Mariotti L., Devaney N., “Cone detection and blood vessel segmentation on AO retinal images,” in IRISH MACHINE VISION & IMAGE PROCESSING Conference proceedings 2015, Dahyot R., Lacey G., Dawson-Howe K., Pitié F., Moloney D., eds. (Irish Pattern Recognition & Classification Society, 2015), pp. 126–128. [Google Scholar]
- 37.Babcock H. W., “The possibility of compensating astronomical seeing,” Publications of the Astronomical Society of the Pacific 65, 229–236 (1953). 10.1086/126606 [DOI] [Google Scholar]
- 38.Panda-Jonas S., Jonas J. B., Jakobczyk-Zmija M., “Retinal photoreceptor density decreases with age,” Ophthalmology 102, 1853–1859 (1995). 10.1016/S0161-6420(95)30784-1 [DOI] [PubMed] [Google Scholar]
- 39.Godara P., Dubis A. M., Roorda A., Duncan J. L., Carroll J., “Adaptive optics retinal imaging: emerging clinical applications,” Optom. Vis. Sci. 87, 930 (2010). 10.1097/OPX.0b013e3181ff9a8b [DOI] [PMC free article] [PubMed] [Google Scholar]
- 40.Lombardo M., Serrao S., Devaney N., Parravano M., Lombardo G., “Adaptive optics technology for high-resolution retinal imaging,” Sensors (Switzerland) 13, 334–366 (2013). 10.3390/s130100334 [DOI] [PMC free article] [PubMed] [Google Scholar]


