Abstract
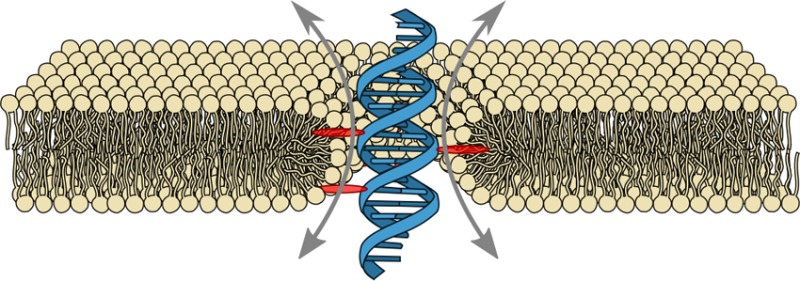
Because of their hollow interior, transmembrane channels are capable of opening up pathways for ions across lipid membranes of living cells. Here, we demonstrate ion conduction induced by a single DNA duplex that lacks a hollow central channel. Decorated with six porpyrin-tags, our duplex is designed to span lipid membranes. Combining electrophysiology measurements with all-atom molecular dynamics simulations, we elucidate the microscopic conductance pathway. Ions flow at the DNA–lipid interface as the lipid head groups tilt toward the amphiphilic duplex forming a toroidal pore filled with water and ions. Ionic current traces produced by the DNA-lipid channel show well-defined insertion steps, closures, and gating similar to those observed for traditional protein channels or synthetic pores. Ionic conductances obtained through simulations and experiments are in excellent quantitative agreement. The conductance mechanism realized here with the smallest possible DNA-based ion channel offers a route to design a new class of synthetic ion channels with maximum simplicity.
Keywords: DNA nanotechnology, lipid membrane, porphyrin, synthetic ion channel, molecular dynamics
The function of every living cell relies on protein ion channels that provide controlled ion pathways between the cell’s membranous compartments.1 Ion channels have been conceived as hollow proteins traversing the hydrophobic lipid membrane and thereby opening up a passage for ions within the channel lumen. This conductance mechanism is supported by crystal structures of channels like the potassium channel.2 Another important class of transmembrane proteins, including single-pass α-helical proteins3,4 or G-protein coupled receptors,5,6 lack such a physical channel. They rely on extracellular signaling molecules to cause an intracellular response without exchanging ions or substrates between cellular compartments.
Here, we demonstrate a synthetic membrane-spanning construct that provides a direct ion pathway across the lipid membrane despite the lack of an internal physical channel. This was achieved by designing a membrane-spanning DNA duplex that causes the formation of a stable toroidal DNA-lipid channel (DLC) as illustrated in Figure 1A.
Figure 1.
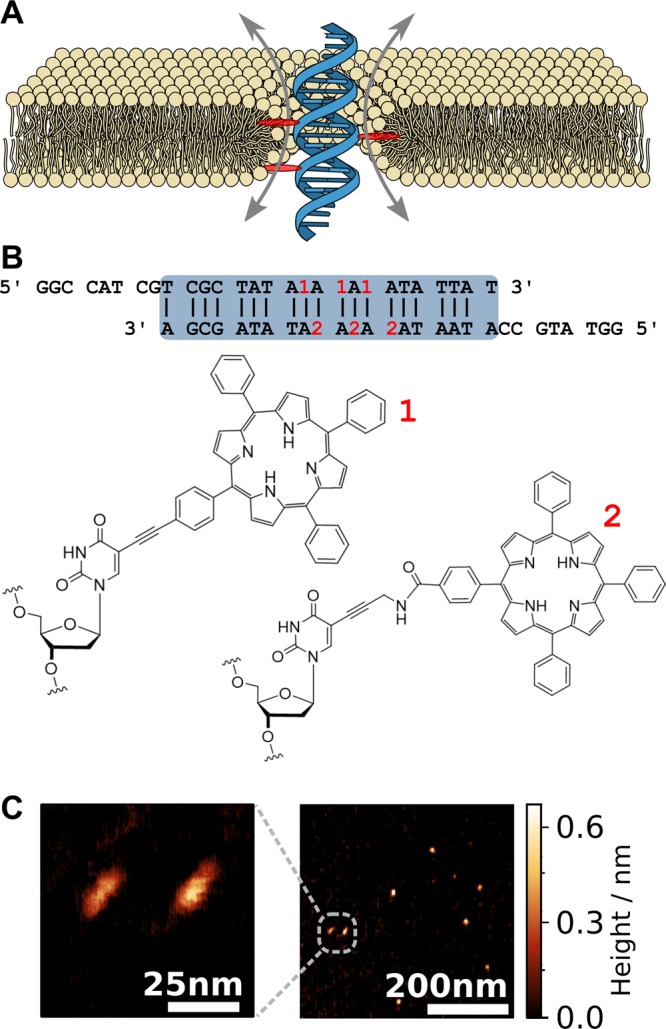
Design, shape, and dimensions of the membrane-spanning DNA duplex. (A) Envisioned placement and conductance mechanism of the DNA duplex (blue) decorated with six porphyrin membrane anchors (red, only three shown in cross section) causing the formation of a toroidal lipid pore (yellow). The sketch is roughly drawn to scale. (B) The nucleotide sequence of the duplex. The locations of the porphyrin tags within the sequence are indicated in red. The bottom row shows the chemical structures of the tags labeled as 1 (with acetylene linker) and 2 (with amide linker) according to the target strand. (C) AFM images of the duplex structures adsorbed onto mica and imaged in air.
DNA has previously been used as a highly stable and readily available chemical building block for synthetic transmembrane pores with nominal inner diameters of 0.87 and 2 nm.8−12 While molecular dynamics (MD) simulations of these DNA pores have shown that ions are transported through the central channel lumen, it appears that a fraction of the current flows through gaps at the DNA–lipid interface.13 Relying on these insights, we deduced a clear design strategy for a DNA duplex that could form a stable DLC. With their hydrophobic transmembrane domains, proteins are generally believed to traverse the membrane by displacing lipids rather than reorganizing the bilayer structure.14 To favor a conformation where the two lipid bilayer leaflets form a toroidal pore with a DNA duplex at the center, we positioned hydrophoic porphyrin tags on the duplex in such a way that their insertion into the lipid membrane is only possible when the charged duplex is penetrating the membrane. We chose a 19 base-pair long duplex with six hydrophobic porphyrins attached to thymidine bases in a manner so that they protrude the duplex and act as membrane anchors, Figure 1B.15,16 The porphyrins were attached to both complementary strands to form a zipper-like stable arrangement (for synthesis and HPLC traces see Supporting Information, Note S1, Table S1, and Figures S1 and S2).17 Eight bases of single-stranded extensions were incorporated as extra-membranous domains on either end of the duplex to highlight possibilities for customization through hybridization to the ssDNA handle (sticky end). These design features were inspired by bitopic proteins with a single transmembrane α-helix composed of around 20 amino acid molecules that connect two extra-membranous domains.3,18 With a molecular weight below 20 kDa, our duplex is almost an order of magnitude lighter than previous DNA nanopores.7−12 Despite its short length of only 5 nm, we were able to image the duplex using atomic force microscopy (AFM) as shown in Figure 1C (Supporting Information, Note 2). Image analysis (n = 33) gave a length of 4.5 ± 0.1 nm and a width of 2.3 ± 0.02 nm. The apparent height of 0.8 ± 0.2 nm agrees well with literature values for a DNA duplex imaged in air.19
To confirm the interaction of the porphyrin-tagged duplexes with lipid membranes, we demonstrated their binding to giant unilamellar vesicles (GUVs, Supporting Information, Note S3) by confocal fluorescent imaging (Supporting Information, Note S4). For this purpose, we took advantage of the fluorescence of porphyrin itself.10 After addition of the duplexes, bright rings appeared around the vesicles in the confocal plane, Figure 2A, indicating their adhesion to the membranes. As a negative control, we prepared a duplex with a fluorescent Cy3-tag on both 3′ ends but without porphyrin tags. As expected, the GUVs appeared dark, Figure 2B.
Figure 2.
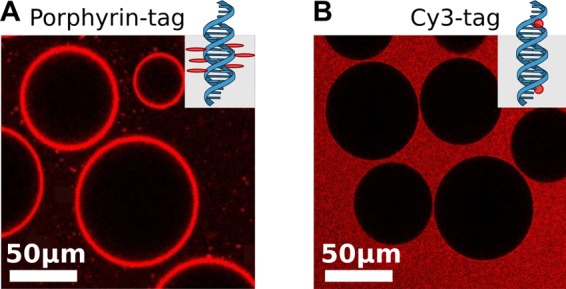
Fluorescent confocal images (excitation wavelength: 514 nm) of DphPC lipid vesicles after addition of (A) the porphyrin-tagged duplex, c = 5 nM and (B) a duplex with two Cy3-tags but no porphyrin tags, c = 5 nM (negative control).
To test whether the duplex is capable of inducing a passage for ions across the lipid membrane despite lacking a physical pore, we carried out ionic current recordings in solvent containing membranes (Supporting Information, Note S5).20 As shown in Figure 3A, stepwise increases in conductance (insertions steps) were observed in the presence of the duplex. Closure steps, Figure 3B, where the membrane returns to its native conductance, are often observed as a result of increasing the applied voltage. While the induced transmembrane currents could be stable for hours, we also observed transient currents and current fluctuations between distinct values, Figure 3C, reminiscent of gating observed for natural ion channels (for additional ionic current traces see Supporting Information, Figure S5). The Gauss-fit of the histogram obtained from conductance steps, Figure 3D, peaks at a conductance of 80 pS. To obtain the current–voltage characteristics, Figure 3E, we only took stable insertions into account, where the DLC did not switch conductance state between −100 and +100 mV. While these traces exhibit ohmic behavior, deviations from ohmic behavior, such as gating, closures, or additional insertions, are often observed above ±50 mV. For our subset of stable insertions, the linear fit (dashed line) has a slope of 100 pS. Control experiments with DNA duplexes with terminal membrane anchors did not form stable DLCs (Supporting Information, Figure S3, Notes S7 and S8).
Figure 3.
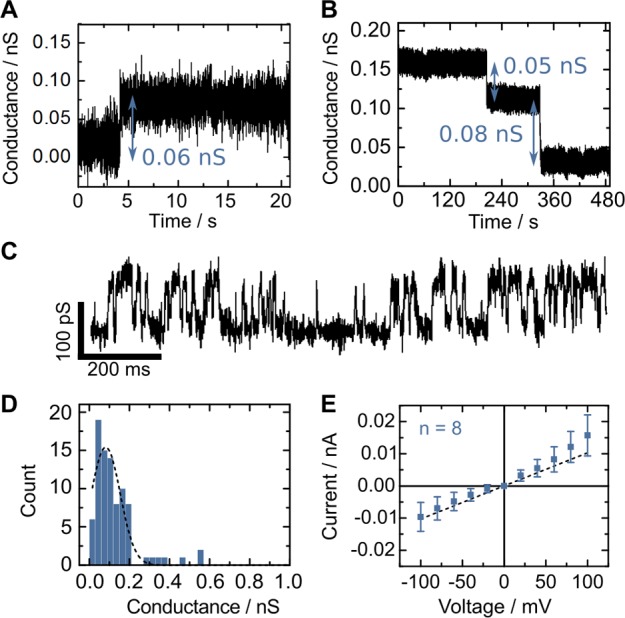
Ionic current recordings of the porphyrin-tagged duplex in 1 M KCl, 10 mM MES, pH 6.0. Exemplary current traces showing (A) an insertion at 50 mV, (B) two consequtive closure steps at 50 mV, and (C) gating behavior at 100 mV. (D) Histogram of conductance steps obtained from current traces of the duplex. The dashed line represents a Gaussian fit which peaks at 80 pS. (E) Current–voltage characteristics of stable insertions of the duplex. Error bars correspond to the standard deviation of 8 independent recordings. The dashed line represents a linear fit.
To independently evaluate the DLC’s ionic conductance, we built an all-atom model of the duplex embedded in a DphPC lipid bilayer submerged in 1 M aqueous solution of KCl analogous to the experimental conditions, Figure 4A (Supporting Information, Note S6). The system was simulated by restraining the duplex to its initial coordinates in the membrane for the first 48 ns. The restraints were gradually removed over ∼15 ns, following which the duplex was simulated for ∼140 ns in the absence of any restraints. During the equilibration simulations (Supporting Information, Note S6), lipid molecules rearranged around the transmembrane part of the duplex, forming a narrow water-filled passage in its circumference, Figure 4B and Supporting Information, Figure S6. Approximately 100 water molecules were found on average surrounding the duplex within a 1 nm thick rectangular slab centered at the middle plane of the membrane. The Supporting Information Movie S1, Note S9, illustrates the MD trajectory of the system showing the formation of a toroidal lipid pore around the duplex.
Figure 4.
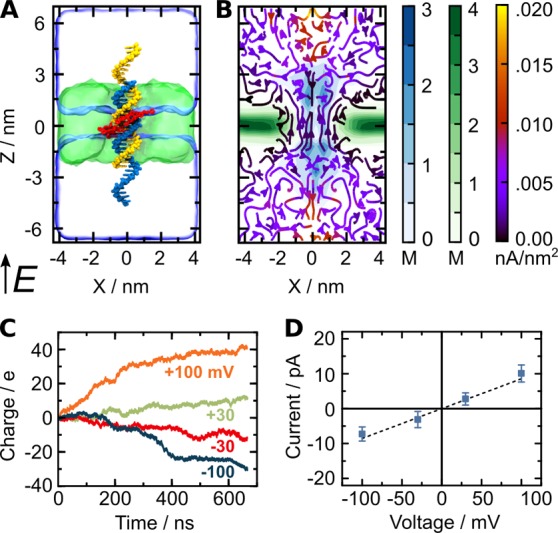
MD simulations of the duplex-induced DLC. (A) All-atom models of the duplex with hydrophobic tags (red) embedded in a lipid membrane (green) before equilibration. The system contains magnesium ions in an amount sufficient to neutralize the electrical charge of the duplex and 1 M KCl solution (not shown). Total system size: 140 630 atoms. Electric field E in direction of positive transmembrane bias is indicated. (B) Steady-state local densities of lipid chain (carbon atoms, green), DNA (phosphorus atoms, blue), and ionic current (streamlines). The arrows indicate the direction of the local ionic current flux and the colors show the flux’ magnitude. The maps were computed from a 672 ns MD trajectory at a + 100 mV bias sampled with a frequency of 240 ps per frame; radially averaged about the central axis of the duplex (z-axis) to improve the resolution. (C) Cumulative charge transmitted across the lipid bilayer at +100 mV (orange), +30 mV (green), −30 mV (red), and −100 mV (blue) transmembrane biases. The instantaneous currents were sampled every 2.4 ps. The cumulative charge curves were obtained by integrating the respective instantaneous current curves versus simulation time. (D) The simulated current–voltage characteristics. To compute the error, instantaneous ionic currents were block averaged with a block size of 9.6 ns. The error bars were computed as the standard error of the mean of the block averaged values. The dashed line represents a linear fit.
The ionic conductance of the DLC was determined by applying an external electric field across the lipid bilayer and measuring the instantaneous displacement of ions within the MD trajectories (Supporting Information, Note S6).13,21,22 Reproducing the experimental conditions, the system was simulated at +100, +30, −30, and −100 mV transmembrane biases for ∼670 ns at each bias. Figure 4C displays the cumulative charge transmitted across the DLC as a function of the simulation time at different transmembrane voltages. The slope of each curve gives the average ionic current (for conductance histograms see Supporting Information, Figure S7). The simulated ionic currents exhibit considerable variations during individual MD trajectories, which we attribute to changing geometry of the DNA duplex–lipid bilayer interface. The plot of the average current versus transmembrane voltage, Figure 4D, yields an average simulated conductances of 95 pS. This is in excellent quantitative agreement with the experimental conductance (100 pS).
Because our membrane-inserting duplex lacks a central channel, it is fundamentally different from previous DNA-based membrane pores that were composed of either four7 or six8−12 interconnected duplexes. Yet the insights gained from this study are essential for further development of this emerging class of synthetic membrane pores and settle the ongoing debate regarding the pathway of ions through DNA membrane pores.8,11,23 DLCs are expected to contribute to the total conductance of all DNA-based pores that feature an amphiphilic transmembrane domain. The total conductance of DNA pores is thus the sum of the conductance through the central pore and through the toroidal lipid pore surrounding it. The relative contributions of these two conductance pathways will depend on the pore circumference relative to its area, as well as the hydrophobicity of its exterior. In line with this argument, experiments and simulations yield lower conductances for the duplex-induced lipid channel (≤100 pS) compared to reports of previous DNA channels (0.25–1.6 nS7−12). The ionic current characteristics of the duplex-induced DLCs show similarities with larger DNA pores, such as ohmic IV behavior in the lower voltage range,7−12 closures at higher voltages,7,11,12 and relatively widespread conductance values.7,9 Amphiphilic peptides are known to destabilize lipid membranes24 or change bilayer thickness.25 Our DLCs differ substantially from the amphiphilic peptides channels as DLCs exhibit stable and higher magnitude currents. Toroidal lipid pores have been observed previously, for instance, induced by a genetically engineered α-hemolysin pore with a truncated stem.14 Here, we provide evidence that not only peripheral but also integral membrane components can cause the reorientation of lipids and thereby formation of ion pathways lined by the lipid head groups themselves. Although our DNA duplex-induced channel and the genetically engineered α-hemolysin protein are both man-made, they provide evidence that alternative conductance pathways without a physical channel may also exist in biological systems. Indeed, it has been suggested that toroidal lipid pores, transient or stable, can be induced by amphiphilic antimicrobial peptides,26,27 by anion channels in the TMEM16/ANO superfamily,28 amyloid protein aggregates,29 the HIV-1 TAT peptide,30 and due to spontaneous density fluctuations within a membrane near its phase-transition observed in experiments31 and simulations.32
By probing ion flux induced by a single DNA duplex in experiments and elucidating the microscopic ion pathway in MD simulations, we gain fundamental understanding of ion conduction mechanisms across lipid membranes. Our results are of direct relevance to the ongoing debate on the physiological role of lipid channels, especially in the context of Alzheimer’s disease29 and immune response.26,27 Furthermore, as a duplex is stable across a wider range of conditions compared to DNA origami, it is ideally suited for applications that require specific buffers, like cell culture. Single-stranded overhangs protruding from the membrane could serve as customizable extra-membranous domains for cellular targeting and stimuli-response. Extramembranous domains could be modified to target cellular receptors or serve as metastable binding sites for signaling molecules, highlighting the level of customizability of this versatile albeit minimalistic design. Substrate-induced oligomerization will enable the creation of smaller and larger duplex-based assemblies in cellular environments. With this insightful combination of goal-oriented design, reverse-engineering, single-molecule experiments, and all-atom simulations, we expect DLCs to contribute to our understanding of ion-conduction across lipid membranes and to our ability to control it.
Acknowledgments
K.G. acknowledges funding from the Winton Programme for the Physics of Sustainability, Gates Cambridge, and the Oppenheimer Ph.D. studentship, U.F.K. from an ERC starting Grant Passmembrane 261101 and Oxford Nanopore Technologies, and M.R. from the Early Postdoc Mobility fellowship of the Swiss National Science Foundation. A.A., J.Y., and C.Y.L. acknowledge support form the National Science Foundation under Grants DMR-1507985, PHY-1430124, and EEC-1227034 and the supercomputer time provided through XSEDE Allocation Grant MCA05S028 and the Blue Waters petascale supercomputer system (UIUC). M.W. and S.P.B. acknowledge support from Marie Skłodowska Curie Actions within the Initial Training Networks Translocation Network, project no. 607694 and I.M. from the Marie Skłodowska Curie Fellowship “Nano-DNA” (FP7-PEOPLE-2012-IEF, No 331952).
Supporting Information Available
The Supporting Information is available free of charge on the ACS Publications website at DOI: 10.1021/acs.nanolett.6b02039.
Materials and methods for the design and synthesis of the porphyrin-tagged duplex, AFM, lipid vesicle preparation, confocal fluorescent imaging, ionic current recordings and MD simulations. Chemical diagrams for the synthesis pathway of the porphyrin nucleotides and corresponding HPLC traces. Control experiments with other DNA duplex designs and additional ionic current traces. Conductance histograms obtained from MD simulations.(PDF)
Molecular dynamics simulation of the DNA duplex in a lipid bilayer membrane. (AVI)
The authors declare no competing financial interest.
Supplementary Material
References
- Alberts B.; Johnson A.; Lewis J.; Raff M.; Roberts K.; Walter P.. Molecular Biology of the Cell. 2002; http://www.ncbi.nlm.nih.gov/books/NBK21054/.
- Doyle D. A.; Cabral J. M.; Pfuetzner R. A.; Kuo A.; Gulbis J. M.; Cohen S. L.; Chait B. T.; MacKinnon R. Science 1998, 280, 69–77. 10.1126/science.280.5360.69. [DOI] [PubMed] [Google Scholar]
- Hubert P.; Sawma P.; Duneau J.-P.; Khao J.; Hénin J.; Bagnard D.; Sturgis J. Cell Adh. Migr. 2010, 4, 313–324. 10.4161/cam.4.2.12430. [DOI] [PMC free article] [PubMed] [Google Scholar]
- Zviling M.; Kochva U.; Arkin I. T. Biochim. Biophys. Acta, Biomembr. 2007, 1768, 387–392. 10.1016/j.bbamem.2006.11.019. [DOI] [PubMed] [Google Scholar]
- Cherezov V.; Rosenbaum D. M.; Hanson M. A.; Rasmussen S. G. F.; Thian F. S.; Kobilka T. S.; Choi H.-J.; Kuhn P.; Weis W. I.; Kobilka B. K.; Stevens R. C. Science 2007, 318, 1258–1265. 10.1126/science.1150577. [DOI] [PMC free article] [PubMed] [Google Scholar]
- Strange P. G. Biochem. Pharmacol. 1999, 58, 1081–1088. 10.1016/S0006-2952(99)00144-6. [DOI] [PubMed] [Google Scholar]
- Göpfrich K.; Zettl T.; Meijering A. E. C.; Hernández-Ainsa S.; Kocabey S.; Liedl T.; Keyser U. F. Nano Lett. 2015, 15, 3134–3138. 10.1021/acs.nanolett.5b00189. [DOI] [PubMed] [Google Scholar]
- Langecker M.; Arnaut V.; Martin T. G.; List J.; Renner S.; Mayer M.; Dietz H.; Simmel F. C. Science 2012, 338, 932–6. 10.1126/science.1225624. [DOI] [PMC free article] [PubMed] [Google Scholar]
- Burns J. R.; Stulz E.; Howorka S. Nano Lett. 2013, 13, 2351–2356. 10.1021/nl304147f. [DOI] [PubMed] [Google Scholar]
- Burns J. R.; Göpfrich K.; Wood J. W.; Thacker V. V.; Stulz E.; Keyser U. F.; Howorka S. Angew. Chem., Int. Ed. 2013, 52, 12069–72. 10.1002/anie.201305765. [DOI] [PMC free article] [PubMed] [Google Scholar]
- Seifert A.; Göpfrich K.; Burns J. R.; Fertig N.; Keyser U. F.; Howorka S. ACS Nano 2015, 9, 1117–1126. 10.1021/nn5039433. [DOI] [PMC free article] [PubMed] [Google Scholar]
- Burns J. R.; Seifert A.; Fertig N.; Howorka S. Nat. Nanotechnol. 2016, 11, 152–156. 10.1038/nnano.2015.279. [DOI] [PubMed] [Google Scholar]
- Yoo J.; Aksimentiev A. J. Phys. Chem. Lett. 2015, 6, 4680–4687. 10.1021/acs.jpclett.5b01964. [DOI] [PubMed] [Google Scholar]
- Stoddart D.; Ayub M.; Höfler L.; Raychaudhuri P.; Klingelhoefer J. W.; Maglia G.; Heron A.; Bayley H. Proc. Natl. Acad. Sci. U. S. A. 2014, 111, 2425–30. 10.1073/pnas.1312976111. [DOI] [PMC free article] [PubMed] [Google Scholar]
- Fendt L. A.; Bouamaied I.; Thöni S.; Amiot N.; Stulz E. J. Am. Chem. Soc. 2007, 129, 15319–15329. 10.1021/ja075711c. [DOI] [PubMed] [Google Scholar]
- Brewer A.; Siligardi G.; Neylon C.; Stulz E. Org. Biomol. Chem. 2011, 9, 777–782. 10.1039/C0OB00535E. [DOI] [PubMed] [Google Scholar]
- Nguyen T.; Brewer A.; Stulz E. Angew. Chem., Int. Ed. 2009, 48, 1974–1977. 10.1002/anie.200805657. [DOI] [PubMed] [Google Scholar]
- Brandizzi F.; Frangne N.; Marc-Martin S.; Hawes C.; Neuhaus J.-M.; Paris N. Plant Cell 2002, 14, 1077–1092. 10.1105/tpc.000620. [DOI] [PMC free article] [PubMed] [Google Scholar]
- Thundat T.; Allison D. P.; Warmack R. J. Nucleic Acids Res. 1994, 22, 4224–4228. 10.1093/nar/22.20.4224. [DOI] [PMC free article] [PubMed] [Google Scholar]
- Gutsmann T.; Heimburg T.; Keyser U.; Mahendran K. R.; Winterhalter M. Nat. Protoc. 2014, 10, 188–198. 10.1038/nprot.2015.003. [DOI] [PubMed] [Google Scholar]
- Aksimentiev A. Nanoscale 2010, 2, 468–483. 10.1039/b9nr00275h. [DOI] [PMC free article] [PubMed] [Google Scholar]
- Li C. Y.; Hemmig E. A.; Kong J.; Yoo J.; Keyser U. F.; Aksimentiev A. ACS Nano 2015, 9, 1420–1433. 10.1021/nn505825z. [DOI] [PMC free article] [PubMed] [Google Scholar]
- Maingi V.; Lelimousin M.; Howorka S.; Sansom M. S. P. ACS Nano 2015, 9, 11209–11217. 10.1021/acsnano.5b06357. [DOI] [PubMed] [Google Scholar]
- Ashrafuzzaman M.; Lampson M. A.; Greathouse D. V.; Koeppe R. E.; Andersen O. S. J. Phys.: Condens. Matter 2006, 18, 1235–1255. 10.1088/0953-8984/18/28/S08. [DOI] [Google Scholar]
- Andersen O. S.; Koeppe R. E. Annu. Rev. Biophys. Biomol. Struct. 2007, 36, 107–130. 10.1146/annurev.biophys.36.040306.132643. [DOI] [PubMed] [Google Scholar]
- Ludtke S. J.; He K.; Heller W. T.; Harroun T. A.; Yang L.; Huang H. W. Biochemistry 1996, 35, 13723–13728. 10.1021/bi9620621. [DOI] [PubMed] [Google Scholar]
- Matsuzaki K.; Murase O.; Fujii N.; Miyajima K. Biochemistry 1996, 35, 11361–11368. 10.1021/bi960016v. [DOI] [PubMed] [Google Scholar]
- Whitlock J. M.; Hartzell H. C. Pfluegers Arch. 2016, 468, 455–473. 10.1007/s00424-015-1777-2. [DOI] [PMC free article] [PubMed] [Google Scholar]
- Demuro A.; Smith M.; Parker I. J. Cell Biol. 2011, 195, 515–524. 10.1083/jcb.201104133. [DOI] [PMC free article] [PubMed] [Google Scholar]
- Herce H. D.; Garcia A. E. Proc. Natl. Acad. Sci. U. S. A. 2007, 104, 20805–10. 10.1073/pnas.0706574105. [DOI] [PMC free article] [PubMed] [Google Scholar]
- Mosgaard L. D.; Heimburg T. Acc. Chem. Res. 2013, 46, 2966–76. 10.1021/ar4000604. [DOI] [PubMed] [Google Scholar]
- Bennett W. F. D.; Sapay N.; Tieleman D. P. Biophys. J. 2014, 106, 210–219. 10.1016/j.bpj.2013.11.4486. [DOI] [PMC free article] [PubMed] [Google Scholar]
Associated Data
This section collects any data citations, data availability statements, or supplementary materials included in this article.


