Abstract
Background
Fructose intake is associated with NAFLD (Non-Alcoholic Fatty Liver Disease) development.
Objective
To measure fructose absorption/metabolism in pediatric NAFLD compared to obese and lean controls.
Methods
Children with histologically proven NAFLD, and obese and lean controls received oral fructose (1 gm/kg ideal body weight). Serum glucose, insulin, uric acid, and fructose, urine uric acid, urine fructose, and breath hydrogen levels were measured at baseline and multiple points until 360 minutes after fructose ingestion.
Results
Nine NAFLD (89% Hispanic, mean age 14.3 years, mean BMI 35.3 kg/m2), 6 Obese Controls (67% Hispanic, mean age 12.7 years, mean BMI 31.0 kg/m2), and 9 Lean Controls (44% Hispanic, mean age 14.3 years, mean BMI 19.4 kg/m2) were enrolled. Following fructose ingestion, NAFLD vs. Lean Controls had elevated serum glucose, insulin, and uric acid (p<0.05), higher urine uric acid (p=0.001) but lower fructose excretion (p=0.002) and lower breath hydrogen 180-min AUC (p=0.04). NAFLD vs. Obese Controls had similar post-fructose serum glucose, insulin, urine uric acid, and breath hydrogen, but elevated serum uric acid (p<0.05) and lower urine fructose excretion (p=0.02).
Conclusions
Children with NAFLD absorb and metabolize fructose more effectively than lean subjects, associated with an exacerbated metabolic profile following fructose ingestion.
Keywords: Obesity, breath hydrogen, hyperuricemia, malabsorption
Introduction
Non-alcoholic fatty liver disease (NAFLD), a spectrum of liver diseases encompassing steatosis, non-alcoholic steatohepatitis (NASH), and cirrhosis, is the most common liver disease in American children, affecting up to 38% of obese children 1.
Recently, NAFLD has been associated with fructose consumption 2. Fructose, a sugar found in fruits and honey, is a component of added sweeteners including sucrose and high fructose corn syrup. Intake of added sweeteners increased 50% between 1970–2004 and is associated with obesity, hypertension, and metabolic syndrome3. High fructose intake in rats causes hepatic steatosis4. In humans, fructose intake is linked with increased hepatic fructokinase expression, hepatic ATP depletion, hepatic fibrosis, and dyslipidemia 2, 4–6.
Children are known to have limited intestinal absorption capacity for fructose 7. This led us to hypothesize that children with NAFLD may better absorb fructose compared to children without NAFLD, possibly contributing to the pathogenesis of NAFLD. Interestingly, malabsorption of fructose was recently reported to be associated with reduced risk of NAFLD in African American adults 8. Therefore, the objective of this study was to determine fructose absorption and its metabolic consequences following fructose ingestion in children with NAFLD compared to obese and lean controls.
Methods
Subjects
Twenty-four subjects recruited from Children’s Hospital Colorado in Aurora and Denver Health and Hospitals in Denver, Colorado, participated in the study. All subjects were ages 8–18 years and Tanner pubertal stage 2–4. NAFLD subjects had BMI >95%ile for age and gender, histologically confirmed NAFLD on liver biopsy performed within 6 months prior to enrollment, and were excluded if they experienced >5% weight loss from the time of liver biopsy. Obese Control subjects had BMI >95%ile for age and gender, ALT ≤40 IU/mL and a hepatic ultrasound that demonstrated normal hepatic echogenicity. Lean Control subjects had BMI 10–85%ile for age and gender. For all three study groups, subjects with other liver diseases, pregnancy, history of gout, renal disease, or diabetes, use of antibiotics or alcohol within 2 weeks of the study or use of insulin sensitizing agents, antioxidant therapy, anti-hyperlipidemic agents, or xanthine oxidase inhibitors, were excluded. At enrollment, demographics, history, physical, and anthropometric (height, weight, hip and waist circumference) data were obtained. Anthropometrics were collected by the research dietician. Weight and height included clothes but not shoes. Blood pressures were measured using an appropriate cuff size for each patient 9.
The Scientific Advisory and Review Committee and the Colorado Multiple Institutional Review Board of the University of Colorado approved the experimental protocol. Written informed consent and assent were obtained from parents and subjects prior to enrollment.
Oral Fructose Challenge
Subjects were asked to abstain from sugar-sweetened foods and beverages for 24 hours prior to the oral fructose challenge. Each subject was admitted to the Clinical Translational Research Center at Children’s Hospital Colorado (January 2011-August 2012). Following an observed 8 hour fast, at 0600 all subjects were administered fructose (Quintron, Milwaukee, WI, 1 gm/kg based on ideal body weight; maximum 75 gm) dissolved in 8 oz of water.10 Following fructose ingestion, subjects continued to fast for 6 hours.
Blood samples were drawn prior to fructose consumption and at 30, 60, 90, 120, 180, 270, and 360 minutes post fructose consumption. Serum glucose, triglyceride, free fatty acids, uric acid and fructose concentrations were measured at each time point. Fructose concentrations were measured using the EnzyChrom™ Fructose Assay Kit (BioAssay Systems, Hayward, CA) 11. Insulin was measured at baseline and at 30, 60, 90, and 120 minutes post fructose ingestion.
Breath hydrogen testing was performed on each patient to assess for fructose malabsorption. Samples of exhaled air were collected at baseline prior to the fructose challenge and at 30, 60, 90, 120, 150, and 180 minutes post fructose consumption 12, and analyzed for hydrogen (Breathtracker/GaSampler System, Quintron, Milwaukee, WI). Results were expressed as parts per million (ppm). A breath test was considered positive if baseline breath hydrogen values were < 20 ppm and there was an increase of breath hydrogen from baseline ≥20 ppm during the study.
First morning urine was collected at baseline before fructose administration. A pooled collection of urine was obtained from ingestion of fructose to completion of the oral fructose challenge, at which time subjects were instructed to urinate. Urine fructose concentrations were measured using the EnzyChrom™ Fructose Assay Kit. Urine creatinine and uric acid concentrations were analyzed on an Alfa Wassermann autoanalyzer (ACE, West Caldwell, NJ). Urine fructose and uric acid were normalized per gram of urine creatinine.
Descriptive statistics were used to present data as mean ± SD. Comparisons were made using ANOVA (analysis of variance) for continuous variables and Chi Square tests for dichotomous outcomes. Univariate analyses were performed on breath hydrogen levels and serum fructose, uric acid, free fatty acids, triglycerides, insulin, and glucose. Comparisons between the groups were analyzed by ANOVA. A mixed effects model was used to investigate the interrelationship between outcome variables with repeated measures and change over the sampling period. Changes in serum variables following oral ingestion of fructose were described as change from baseline to peak (Δ variable) and the area under the curve (AUC) calculated by the trapezoid rule subtracting the time 0 (baseline) values from each subsequent measured value.
Results
Clinical Characteristics of the Study Population
Twenty-four children enrolled in the study (9 NAFLD, 6 Obese Controls, and 9 Lean Controls). Based on NASH Clinical Research Network scoring 13, mean NAFLD Activity Score (NAS) was 5 ± 1.2, with 7 subjects with definitive NASH (NAS ≥5) and 2 with probable NASH (NAS 3–5). The groups were similar with respect to age, race, and ethnicity (Table 1). Lean Controls had lower BMI, BMI z-score, and waist circumference than both NAFLD and Obese Controls (p<0.01). Systolic blood pressure was higher in NAFLD vs. Lean Controls (p=0.005). At baseline, NAFLD had higher fasting uric acid and glucose levels compared with Obese and Lean Controls (Table 1, p<0.05). Baseline breath hydrogen levels were higher in Obese vs. Lean Controls.
Table 1.
Baseline demographic, anthropometric and laboratory data.
| NAFLD (n=9) | Obese Control (n=6) | Lean Control (n=9) | |
|---|---|---|---|
|
| |||
| Age (yr) | 14.3 | 12.7 | 14.3 |
| Male (%) | 5 (56%) | 3 (50%) | 4 (44%) |
| Hispanic (%) | 8 (89%) | 4 (67%) | 4 (44%) |
| BMI (kg/m2) | 35.3* | 31* | 19.4 |
| BMI z score | 2.3* | 2.1* | −0.2 |
| Waist Circumference (cm) | 112.9# | 96.2# | 70# |
| Waist:Hip Circumference ratio | 0.97 | 0.94 | 0.94 |
| Systolic BP (mmHg) | 122 § | 116 | 106 |
| Diastolic BP (mmHg) | 70 | 66 | 64 |
| Glucose (mg/dL) | 87.0 ± 5.5 | 86.7 ± 13.0 | 79.8 ± 7.0 |
| Insulin (μU/mL) | 26.5 ± 35.5 | 14.2 ± 5.4 | 9.7 ± 16.2 |
| Triglycerides (mg/dL) | 121.4 ± 29.2 | 132.0 ± 59.3 | 89.3 ± 38.8 |
| Free Fatty Acids (μEq/L) | 519.4 ± 103.4 | 591.2 ± 146.5 | 570.7 ± 242.8 |
| Uric Acid (mg/dL) | 7.5 ± 1.4+ | 6.1 ± 1.6+ | 4.5 ± 1.6+ |
| Fructose (μM) | 40.6 ± 26.6 | 45.1 ± 26.8 | 42.3 ± 18.2 |
| Breath Hydrogen (ppm) | 12.8 ± 10.0 | 23.0 ± 19.3¥ | 8.1 ± 8.5¥ |
All values are means (± SD) or number of patients (%)
NAFLD and Obese Control groups were significantly more obese than the lean group (p<0.0004)
NAFLD group had larger waist circumference compared with both the Obese and Lean Control groups (p<0.01)
Obese Control group had larger waist circumference compared with Lean Control group (p=0.005)
NAFLD group had higher systolic blood pressure compared with Lean Control Group (p=0.005)
NAFLD had higher baseline uric acid compared with Obese (p=0.04) and Lean Controls (p=0.0007)
Obese Controls had higher baseline breath hydrogen compared with Lean Control (p=0.03)
Normal Values: Glucose: 60–105 mg/dl, Insulin: 0–29.1 μU/mL, Triglycerides: <90 mg/dL, Free fatty acids- 100–600 uEq/L, Uric acid: 3.0–5.9 mg/dL, Breath Hydrogen: <20 ppm
Serum glucose and insulin
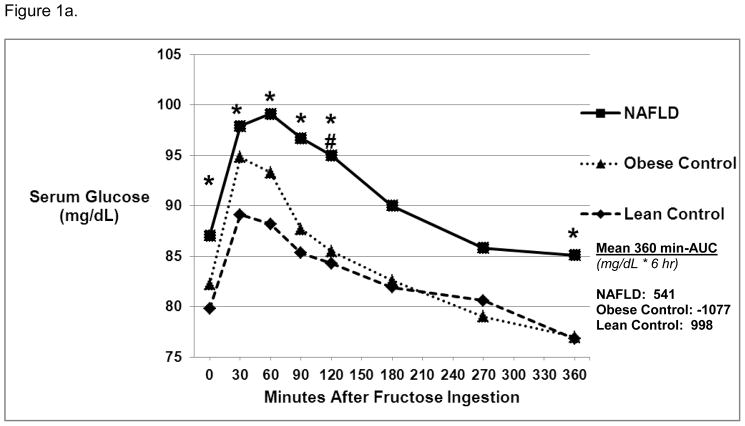
Baseline glucose was higher in NAFLD vs. Lean Controls (87.0 ± 5.5 mg/dL vs 79.8 ± 7.0 mg/dL, p = 0.03). Following fructose ingestion, serum glucose remained significantly higher at 30, 60, 90, 120, and 360 minutes in NAFLD vs. Lean Controls (Figure 1a). In addition, at 120 minutes post-fructose ingestion, NAFLD had significantly higher glucose levels compared to Obese Controls (95.0 ± 11.1 vs. 85.5 ± 8.7 mg/dL, p=0.046). There were no differences in 360 min-AUC.
Figure 1.
Figure 1a. Glucose Levels Over 6 Hours Post-Oral Fructose Ingestion.
Mean serum glucose levels were significantly higher in NAFLD vs. Lean Control groups* at baseline and 30, 60, 90, 120, and 360 minutes post-oral fructose ingestion (1 gm/kg ideal body weight) (p<0.05). Glucose levels were significantly higher in NAFLD vs. Obese Control groups # at 120 minutes post-oral fructose ingestion (p<0.05). The area under the curve (360 min-AUC) was similar among the three groups.
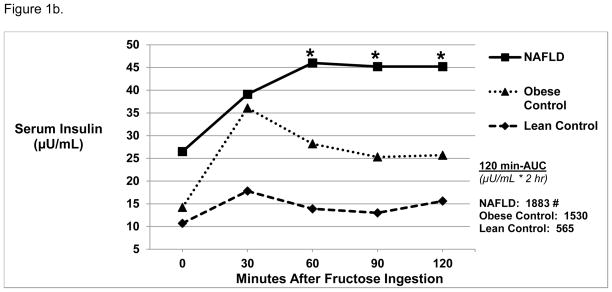
Figure 1b. Insulin Levels Over 2 Hours Post-Oral Fructose Ingestion.
Mean serum insulin levels were higher in NAFLD vs. Lean Control groups* at 60, 90, and 120 minutes post-oral fructose ingestion (p<0.04). NAFLD subjects (#) had higher serum insulin levels AUC compared to lean controls (120 min-AUC, 1883 ± 1675 vs. 565 ± 360 μU/mL*2hr, p=0.03).
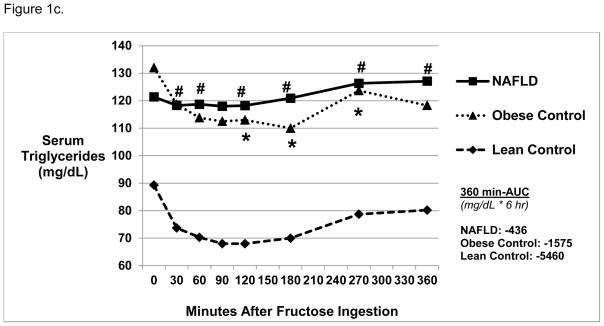
Figure 1c. Triglyceride Levels Over 6 Hours Post-Oral Fructose Ingestion.
Mean serum triglyceride levels were not significantly different at baseline amongst the three groups. Triglyceride levels were higher in NAFLD vs. Lean Control (#) subjects at 30, 60, 120, 180, 270, and 360 minutes post-oral fructose ingestion (p<0.03). Triglyceride levels were higher in Obese Control* vs. Lean Control subjects at 120, 180, and 270 minutes post-oral fructose ingestion. The area under the curve (360 min-AUC) was similar among the three groups.
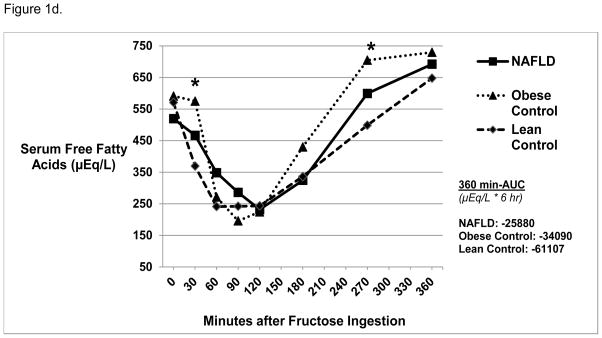
Figure 1d. Free Fatty Acid Levels 6 Hours Post-Oral Fructose Ingestion.
Mean serum total free fatty acid levels were similar at baseline among the three groups. Obese Control subjects had higher free fatty acid levels compared with Lean Control* subjects at 30 and 270 minutes post-oral fructose ingestion (p=0.03). There were no differences in 360 min-AUC amongst the three groups.
The mean insulin levels were similar between the three groups at baseline (Figure 1b). However, at 60, 90, and 120 minutes after fructose ingestion, insulin levels were significantly higher in NAFLD vs. Lean Controls (p<0.04). In addition, NAFLD had a more pronounced increase in insulin (ΔI) from baseline vs. Lean Controls (26.2 vs. 9.9 μU/mL, p=0.03). NAFLD had higher post-fructose insulin AUC compared to Lean Controls (120 min-AUC, 1883 ± 1675 vs. 565 ± 360 μU/mL*3 hr, p=0.03).
Serum triglycerides and free fatty acids
Lean Controls had a significant decrease in serum triglycerides compared to baseline at 30, 60, 90, 120, 180, and 270 minutes post fructose ingestion (Figure 1c, p<0.05). At all times post fructose administration, NAFLD had higher triglyceride levels compared with Lean Controls (p<0.03), while NAFLD and Obese Controls were similar. There were no differences in 360 min-AUC.
Baseline free fatty acids (FFA) were similar in all three groups, followed by a similar decrease after fructose ingestion (Figure 1d). While all groups demonstrated a subsequent rise in FFA concentrations, Obese vs. Lean Controls had higher FFA at 30 and 270 minutes post fructose ingestion (p=0.03). In addition, although FFA did not significantly change from baseline to 360 minutes in Obese and Lean Controls, NAFLD had higher levels at 360 minutes compared with baseline (692 ± 49 μEq/L vs. 519 ± 103 μEq/L, p = 0.007). There were no differences in 360 min-AUC.
Serum and urine uric acid
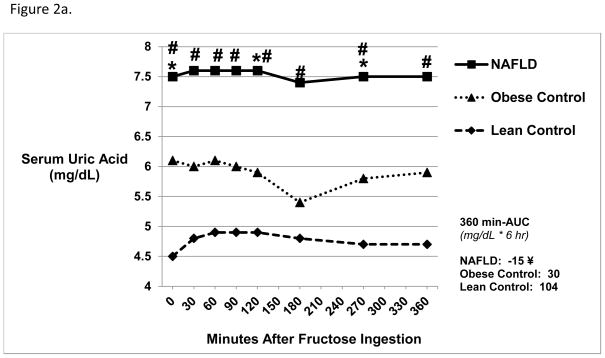
At baseline, NAFLD had significantly higher mean serum uric acid levels (Figure 2a) compared with Obese (7.5 ± 1.4 vs. 6.1 ± 1.6 mg/dL, p=0.04) and Lean Controls (7.5 ± 1.4 vs. 4.5 ± 1.6 mg/dL, p=0.0003). Following ingestion of fructose, serum uric acid levels remained stable and were significantly higher in NAFLD at all points compared with Lean (p<0.002) and at 120 (p=0.045) and 270 minutes (p=0.04) compared to Obese Controls. The change in serum uric acid levels from baseline to peak (Δ UA) was significantly higher in Lean Controls vs. NAFLD (p=0.03). NAFLD vs. Lean Controls had lower AUC (360 min-AUC, −15 ± 83 vs. 104 ± 73 mg/dL*6 hr, p=0.01). Similarly, NAFLD vs. Lean Controls had higher mean urine uric acid concentrations at baseline (59.5 ± 19.9 vs. 37.9 ± 14.5 mg/dL, p=0.04) and post-fructose administration (65.1 ± 31.6 vs. 29.2 ± 20.0 mg/dL, p=0.001).
Figure 2.
Figure 2a. Serum Uric Acid Levels 6 Hours Post-Oral Fructose Ingestion.
NAFLD subjects had higher baseline mean serum uric acid levels compared with both Obese Control and Lean Control subjects (p<0.05). NAFLD subjects had higher uric acid levels at 120 and 270 minutes post-oral fructose ingestion compared with Obese Control* subjects (p<0.05) and at all time points compared with Lean Control subjects # (p<0.05). NAFLD patients (¥) had lower AUC compared with Lean Control subjects (360 min-AUC, −15 ± 83 vs. 104 ± 73 mg/dL*6 hr, p=0.01).
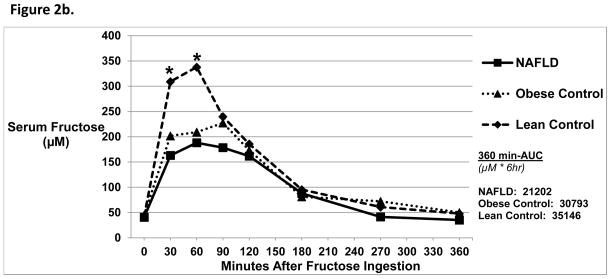
Figure 2b. Serum Fructose Levels 6 Hours Post-Oral Fructose Ingestion.
There were no differences in baseline mean serum fructose levels amongst the three groups. At 30 and 60 minutes post-oral fructose ingestion, NAFLD subjects had a lower serum fructose level compared with Lean Control subjects* (p<0.02). There were no differences amongst the three groups in 360-min AUC.
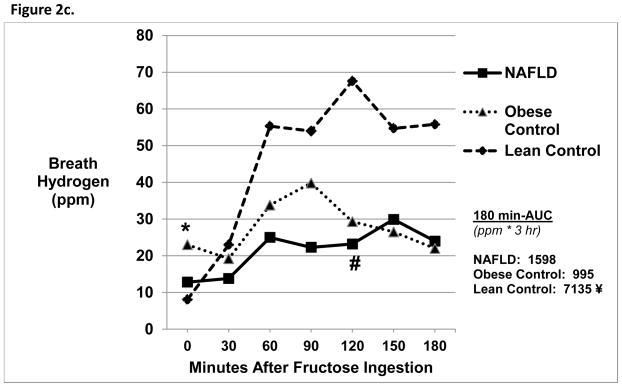
Figure 2c. Breath Hydrogen Levels 3 Hours Post-Oral Fructose Ingestion.
Obese Controls* had increased baseline breath hydrogen levels compared with Lean Controls (p=0.03). NAFLD subjects had a lower breath hydrogen concentration at 120 minutes post-oral fructose ingestion compared with Lean Control subjects # (p=0.01). Lean Control subjects (¥) had higher 180-min AUC compared with both NAFLD (7135 ± 7425 vs. 1598 ± 4203 ppm*3hr, p =0.04) and Obese Control subjects (7135 ± 7425 vs. 995 ± 2802 ppm*3hr, p=0.04).
Serum and urine fructose
Baseline serum fructose levels were similar amongst all groups (Figure 2b). After fructose ingestion, Lean Controls had higher fructose levels at 30 and 60 minutes compared with NAFLD and Obese Controls (p<0.02). The Δ fructose was significantly higher in Lean Controls vs. NAFLD (372 ± 150 vs. 210 ± 94 μM, p=0.01). There were no differences in 360-min AUC.
Baseline urine fructose was similar amongst all groups. However, NAFLD had lower urinary fructose excretion following oral fructose dosing compared with Obese (41.2 ± 19.4 vs. 141.5 ± 87.5 mg/g creatinine, p=0.02) and Lean Controls (225.5 ± 78.0 mg/g creatinine, p = 0.002).
Breath hydrogen
Baseline breath hydrogen values were similar between the three groups. Baseline breath hydrogen values, however, were increased in Obese vs. Lean Controls (Figure 2c). At 120 minutes, NAFLD had a lower breath hydrogen level compared with Lean Controls (23.1 ± 30.1 vs. 67.6 ± 62.1 ppm, p=0.01). In addition, NAFLD and Obese Controls had smaller Δ breath hydrogen compared with Lean Controls (p<0.03) and had significantly lower AUC compared to Lean Controls (p <0.04). In addition, 22% of NAFLD, 33% of Obese Controls and 67% of Lean Controls had a positive breath hydrogen test.
Discussion
An association between fructose intake and the development of NAFLD has been well described 2, 6, 14–16. This pilot study presents novel findings on the effects of oral fructose in children with obesity and with NAFLD compared to non-obese children. We demonstrate that children with NAFLD appear to have increased absorption and an exaggerated metabolic response to fructose administration compared to lean children, with obese children without NAFLD showing an intermediate response.
Normally, ingested fructose is passively absorbed across the intestinal epithelium by the Glut-5 receptor, which is up-regulated after luminal fructose exposure17. Following absorption, fructose is transported to the liver, where it is phosphorylated to fructose-1-phosphate by hepatic fructokinase without hormonal regulation. Phosphorylation of fructose uses adenosine triphosphate (ATP), and stimulates adenosine monophosphate (AMP) deaminase to convert AMP to inosine monophosphate (IMP) and eventually uric acid. Fructose-1-phosphate is further metabolized to glucose, acetyl-CoA, triglycerides, and fatty acids. Thus, end products of hepatic fructose metabolism include glucose, fatty acids, triglycerides and uric acid.
Mild elevations of serum glucose and insulin occur following fructose ingestion 18, 19. In this study, NAFLD subjects had an exaggerated response to oral fructose ingestion with higher serum glucose compared with Lean Controls and a slower return to baseline compared to both Obese and Lean Controls. Rising serum glucose levels result in increased serum insulin levels. Consistent with this physiology, NAFLD subjects had a delayed peak in insulin levels (60 minutes) and demonstrated no decline even at 120 minutes, as compared to both lean and obese controls. These findings are consistent with insulin resistance observed in NAFLD and may be indicative of exacerbated hepatic insulin resistance seen with elevated serum fructose concentrations 20.
Such hyperinsulinemia may be partially responsible for the acute decrease in triglycerides previously noted with the acute administration of fructose 19. As such, while all groups demonstrated a decrease in serum triglycerides following fructose ingestion, NAFLD subjects had higher post-fructose triglycerides than Lean Controls, which were inappropriately suppressed during hyperinsulinemia. In addition, NAFLD subjects had a significant increase in free fatty acids at 360 minutes after fructose ingestion compared to baseline levels. This may be secondary to insulin resistance and/or increased de novo lipogenesis from increased Acetyl-CoA production during unregulated fructose metabolism, 21 consistent with previous studies suggesting dysregulation of lipid metabolism in children with NAFLD 22.
Uric acid is produced as a result of fructose ingestion 10, 23. Transient increases in uric acid have been noted following an oral fructose challenge in adults, and are particularly pronounced in adults with gout and in children of adults with gout 10. Intravenous fructose infusions increase uric acid levels in normal children, and when administered to children with hereditary fructose intolerance, uric acid increases four-fold 23. Moreover, hyperuricemia is an independent risk factor for adult and pediatric NAFLD24–27. In our study, NAFLD subjects had higher baseline serum uric acid levels which were sustained following fructose challenge compared to Obese and Lean Controls. Both NAFLD and Obese Controls, however, exhibited a blunted increase in uric acid levels as compared to lean controls, which may have reflected higher urinary uric acid excretion following fructose ingestion.
Breath hydrogen testing is a non-invasive measure of carbohydrate malabsorption, commonly used clinically to diagnose carbohydrate malabsorption. When carbohydrates are malabsorbed in the intestine, hydrogen gas, produced as a result of carbohydrate fermentation by colonic flora, is absorbed into the bloodstream and appears in expired respiratory gases. Fructose malabsorption has been shown to be more common in lean vs. obese subjects28. In our study, 67% of Lean Controls had a positive breath test following ingestion of fructose, consistent with previous reports 12, while only 22% of NAFLD and 33% of Obese Controls had positive breath tests. In addition, Lean Controls demonstrated a greater rise in breath hydrogen and AUC compared with both NAFLD and Obese Controls. These preliminary data suggest that NAFLD and obese subjects had better fructose absorption than lean controls, which has not been previously described.
A potential explanation for this observation is that intestinal bacterial flora could be altered during obesity such that the flora could not ferment fructose into hydrogen, with a resultant lower breath hydrogen response to oral fructose. Recent evidence suggests an association between small bowel bacterial overgrowth and NAFLD. 29 Alterations in bacterial flora can limit the accuracy of breath hydrogen testing, as individuals may be colonized with hydrogen-producing bacteria. Organic intestinal diseases and/or functional intestinal disorders may influence hydrogen production; although we excluded subjects with known intestinal disease, endoscopy was not performed and irritable bowel syndrome/functional gastrointestinal disorders could have likely occurred in our patient population.
Alternatively, chronic ingestion of fructose is known to up-regulate Glut-5 in the intestinal epithelium 4, which could account for increased absorption of fructose. If NAFLD or Obese Controls were indeed absorbing fructose more effectively than Lean Controls, one might expect higher serum and urinary fructose levels in NAFLD subjects. However, serum fructose levels and urine fructose excretion were lower in NAFLD subjects during the first 60 minutes following fructose ingestion. The reason for this paradox has recently become evident. Serum fructose levels are influenced by both intestinal absorption and metabolism. While higher intake is associated with higher serum and urinary levels of fructose, increased metabolism can lower serum fructose, and conversely, decreased metabolism can raise fructose levels 30. In studies with mice lacking fructokinase, increased serum and urinary fructose levels were observed even in the absence of dietary fructose11. The observation that serum and urinary fructose levels are lower in NAFLD subjects despite having higher serum glucose levels following fructose ingestion (in the presence of lower breath hydrogen levels) is consistent with increased intestinal absorption and more efficient metabolism of fructose in NAFLD subjects. Taken together, these preliminary data suggest that NAFLD subjects are both absorbing and metabolizing more fructose compared to lean subjects following a similar oral fructose load, which is associated with an exacerbated metabolic profile following the ingestion of fructose, as noted by higher serum glucose and insulin excursions and by less suppression of serum triglycerides.
Adult NAFLD subjects have higher fructokinase expression in their livers in association with higher fructose intake and higher uric acid levels2. The mechanism for higher fructokinase expression may be because fructose itself upregulates fructokinase in liver cells.2 The administration of fructose or sucrose to rats also upregulates both the fructose transporter (Glut5) in the liver and fructokinase in the gut and liver4, 31. Uric acid upregulates fructokinase expression in liver; this is rate-limiting such that the same dose of fructose results in more fructose metabolism, uric acid generation and fat response in cells expressing higher amounts of fructokinase32. Consistent with this finding, the administration of intravenous fructose to subjects with NAFLD results in a greater ATP depletion in those with prior fructose exposure and in those with higher uric acid levels33.
In this study, we found that NAFLD subjects have lower serum fructose levels despite evidence for greater absorption. While indirect, this suggests there is a greater first pass effect in the liver, with more fructose metabolism. This is consistent with the studies quoted above.
While this study is limited by a small sample size, the results are consistent across subjects in each group. It is possible that a larger population would yield more robust results. Another limitation is that fructose absorption was measured indirectly, from breath hydrogen tests, as has been done in other NAFLD studies. In addition, only half of the subjects provided urine for fructose analyses. These limitations are tempered by the complimentary use of both breath tests and measurement of fructose levels coupled with metabolic parameters in thoroughly matched subjects.
In conclusion, our pilot study provides evidence that children with NAFLD may be both absorbing and metabolizing fructose more effectively than lean subjects, which could contribute to the pathophysiology of NAFLD. Whether this may be related to up-regulation of Glut-5 and fructokinase by previous fructose exposure or whether this is due to genetic/ethnic differences has yet to be determined. Further studies investigating the mechanisms responsible for differences in fructose absorption in NAFLD and lean subjects are therefore indicated.
Supplementary Material
What is already known about this subject
NAFLD is associated with fructose intake and hyperuricemia.
Fructose malabsorption is associated with a decreased risk of NAFLD in African- American adults.
What this study adds
NAFLD subjects are both absorbing and metabolizing more fructose compared to lean subjects following a similar oral fructose load
Absorption of fructose in NAFLD subjects is associated with an exacerbated metabolic profile following fructose ingestion.
Acknowledgments
Dr. Sullivan would like to acknowledge her master’s committee members: Dr. Glenn Furuta, Dr. Shikha Sundaram, and Dr. Heather Haugen for their assistance and expertise. We also thank the children and their families for participating in this study.
Financial Support: Supported in part by Ruth L. Kirschstein National Research Service Award (T32DK067009), Cystic Fibrosis Foundation Clinical Fellowship Award (#GEIDER08B0), NIH/NIDDK K23 Award (DK085150) and NIH/NCATS Colorado CTSA Award (UL1 RR025780 and UL1TR000154). Its contents are the authors’ sole responsibility and do not necessarily represent official NIH views.
List of Abbreviations
- NAFLD
non-alcoholic fatty liver disease
- NASH
non-alcoholic steatohepatitis
- ATP
adenosine triphosphate
- BMI
body mass index
- ALT
alanine aminotransferase
- SD
standard deviation
- ANOVA
analysis of variance
- AUC
area under the curve
- FFA
free fatty acids
- AMP
adenosine monophosphate
- IMP
inosine monophosphate
Footnotes
Conflicts of Interest: Dr. Johnson has several patent applications on blocking fructose metabolism as a means to prevent or treat metabolic disorders. Dr. Johnson also has written a lay book, The Fat Switch (mercola.com, 2012) that discusses the role of fructose in the obesity epidemic. The authors have no other relevant conflicts of interest to disclose.
Author Contributions:
JS, ML, RJ, RS, and SS designed the study. JS, KR, KO, and SS collected data. CR and ML carried out experiments. JS, ZP, and SS analyzed data. All authors were involved in writing the paper and had final approval of the submitted and published versions.
References
- 1.Schwimmer JB, Deutsch R, Kahen T, Lavine JE, Stanley C, Behling C. Prevalence of fatty liver in children and adolescents. Pediatrics. 2006;118:1388–93. doi: 10.1542/peds.2006-1212. [DOI] [PubMed] [Google Scholar]
- 2.Ouyang X, Cirillo P, Sautin Y, et al. Fructose consumption as a risk factor for non-alcoholic fatty liver disease. J Hepatol. 2008;48:993–9. doi: 10.1016/j.jhep.2008.02.011. [DOI] [PMC free article] [PubMed] [Google Scholar]
- 3.Nguyen S, Choi HK, Lustig RH, Hsu CY. Sugar-sweetened beverages, serum uric acid, and blood pressure in adolescents. J Pediatr. 2009;154:807–13. doi: 10.1016/j.jpeds.2009.01.015. [DOI] [PMC free article] [PubMed] [Google Scholar]
- 4.Roncal-Jimenez CA, Lanaspa MA, Rivard CJ, et al. Sucrose induces fatty liver and pancreatic inflammation in male breeder rats independent of excess energy intake. Metabolism. 2011;60:1259–70. doi: 10.1016/j.metabol.2011.01.008. [DOI] [PMC free article] [PubMed] [Google Scholar]
- 5.Cortez-Pinto H, Chatham J, Chacko VP, Arnold C, Rashid A, Diehl AM. Alterations in liver ATP homeostasis in human nonalcoholic steatohepatitis: a pilot study. JMA. 1999;282:1659–64. doi: 10.1001/jama.282.17.1659. [DOI] [PubMed] [Google Scholar]
- 6.Abdelmalek MF, Suzuki A, Guy C, et al. Increased fructose consumption is associated with fibrosis severity in patients with nonalcoholic fatty liver disease. Hepatology. 2010;51:1961–71. doi: 10.1002/hep.23535. [DOI] [PMC free article] [PubMed] [Google Scholar]
- 7.Van den Berghe G. Fructose: metabolism and short-term effects on carbohydrate and purine metabolic pathways. Prog Biochem Pharmacol. 1986;21:1–32. [PubMed] [Google Scholar]
- 8.Walker RW, Le KA, Davis J, et al. High rates of fructose malabsorption are associated with reduced liver fat in obese African Americans. J Am Coll Nutr. 2012 doi: 10.1080/07315724.2012.10720445. in press. [DOI] [PubMed] [Google Scholar]
- 9.Beevers G, Lip GY, O’Brien E. ABC of hypertension. Blood pressure measurement. Part I-sphygmomanometry: factors common to all techniques. BMJ. 2001;322:981–5. doi: 10.1136/bmj.322.7292.981. [DOI] [PMC free article] [PubMed] [Google Scholar]
- 10.Stirpe F, Della Corte E, Bonetti E, Abbondanza A, Abbati A, De Stefano F. Fructose-induced hyperuricaemia. Lancet. 1970;2:1310–1. doi: 10.1016/s0140-6736(70)92269-5. [DOI] [PubMed] [Google Scholar]
- 11.Ishimoto T, Lanaspa MA, Le MT, et al. Opposing effects of fructokinase C and A isoforms on fructose-induced metabolic syndrome in mice. Proc Natl Acad Sci U S A. 2012;109:4320–5. doi: 10.1073/pnas.1119908109. [DOI] [PMC free article] [PubMed] [Google Scholar]
- 12.Rao SS, Attaluri A, Anderson L, Stumbo P. Ability of the normal human small intestine to absorb fructose: evaluation by breath testing. Clin Gastroenterol Hepatol. 2007;5:959–63. doi: 10.1016/j.cgh.2007.04.008. [DOI] [PMC free article] [PubMed] [Google Scholar]
- 13.Brunt EM, Kleiner DE, Wilson LA, Belt P, Neuschwander-Tetri BA. Nonalcoholic fatty liver disease (NAFLD) activity score and the histopathologic diagnosis in NAFLD: distinct clinicopathologic meanings. Hepatology. 2011;53:810–20. doi: 10.1002/hep.24127. [DOI] [PMC free article] [PubMed] [Google Scholar]
- 14.Abdelmalek MF, Lazo M, Horska A, et al. Higher dietary fructose is associated with impaired hepatic adenosine triphosphate homeostasis in obese individuals with type 2 diabetes. Hepatology. 56:952–60. doi: 10.1002/hep.25741. [DOI] [PMC free article] [PubMed] [Google Scholar]
- 15.Solga S, Alkhuraishe AR, Clark JM, et al. Dietary composition and nonalcoholic fatty liver disease. Dig Dis Sci. 2004;49:1578–83. doi: 10.1023/b:ddas.0000043367.69470.b7. [DOI] [PubMed] [Google Scholar]
- 16.Abid A, Taha O, Nseir W, Farah R, Grosovski M, Assy N. Soft drink consumption is associated with fatty liver disease independent of metabolic syndrome. J Hepatol. 2009;51:918–24. doi: 10.1016/j.jhep.2009.05.033. [DOI] [PubMed] [Google Scholar]
- 17.Shu R, David ES, Ferraris RP. Luminal fructose modulates fructose transport and GLUT-5 expression in small intestine of weaning rats. Am J Physiol. 1998;274:G232–9. doi: 10.1152/ajpgi.1998.274.2.G232. [DOI] [PubMed] [Google Scholar]
- 18.Paquot N, Schneiter P, Jequier E, et al. Effects of ingested fructose and infused glucagon on endogenous glucose production in obese NIDDM patients, obese non-diabetic subjects, and healthy subjects. Diabetologia. 1996;39:580–6. doi: 10.1007/BF00403305. [DOI] [PubMed] [Google Scholar]
- 19.Macdonald I, Keyser A, Pacy D. Some effects, in man, of varying the load of glucose, sucrose, fructose, or sorbitol on various metabolites in blood. Am J Clin Nutr. 1978;31:1305–11. doi: 10.1093/ajcn/31.8.1305. [DOI] [PubMed] [Google Scholar]
- 20.Lim JS, Mietus-Snyder M, Valente A, Schwarz JM, Lustig RH. The role of fructose in the pathogenesis of NAFLD and the metabolic syndrome. Nat Rev Gastroenterol Hepatol. 2010;7:251–64. doi: 10.1038/nrgastro.2010.41. [DOI] [PubMed] [Google Scholar]
- 21.Faeh D, Minehira K, Schwarz JM, Periasamy R, Park S, Tappy L. Effect of fructose overfeeding and fish oil administration on hepatic de novo lipogenesis and insulin sensitivity in healthy men. Diabetes. 2005;54:1907–13. doi: 10.2337/diabetes.54.7.1907. [DOI] [PubMed] [Google Scholar]
- 22.Jin R, Le NA, Liu S, et al. Children with NAFLD are more sensitive to the adverse metabolic effects of fructose beverages than children without NAFLD. J Clin Endocrinol Metab. 97:E1088–98. doi: 10.1210/jc.2012-1370. [DOI] [PMC free article] [PubMed] [Google Scholar]
- 23.Kogut MD, Roe TF, Ng W, Nonnel GN. Fructose-induced hyperuricemia: observations in normal children and in patients with hereditary fructose intolerance and galactosemia. Pediatr Res. 1975;9:774–8. doi: 10.1203/00006450-197510000-00005. [DOI] [PubMed] [Google Scholar]
- 24.Li Y, Xu C, Yu C, Xu L, Miao M. Association of serum uric acid level with non-alcoholic fatty liver disease: a cross-sectional study. J Hepatol. 2009;50:1029–34. doi: 10.1016/j.jhep.2008.11.021. [DOI] [PubMed] [Google Scholar]
- 25.Sirota JC, McFann K, Targher G, Johnson RJ, Chonchol M, Jalal DI. Elevated serum uric acid levels are associated with non-alcoholic fatty liver disease independently of metabolic syndrome features in the United States: Liver ultrasound data from the National Health and Nutrition Examination Survey. Metabolism. doi: 10.1016/j.metabol.2012.08.013. [DOI] [PMC free article] [PubMed] [Google Scholar]
- 26.Sartorio A, Del Col A, Agosti F, et al. Predictors of non-alcoholic fatty liver disease in obese children. Eur J Clin Nutr. 2007;61:877–83. doi: 10.1038/sj.ejcn.1602588. [DOI] [PubMed] [Google Scholar]
- 27.Vos MB, Colvin R, Belt P, et al. Correlation of vitamin E, uric acid, and diet composition with histologic features of pediatric NAFLD. J Pediatr Gastroenterol Nutr. 54:90–6. doi: 10.1097/MPG.0b013e318229da1a. [DOI] [PMC free article] [PubMed] [Google Scholar]
- 28.Disse SC, Buelow A, Boedeker RH, et al. Reduced prevalence of obesity in children with primary fructose malabsorption: a multicentre, retrospective cohort study. Pediatric obesity. 2013;8:255–8. doi: 10.1111/j.2047-6310.2013.00163.x. [DOI] [PubMed] [Google Scholar]
- 29.Thuy S, Ladurner R, Volynets V, et al. Nonalcoholic fatty liver disease in humans is associated with increased plasma endotoxin and plasminogen activator inhibitor 1 concentrations and with fructose intake. J Nutr. 2008;138:1452–5. doi: 10.1093/jn/138.8.1452. [DOI] [PubMed] [Google Scholar]
- 30.Johner SA, Libuda L, Shi L, Retzlaff A, Joslowski G, Remer T. Urinary fructose: a potential biomarker for dietary fructose intake in children. Eur J Clin Nutr. 2010;64:1365–70. doi: 10.1038/ejcn.2010.160. [DOI] [PubMed] [Google Scholar]
- 31.Weiser MM, Quill H, Isselbacher KJ. Effects of diet on rat intestinal soluble hexokinase and fructokinase activities. Am J Physiol. 1971;221:844–9. doi: 10.1152/ajplegacy.1971.221.3.844. [DOI] [PubMed] [Google Scholar]
- 32.Lanaspa MA, Sanchez–Lozada LG, Cicerchi C, et al. Uric acid stimulates fructokinase and accelerates fructose metabolism in the development of fatty liver. PLoS One. 2012;7:e47948. doi: 10.1371/journal.pone.0047948. [DOI] [PMC free article] [PubMed] [Google Scholar]
- 33.Abdelmalek MF, Lazo M, Horska A, et al. Higher dietary fructose is associated with impaired hepatic adenosine triphosphate homeostasis in obese individuals with type 2 diabetes. Hepatology. 2012;56:952–60. doi: 10.1002/hep.25741. [DOI] [PMC free article] [PubMed] [Google Scholar]
Associated Data
This section collects any data citations, data availability statements, or supplementary materials included in this article.


