Abstract
Aim:
Purpose of the research is to assess patient satisfaction with the quality of health services provided in National Institute of Public Health of Kosova.
Methods:
Study was observational and cross-sectional. Interviews were conducted with 625 clients of IPH. Inclusion criteria for enrollment in the study were patients above 18 years old, with verbally informed consent.
Results:
In our study, access to IPH, efficacy, patient-provider interpersonal communication, and explanations regarding procedures, readiness to answer to patients need and physical settings and appearance are valued satisfactorily whereas cleanliness was rated with minimal grades. Evaluated 12 quality components, were scored with average mark 3.6.
Conclusions:
SWOT analysis, and fishbone diagram should be used on regular bases and a new position for a manager for administrative issues, is opened, complaints box and list of rights and responsibilities of patients were dislocated in a more visible place, and internal staff turnover, is introduced.
Keywords: patient satisfaction, quality of health care services, NIPH, Kosova
1. INTRODUCTION
The rapid healthcare technology development, increase of health related scientific knowledge, competitive environment increase pressure on healthcare managers to improve their strategies. Total Quality Management introduced since 1970s with Avedis Donabedian concepts on quality assurance as new management philosophy, systematic approach and set of guiding principles for continuous improvement, followed by Donald Berwick known as “father” of Total Quality Management (TQM) with great merit for health care quality improvement (1) is embraced by healthcare decision makers in Kosovo, too. Leadership commitment on quality improvement processes, information and analysis, focused on culture of continuous change, problem solving and monitoring of performance and also patients satisfaction is very important for fostering TQM philosophy and quality as an organizational value (2, 3). Beside leadership and employee commitment, effective and efficient use of available resources and competitiveness are necessary for quality improvement and increase of organization’s productivity. Patients have higher expectations for better health care services. Patient satisfaction surveys as outcome measurement tools are one of the most important instruments for health care quality evaluation and outcomes of patient care (4-7)and the gap between demand and supply. Also, they are helpful tools for monitoring and identification of major problems and priority areas for quality improvement (8). This depends on the institution’s organizational response and commitment(9) which, realized on a large scale, are costly (10). Today, TQM in health care is still more rhetoric than reality (11). Public sector, especially, is in a much worse position than the private sector (12).
Purpose of the research is to assess patient satisfaction with the quality of health services provided in National Institute of Public Health of Kosovo, NIPHK and 6 Regional Institutes of Public Health, RIPH, in order to identify priority areas for improvement.
2. METHODS
Study was observational and cross-sectional. Study population were clients of Institutes of Public Health - IPH, mainly microbiological services and sanitary card related services. Inclusion criteria for enrollment in the study were patients above 18 years old, who gave informed consent for participation in the study. Exclusion criteria were age younger than 18 years, and client’s companions. Questionnaire was interview-administered by the quality coordinator in NIPH and office workers in RIPH. Interviews were conducted at admission and waiting room offices. Respondents were explained the purpose of the survey, anonymity of their answers and were requested for informed consent.
Anonymous questionnaire was compiled by 10 questions organized in 3 parts:
Baseline data (6),
Quality of service (3) with twelve sub-questions- structure and process quality indicators
Patients’ comments as open questions (1).
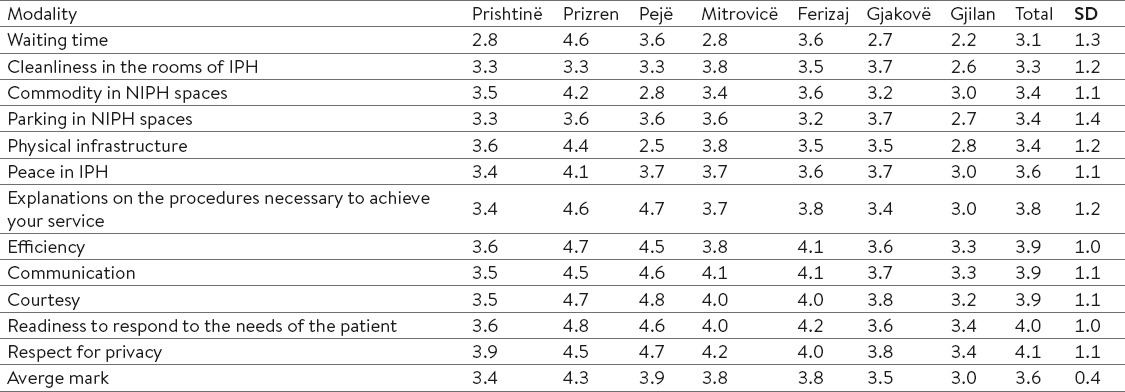
The t-test, Chi-square, Cramer’s V tests were used to examine significance among patient satisfaction variables. During July, August, September 2014, a total of 625 patients in NIPHK and RIPH were included in the survey. Patients were selected as they came consecutively until sample size of 200 patients is reached for NIPHK, 100 for IPH of Peja. 65 patients from other RIPH were reached. Data were analyzed with Excel and SPSS 16 version software. Response rate was high, 12 (6%) refused to participate in the survey at NIPHK, whereas at RIPH altogether 28(7%). In last and open question regarding eventual comments for the services quality improvement missing data were 50.08%. Scoring of quality criteria for several modalities presented on Table 3, are with marks from 1 (worst) to 5 (best).
Table 3.
How to value Institutes of Public Health from 1 (poor) to 5 (excellent) according to branches of IPH
3. RESULTS
In order to get patient’s satisfaction with NIPH services, survey covered three parts on those issues: accessibility, signalization for patient orientation, waiting time, commodity, parking in NIPH spaces, physical infrastructure (buildings, equipment), peace in IPH, explanations on the procedures necessary to achieve your service, efficiency, communication, courtesy, readiness to respond to the needs of the patient, respect for privacy and on last part any possible comment for quality of health services.
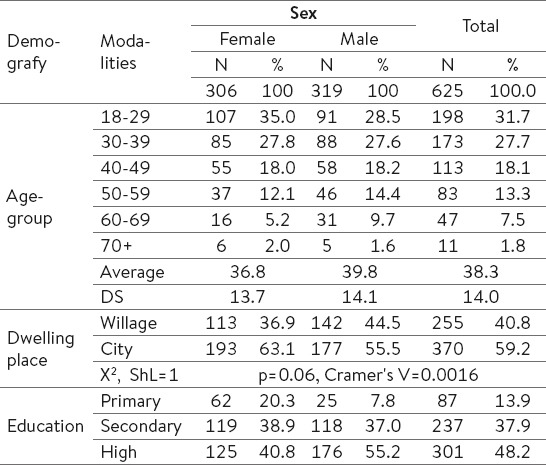
The research involved 625 patients. Of them 306 (48.96%) were women and 319 (51.04%) were men. According to age-group, 30-39 years patients (29%) had greater participation. The average age of respondents was 38.3 years: 36.8 women, and 39.8 for men. According to the settlement, greater participation but not significant had patients from the city with 370 respondents (59.8%). According to education, most of patients 301(48.2%) had finished higher level of education, and the smallest percentage of patients have been with primary education with 87(13.9%) (Table 1).
Table 1.
Baseline data of the users of services in National Institute of Public Health of Kosova and Regional Institutes of Public Health.
In our study, access to IPH was not identified as a problem since only 91 (14.61%) reported for not so easy access (Table 2). In our study, according to dwelling place, distinction was significant for those from city (p=0.014, DF=3, X2=10.61).
Table 2.
Access and orientation in Institutes of Public Health
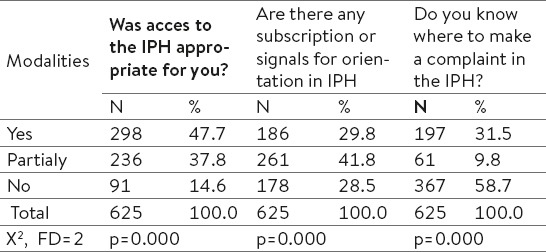
Regarding subscription or signals for orientation in IPH 178 (28.5%) denied and only 197 (31.5%) knew where they could make a complaint if they wanted to.
Identified problem was the fact that patients do not know where to do a complaint in the IPH. Of the 625 patients, only 31.5% stated positively (Table 2).
Among quality components, 12 of them were evaluated and scored with average mark 3.6, which certainly indicates a satisfactory evaluation of quality dimensions. Variation in assessment is made of 4.1±1.1, the maximum grade given for respect for privacy and 3.1±1.3 as minimum assessment for waiting time. Comparing average mark of RIPH, Gjilan RIPH, was graded with lowest mark 3.0 and Prizren RIPH with highest grade 4.3 (Table 3).
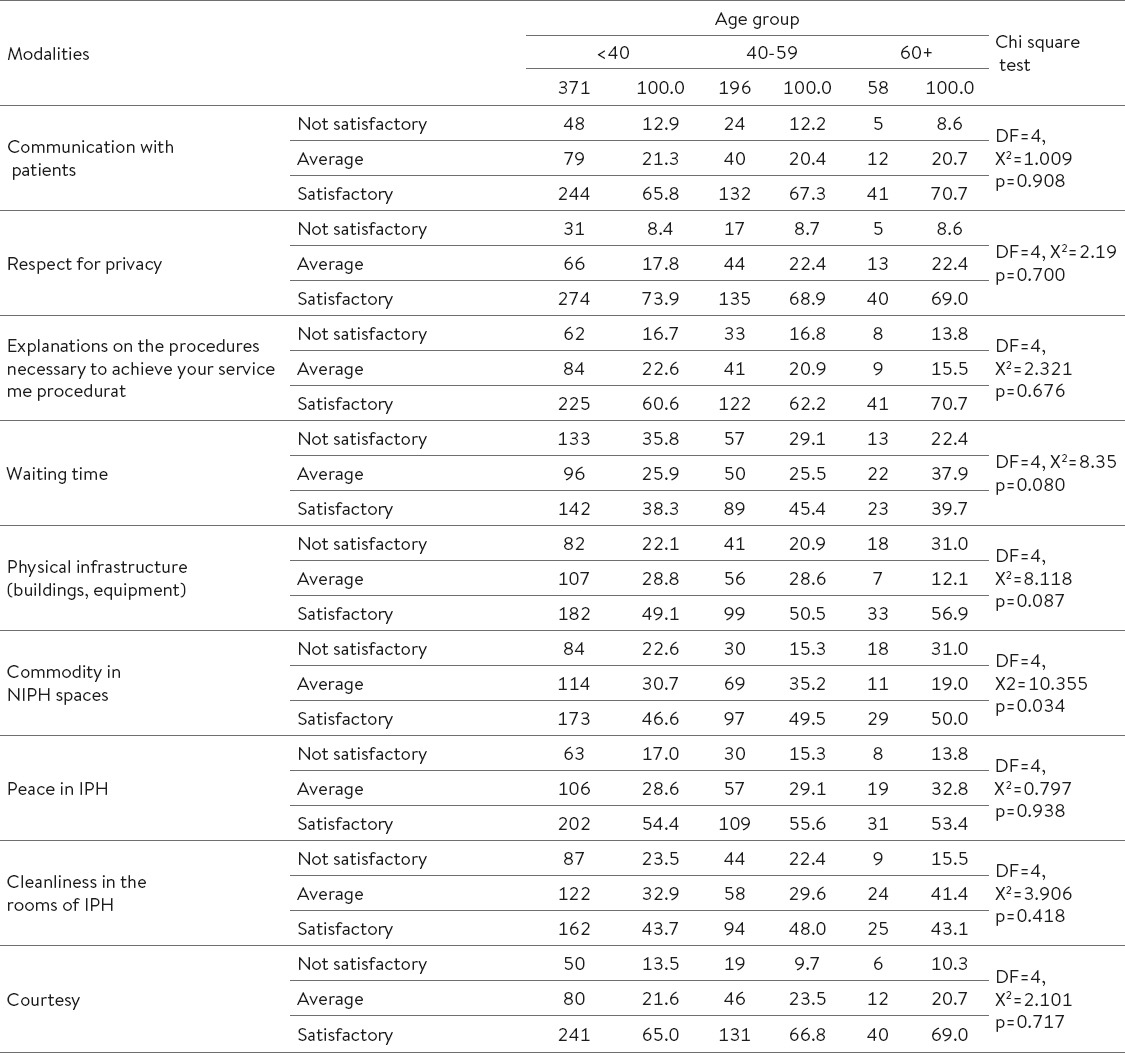
According to age group, except for commodity in IPH, there is no significant distinction in satisfaction with presented modalities.
Third part of questionnaire was dedicated for any possible comment for quality of health services. From 625 patients, 312(49.9%) were without specific comments whereas 88 (14.1%) gave not satisfactorily different comments regarding their impressions on health services and 225(36.0%) gave satisfactorily comments. (Table 4). Negative comments as waiting time, lack of on-line results of tests, lack of sufficient chairs and space, lack of reagents for some bloody tests or analyses, lack of hygiene in toilets, complaint box not so visible, and insufficient explanations were analyzed with cause-effect fishbone analyses and translate causes on quality improvement objectives (Graph 1).
Table 4.
How do you value IPH from 1 (poor) to 5 (excellent) ?
Graph 1.
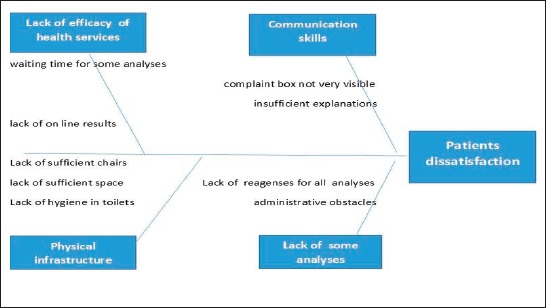
Patients complaints – Fishbone analyses
4. DISCUSSION
Patient satisfaction was measured by assessing access, quality components and comments and suggestions in order to increase patient satisfaction. Satisfaction of patients and health staff productivity can be improved simultaneously (13) by investing in quality improvement of health services (14) and patient-centered care (PCC), by provision of the best possible care through continuously improving health services to fulfill client’s needs (15-18). Continuing education of employees and managers in TQM issues, teamwork, improvement and efficient communication, active empowerment of the workforce by motivation at all levels and improving of trust, are components which need to be fostered much more by our institution, too, in order to support patient-focused processes (19, 20).
WHO experiences indicate that most important obstacles and barriers to TQM successful implementation are identified human resources, strategic and structural problems (21) lack of strategic planning for total quality management (TQM) in health care organizations (22). This, of course, is not so easy to implement (23).
In our study, supportive environment and culture for quality improvement, relied on functional organizational structures (24), employee commitment (25, 26), change in knowledge, values, beliefs, attitudes, employee morale, skills and techniques, was very important for the successful outcome as patient satisfaction results, too (27, 28). All those changes did not happen overnight.
Access to IPH was not identified as a problem since only 91 (14.61%) reported for not so easy access. Access to the care, as an important element of health care satisfaction, is significantly correlated with some of socio-demographic characteristics (29, 30). In our study waiting time and cleanliness, were rated with minimal grades which reflect organizational weakness in the administrative department, similar to two other conducted surveys, where the aspects related to organization were worst rated (31).
Communication with patients, as a process quality indicator, had a major role in the perception of service quality. In our study, efficacy, patient-provider interpersonal communication, explanations regarding procedures and readiness to answer to patients need are valued satisfactorily. This is important for patient loyalty, which is correlated with health staff commitment, attitude and skills (32).
Physical settings and appearance were valued satisfactory with 3.4, which reflects building space organization and room conditions. This had a great impact on patient satisfaction level (34). Performance based reward system is important for the increase of motivation at all levels, effectiveness and efficiency (24, 4). While in our case, the uniform salaries based on coefficient had an impact on patient satisfaction. With TQM the potential gain will be seen in improved patient satisfaction, increased revenue and enhanced staff productivity (34, 35) and improved safety (36).
5. LIMITATIONS
As study limitation is lack of information on the psychometric properties of the patient satisfaction survey instrument. It was designed as internal tool for need assessment and quality improvement.
6. DIRECTIONS FOR FUTURE RESEARCH
Patient satisfaction survey can be expanded on some detailed quality issues for further usage and serve as tool for cyclic continual quality improvement with evaluation on semiannual regular bases. In sense of quality improvement and increase of patient satisfaction, we proposed that besides usual tools, as brainstorming and consensus, SWOT analysis should be used in weekly practice in our departments, as group problem-solving techniques, such as nominal groups, Delphi method, whereas fishbone analyses should be done in semiannual regular bases. New position for a manager for administrative issues, organization of technical issues, as cleanliness, waiting time, commodity, infrastructure improvements is opened. Complaints box and list of rights and responsibilities of patients were dislocated in a more visible place, in waiting rooms.
Internal staff turnover, in order to increase efficacy regarding payment procedure for patients, is introduced. Supply of working staff with badges for easier identification from the patient is advocated. We recommend that one of most affordable and more appropriate performance measure tools should be choose between range of well-known instruments as Baldrige health care criteria for performance excellence, CONQUEST, Health Care Satisfaction Questionnaire (HCSQ), Quality in Daily Work (QIDW), at the unit level and attitude scales.
This research received no specific grant from any funding agency in the public, commercial, or not -for-profit sectors.
Acknowledgements
This work was supported by National Institute of Public Health of Kosova. We appreciate NIPHK staff for technical assistance in realization of the survey.
Footnotes
• Conflict of interest: None declared.
REFERENCES
- 1.Larson JS, Muller A. Managing the quality of health care. J Health Hum. Serv Adm. 2002;25:261–80. [PubMed] [Google Scholar]
- 2.Taveira AD, James CA, Karsh B, Sainfort F. Quality management and the work environment: an empirical investigation in a public sector organization. Appl Ergon. 2003;34:281–91. doi: 10.1016/S0003-6870(03)00054-1. [DOI] [PubMed] [Google Scholar]
- 3.Yank G. Quality improvement in health care organizations: a general systems perspective. Behav Sci. 1995;40:85–103. doi: 10.1002/bs.3830400202. [DOI] [PubMed] [Google Scholar]
- 4.Sajid MS, Baig MK. Quality of health care: an absolute necessity for public satisfaction. Int J Health Care Qual ASSUR. 2007;20:545–8. doi: 10.1108/09526860710819477. [DOI] [PubMed] [Google Scholar]
- 5.Bechtel G, Wood D. Improving the accuracy of total quality management instruments. Health Care Superv. 1996;14:21–6. [PubMed] [Google Scholar]
- 6.Lel P, Jolibert A. A three-model comparison of the relationship between quality, satisfaction and loyalty: an empirical study of the Chinese healthcare system. BMC Health Serv Res. 2012;12:436. doi: 10.1186/1472-6963-12-436. [DOI] [PMC free article] [PubMed] [Google Scholar]
- 7.Fleming NS, et al. Patient-centeredness and timeliness in a primary care network: baseline analysis and power assessment for detection of the effects of an electronic health record. Proc (Bayl Univ Med Cent) 2016;19(4):314–9. doi: 10.1080/08998280.2006.11928191. [DOI] [PMC free article] [PubMed] [Google Scholar]
- 8.Lliffe S, et al. Can clinicians benefit from patient satisfaction surveys? Evaluating the NSF for Older People 2005-2006. J R Soc Med. 2008;101(12):598–604. doi: 10.1258/jrsm.2008.080103. [DOI] [PMC free article] [PubMed] [Google Scholar]
- 9.Lund CM. Benchmarking patient satisfaction. Best Pract Benchmarking Healthc. 1996;1(4):203–6. [PubMed] [Google Scholar]
- 10.Eilers GM. Improving patient satisfaction with waiting time. J Am Coll Health. 2004;53(1):41–3. doi: 10.3200/JACH.53.1.41-48. [DOI] [PubMed] [Google Scholar]
- 11.Nathanson P. otal quality management: rhetoric and reality. Manag Care Q. 1993;1:19–25. [PubMed] [Google Scholar]
- 12.Arasli H, Ahmadeva L. “No more tears!” A local TQM formula for health promotion. Int J Health Care Qual Assur Inc Leadersh Health Serv. 2004;17:135–45. doi: 10.1108/09526860410532775. [DOI] [PubMed] [Google Scholar]
- 13.Wood GC, et al. Patient satisfaction and physician productivity: complementary or mutually exclusive? Am J Med Qual. 2009;24(6):498–504. doi: 10.1177/1062860609338869. [DOI] [PubMed] [Google Scholar]
- 14.Peabody JW, et al. Quality variation and its impact on costs and satisfaction: evidence from the QIDS study. Med Care. 2010;48(1):25–30. doi: 10.1097/MLR.0b013e3181bd47b2. [DOI] [PubMed] [Google Scholar]
- 15.Caldwell C. What healthcare can learn from TQM’s past. Healthc Exec. 1993;8:26–8. [PubMed] [Google Scholar]
- 16.McDonald SC. Total quality management in health care. J Can Diet. Assoc. 1994;55:12–14. [PubMed] [Google Scholar]
- 17.Palmberg M. Quality improvement in Swedish health care. Jt Comm J Qual Improv. 1997;23:47–54. doi: 10.1016/s1070-3241(16)30294-2. [DOI] [PubMed] [Google Scholar]
- 18.Wakefield DS, Cyphert ST, Murray JF, Uden-Holman T, Hendryx MS, Wakefield BJ, et al. Understanding patient-centered care in the context of total quality management and continuous quality improvement. Jt Comm J Qual Improv. 1994;20:152–61. doi: 10.1016/s1070-3241(16)30058-x. [DOI] [PubMed] [Google Scholar]
- 19.Warwood S, Antony J. A simple, semi-prescriptive self-assessment model for TQM. Qual Assur. 2003;10:67–81. doi: 10.1080/10529410390262718. [DOI] [PubMed] [Google Scholar]
- 20.Radovilsky ZD. Quality improvement: analysis and modeling based on survey results. Qual Assur. 1993;2:364–71. [PubMed] [Google Scholar]
- 21.Rad AM. A survey of total quality management in Iran. Int J Health Care Qual Assur Inc Leadersh Health Serv. 2005;18:xii–xxxiv. doi: 10.1108/13660750510611189. [DOI] [PubMed] [Google Scholar]
- 22.Hamidi Y, Zamanparvar A. Quality Management in Health Systems of Developed and Developing Countries: Which Approaches and Models are Appropriate? J Res Health Sci. 2008;8:40–50. [PubMed] [Google Scholar]
- 23.Yarborough CM., III Strategic quality planning. J Occup Med. 1994;36:414–8. [PubMed] [Google Scholar]
- 24.Kilmann RH. Managing holistic improvement. Clin Lab Manage Rev. 1993;7:395–406. [PubMed] [Google Scholar]
- 25.Rice WR. Motivation: the most basic process in TQM/CQI. J Healthc Qual. 1993;15:38–42. doi: 10.1111/j.1945-1474.1993.tb00101.x. [DOI] [PubMed] [Google Scholar]
- 26.Schalk R, Van DW. Quality management and employee commitment: illustrated with examples from Dutch health care. Int J Health Care Qual Assur Inc LeadershHealth Serv. 2005;18:32–40. doi: 10.1108/09526860510576956. [DOI] [PubMed] [Google Scholar]
- 27.Byham WC, Nelson GD. Using empowerment to make quality work in health care. Qual Manag Health Care. 1994;2:5–14. [PubMed] [Google Scholar]
- 28.Rose EA. TQM in health care: mistaken identity? Physician Exec. 1997;23:44–6. [PubMed] [Google Scholar]
- 29.Haviland MG, Morales LS, Dial TH, Pincus HA. Race/ethnicity, socioeconomic status, and satisfaction with health care. Am J Med Qual. 2005;20:195–203. doi: 10.1177/1062860605275754. [DOI] [PMC free article] [PubMed] [Google Scholar]
- 30.Ross CK, Steward CA, Sinacore JM. The importance of patient preferences in the measurement of health care satisfaction. Med Care. 1993;31:1138–49. doi: 10.1097/00005650-199312000-00006. [DOI] [PubMed] [Google Scholar]
- 31.Rodriguez-Legido C. Measurement of health care satisfaction: Andalucía 1984-1992. Gac. Sanit. 1993;9:311–5. doi: 10.1016/s0213-9111(95)71254-7. [DOI] [PubMed] [Google Scholar]
- 32.Smith AD, Offodile OF. Data collection automation and total quality management: case studies in the health-service industry. Health Mark Q. 2008;25:217–40. doi: 10.1080/07359680802081811. [DOI] [PubMed] [Google Scholar]
- 33.Castillo L, Dougnac A, Vicente I, Munoz V, Rojas V. Predictors of the level of patient satisfaction in a university hospital] Rev Med Chil. 2007;135:696–701. doi: 10.4067/s0034-98872007000600002. [DOI] [PubMed] [Google Scholar]
- 34.Bender AD, Krasnick CJ. Implementing total quality management in the medical practice: managing the transition. Health Care Superv. 1993;12:61–9. doi: 10.1097/00126450-199309000-00011. [DOI] [PubMed] [Google Scholar]
- 35.Bender AD, Krasnick CJ, Bender JG. Applying total quality management to the medical practice. J Healthc Qual. 1993;15:22–6. doi: 10.1111/j.1945-1474.1993.tb00672.x. [DOI] [PubMed] [Google Scholar]
- 36.Urden LD. Patient satisfaction measurement: current issues and implications. Lippincotts Case Manag. 2002;7(5):194–200. doi: 10.1097/00129234-200209000-00006. [DOI] [PubMed] [Google Scholar]
- 37.Lee KS. Ergonomics in total quality management: how can we sell ergonomics to management? Ergonomics. 2005;48:547–58. doi: 10.1080/00140130400029282. [DOI] [PubMed] [Google Scholar]


