Abstract
Introduction:
Analysis of total value of prostate specific antigen (PSAT), with the unavoidable digital rectal examination (DRE) is the basis of prostate cancer detection.
Aim:
The aim of this study was to determine the specificity and sensitivity of the total value of PSAT in the diagnosis of prostate cancer. The aim was also to determine the significance of PSAT in diagnosis of benign prostate hyperplasia, precancerous conditions and inflammatory and atrophic changes of the prostate.
Material and methods:
Data were collected from the “Register of PH biopsy” of Clinic of Urology, CCU Sarajevo.
Results:
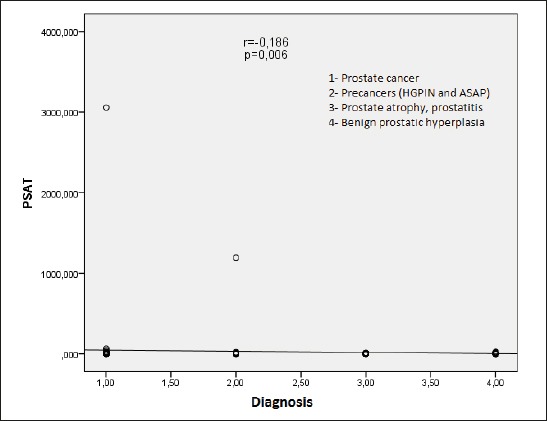
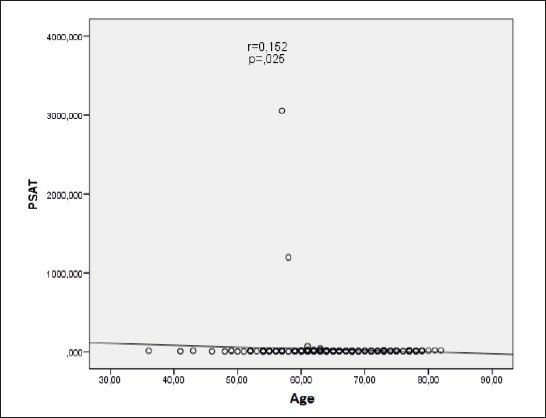
Analysis of correlation between the diagnosis and the PSAT value shows statistically significant negative correlation (r =-0,186; p = 0.006) in the sense that the value of the PSAT is highest in cancer patients, and the lowest in patients with benign prostatic hyperplasia. PSAT increases with age (r = 0.152; p = 0.025). For prostate cancer optimal sensitivity and specificity for PSAT value occurs at cut off value of> 8.6 ng /mL. Values lower than 2 ng/mL and higher than 10 ng/mL are most specific, and PPV increases with increasing value of PSAT. PSAT at values of <2 ng/mL and > 10 ng/mL are at high levels of specificity, and value > 10 ng / mL is also of high sensitivity in the detection of prostate cancer, and in this moment these values represent the optimal mode for the subsequent treatment.
Conclusion:
PSAT has a relative significance in the detection of prostate cancer, and should not be used as a guideline without DRE.
Keywords: prostate specific antigen, total value of prostate specific antigen, prostate cancer
1. INTRODUCTION
Analysis of total value of prostate specific antigen (PSAT), with the unavoidable digital rectal examination (DRE) is the basis of prostate cancer detection. Positive DRE (subjective examination, depends on physicians skills) and increased PSA value (objective, numerical findings) indicate that there is a greater chance of cancer diagnosis. Prostate specific antigen (PSA) is a 33 kDa protein consisting of a single-chain glycoprotein of 237 amino acid residues, 4 carbohydrate side chains and multiple disulfide bonds (2) first identified in seminal plasma in 1971 by Hara et al. (3) and subsequently isolated from prostatic tissue in 1979 by Wang et al. (2). It belongs to the group of serine proteases (4) with extensive structural similarity to the glandular kallikrein (5), with which it shares considerable structural and functional homology and a gene location on the long arm of chromosome 19 (19q13.2±q13.4) (6). It is produced by prostate secretory epithelium and vesiculae seminales (7) and is one of the most abundant proteins in seminal plasma where it is found in concentrations of 0.2–5.0 mg/mL (8). PSA is predominantly found in serum in 3 different molecular forms: free PSA (molecular mass 30 kDa), bound to alpha-2-macroglobulin (molecular mass 780kDa) and bound to alpha-anti-chymotrypsin (molecular mass 90kDa) (9). In the serum of healthy men in physiological conditions there is a very low concentration of PSA of prostate origin. PSA in serum is present only in case of disrupted microarchitecture of prostate gland tissue, which becomes the cause of PSA crossing into the surrounding extracellular space, where is being swept away by lymph in the systemic circulation and is always an indication of trauma or prostate disease. In serum, normal range is from 0.1 to 4 ng/mL. PSA test allows doctors to detect prostate cancer, while they are still small, low grade and localized (10). PSA is a prostate-specific, but not specific to prostate cancer, and is also increased in other diseases of the prostate (prostatitis, benign prostatic hyperplasia), and in diagnostic procedures, as well as some of the physiological processes. PSA is increased to about 0.3 ng/mL per gram in benign prostatic hyperplasia (BPH) while this level per gram in cancer rises 10 times, or 3 ng/mL. The increased value of PSA is found in 20% to 50% of men with benign prostatic hyperplasia (11). Approximately 10% of the male population has a PSA value higher than 10 ng/mL, but don’t have cancer. When talked about non-specificity there is a fact that PSA is found in many tissues, especially those that are hormone active. PSA is located in male and female periurethral and perianal glands, and is elevated in cystitis, healthy endometrium and in many carcinomas (urethra, bladder, penis, parotid, kidney, adrenal, colon, ovarian, lung, hepatic, and breast). Elevation of PSA levels has been proven in acute prostatitis, subclinical or chronic prostatitis and urinary retention. There are no significant changes in the value of PSA after DRE, but powerful massage of the prostate can lead to short-term increase. A biopsy of the prostate increases PSA, and it takes from 2 to 4 weeks to return to normal PSA value. Prostate volume also affects the value of PSA (12). For larger prostate (>40 cm3) PSAT is superior to Free to Total PSA Ratio (PSAR) in the detection of prostate cancer, while in smaller prostate PSAR is more important (13). The most important role of PSA is monitoring of prostate cancer treatment. The concentration of PSA is essential information that helps evaluate the effectiveness of the therapy as well as to determine the probability of finding residual disease (local or distant). It also draws attention to the biochemical relapse and the occurrence of metastases before it is possible to identify them with other conventional diagnostic procedures. Approximately 70% of patients with elevated PSA values do not have prostate cancer (11). Between 25-40% of patients have cancer at values below 10 ng/mL. This means that 40-75% of them will have to go through unnecessary and uncomfortable examination. Also 15% of patients with PSA values from 2.5 to 4 ng/mL have prostate cancer. PSA values are increased in proportion to the increase of age, and increases from 0.7 to 1.5 mL per year. On this basis normal, baseline PSA values, vary according to the age of the patient (in patients <40 years 0-2 ng/mL, 50-59 years 0-3.5 ng/mL, >80 years 0-7.2 ng/mL). Oesterling et al. found that in 60-year-old man PSA increases to about 0.04 ng/mL in one year (14). When PSAT is >10.0 ng/mL, the probability of cancer is high, and prostate biopsy is usually recommended. In favor of non-specificity of PSA are results according to which 20% to 30% men with prostate cancer have PSA less than 4 ng/mL. The total PSA range from 4.0 to 10.0 ng/mL is described as a diagnostic “gray zone” (doctors before other diagnostic tests have to consider digital rectal examination), in which are used many developed indexes (age-specific PSA, PSA density, acceleration of PSA, PSA density of the transition zone, PSAR, which help to determine relative risk of prostate cancer. PSA has the highest positive predictive value for cancer and is objective indicator of the risk of prostate cancer. Analysis showed that men with prostate cancer have higher PSA levels than men without cancer, years before conventional diagnosis with DRE. The chances of the biopsy proven cancer are 1 in 50 men with PSA below 4.0 ng/mL (15), 1 out of 3 for PSA value of 4.0 ng/mL or higher, 1 out of 4 for value for PSA values from 4 to 10, and 1 out of 2, or 2 out of 3 for PSA value higher than 10 ng/mL (16). If the serum PSA value is between 4 and 10 ng/mL, positive predictive value for cancer is about 30%. If the PSA value is > 10 ng/mL the positive predictive value is higher than 60%. Prostatic intraepithelial neoplasia ( PIN) does not raise serum concentration of PSA (17).
The aim of this study was to determine the specificity and sensitivity of the total value of PSAT in the diagnosis of prostate cancer, and justifiability of using the same in cancer detection. The aim was also to determine the significance of PSAT in diagnosis of benign prostate hyperplasia, precancerous conditions and inflammatory and atrophic changes of the prostate. Based on the obtained results, the aim of this research was to point out the “real” significance of PSA in diagnosing prostate cancer.
2. MATERIAL AND METHODS
Research included 220 (n = 220) patients aged from 36 to 82. Data were collected from the “Register of PH biopsy” Clinic of Urology, University Clinical Center Sarajevo, and included all patients who underwent this method in last two years. Total PSA values were recorded and four groups were formed based on the diagnosis (prostate cancer, benign prostatic hyperplasia, precancerous conditions (atypical small acinar proliferation (ASAP), High-Grade Prostatic Intraepithelial Neoplasia (HGPIN), inflammatory and atrophic changes of the prostate). Results are shown through number of cases, percentage, arithmetic mean, standard deviation, median and interquartile range, area under the curve (AUC), sensitivity and specificity, and confidence interval (CI). Analysis of the distribution by the Shapiro-Wilk test showed that none of the observed variables did not meet the criteria of normal distribution and non-parametric tests (Mann-Whitney, Kruskal-Wallis and Spearman’s rank correlation coefficient) were used in the analysis. Analysis of the ROC (receiver operating curve) was used to determine the sensitivity and specificity. All results of the analysis with p <0.05 or at the level of confidence of 95% were considered statistically significant. Statistical analysis of the obtained data was done by software package SPSS Windows (version 21.0, SPSS Inc., Chicago, Illinois, USA) and Microsoft Excel (version 11th Microsoft Corporation, Redmond, WA, USA). The research was conducted in accordance to basic principles of the Declaration of Helsinki (last revision in 2008) on the rights of patients involved in biomedical research. During the realization of this research identity and all personal data of patients are permanently protected in accordance to regulations of protection of identification data. Identification number was assigned to every patient in order to protect personal information and that number was used in statistical analysis.
3. RESULTS
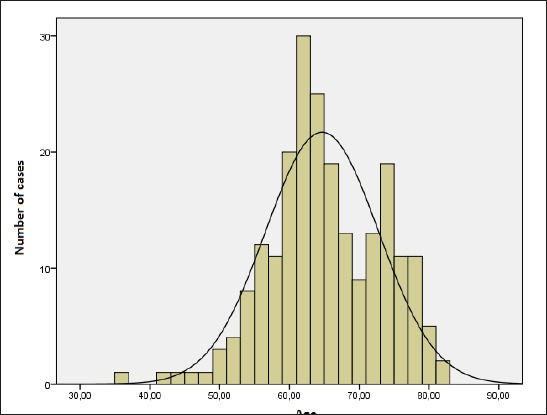
Histogram with normal distribution curve shows that the majority of patients were 50 to 80 years old (64.6 ± 8.1 years) (Figure 1).
Figure 1.
Age distribution of patients
Analysis of correlation between the diagnosis and the PSAT value shows statistically significant negative correlation (r =-0,186; p = 0.006) in the sense that the value of the PSAT is highest in cancer patients, and the lowest in patients with benign prostatic hyperplasia (Figure 2).
Figure 2.
The correlation between the diagnosis and the value of PSAT
The correlation between PSAT value and age shows a positive, statistically significant value (r = 0.152; p = 0.025) in the sense that the value of the PSAT increases with age (Figure 3).
Figure 3.
The correlation between age and the value of PSAT
PSAT shows the highest sensitivity at a specificity of 95% for prostate cancer -12.05% (4.82-19.28), then specificity for benign prostatic hyperplasia -8.00% (2-13.33), atrophic and inflammatory changes of the prostate -3.23% (0-6.45) and the lowest for precancerous conditions -5.56% (0-11.1). Statistically significant AUC was recorded only for prostate cancer (Table 1).
Table 1.
Analysis of sensitivity and specificity of PSAT in relation to individual diagnosis
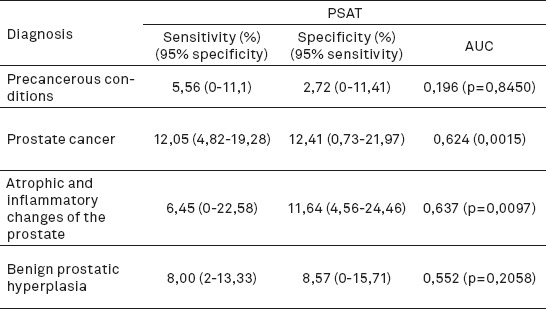
Specificity at 95% sensitivity was also the highest for prostate cancer –12.41% (0.73-21.97), slightly lower for atrophic and inflammatory changes of the prostate - 11.64% (4.56-24.46), and then benign prostatic hyperplasia - 8.57% (0-15.71). The lowest sensitivity is for precancerous conditions - 2.72% (0-11.41) (Table 1).
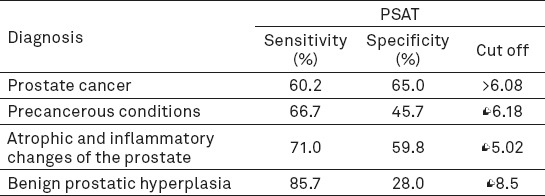
Analysis of the ROC curve estimates the best possible sensitivity and specificity at a specific cut-off values (Table 2). For prostate cancer optimal sensitivity and specificity for PSAT value occurs at cut off value of> 8.6 ng /mL.
Table 2.
Evaluation of the best possible sensitivity and specificity at a specific cut-off value
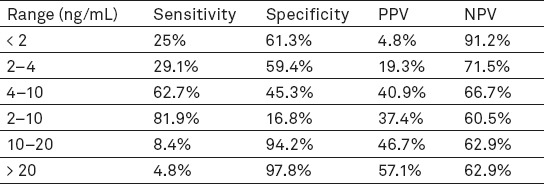
When the value of PSAT > 20 ng/mL, cancer was diagnosed in 57.1% of patients, but when values were from 10 to 20 ng/mL, cancer was diagnosed in 46.6% of patients. When the value of PSAT was in the range from 4 to 10 ng/mL, cancer was diagnosed in 40.9% of patients. Sensitivity and specificity of the PSAT is changing in relation to the range of values PSAT, as well as positive predictive value (PPV) and negative predictive value (NPV) (Table 3). Values lower than 2 ng/mL, and higher than 10 ng/mL are most specific values of PSAT, and PPV increases with increasing value of PSAT (Table 3).
Table 3.
The sensitivity and specificity of the PSAT at different ranges
4. DISCUSSION
In addition to digital rectal examination, PSA testing is essential in the diagnosis of prostate cancer. In a European study on screening of prostate cancer, it was found that if the digital rectal examination is used when PSA is higher than 1.5 ng/mL (digital rectal examination is not performed if PSA is < 1.5 ng / mL), 29 % of all biopsies would be eliminated, while retaining 95% of the sensitivity of detection of prostate cancer (11). Using digital rectal examination only in patients with PSA higher than 2.0 ng/mL, biopsy rate would be reduced by 36 %, while the sensitivity is reduced to only 92% (11). Among 10.523 men randomly covered by screening, it was determined that the rate of detection of prostate cancer using PSA, digital rectal examination and transrectal ultrasonography (TRUS) was 4.5 % compared to only 2.5 % when using only digital rectal examination. Among men who had PSA lower than 3.0 ng/mL, the PPV of digital rectal examination is only 4 % to 11 %. The only diagnostic tool that can confirm cancer is histopathological analysis of material obtained by biopsy (11). Because of the many inconsistencies when selecting biopsy techniques, the importance of proper interpretation of PSA has gained more significance. Before getting started with a routine PSA (until 1987) in 35% of patients who were thought to have clinically restricted prostate cancer, it was found that they had positive lymph nodes, while two-thirds had a pathologically advanced disease (20). At the moment, lymph node involvement is present in less than 5% of patients, and there is evidence that serial PSA testing (annual screening tests) has reduced the number of patients with pathologically advanced disease (21, 22). PSA testing detects more cancers than that they are discovered by digital rectal examination, and PSA testing reveals them much earlier, which is extremely important. Although many of these cancers have aggressive characteristics, there are cancers that can grow slowly enough not to present a risk to the patient. Nevertheless, there is no way to identify, with certainty, cancers that do not have a risk of spreading and potentially cause premature death or morbidity (23). PSA is the most sensitive test for the detection of early prostate cancer, but the combination of PSA value and digital rectal examination is significantly better, because cancer can be detected by digital rectal examination in patients who have prostate cancer despite normal PSA levels (less than 4.0 ng/mL). TRUS has not proved to be useful for early detection of prostate cancer compared to digital rectal examination combined with PSA value (24, 25). Evidence from three uncontrolled studies that allow direct comparison of PSA and DRE suggests that combining both tests improves overall detection rate for prostate cancer, compared to the single tests (26, 27, 28). Before using PSA tests, digital rectal examination revealed significantly less cancers, and between 1986 and 1991 there was a dramatic increase in the rate of detected cancers by 82%, due to PSA testing (29). Concerns occur when there is an enlargement of the prostate at the expense of BPH, which will lead to an increase in PSA. On one side, that can result in unnecessary biopsies and on the other, a patient with BPH can have/get cancer. This problem is particularly evident in “diagnostic gray zone” when PSA is between 4 and 10 ng/mL. The lack of specificity of higher PSA levels for prostate cancer is trying to be improved by additional tests such as the ratio of free to total PSA (PSAR), PSA density, PSA density of the transition zone, etc. The use of those tests also reduces the number of unnecessary biopsies, which are not only invasive and uncomfortable for the patient but they can also be a significant financial burden.
This research showed that the value of PSAT is the highest in patients with prostate cancer, compared to other prostate diseases. However, the value of PSAT correlates with a greater volume of cancer as well as with clinical and pathological stages of disease (30). With a negative DRE, when the PSA is less than 4 ng/mL, the probability of localized disease is 81-84%; when the PSA is in the range of 4 to 10 ng/mL, the probability of localized disease is 53-67%, and when the PSA is in the range of 10-20 ng / mL, this probability is 31-56%. With PSA below 20 ng/mL, the likelihood of distant metastases is very small. Despite the limitations of the PSA, this cancer marker used for predicting the stage of the disease is combined with other parameters, so a separate spreadsheet system called nomograms was created. The most famous, and the one with the most widespread clinical use, Partin nomogram, was made in 1993 (31). To this date, more than 80 different types of nomograms were made to help determine the stage of the disease, survival without biochemical relapse, predicting lymph node involvement or seminal vesicle cancer, bone metastases (most nomograms take into account the value of PSA). As this study has shown, the risk of cancer increases with the age of patients. The incidence of cancer increases with age; for men aged 40-44 years, the incidence was 9.2 / 100,000, and in men between 70-74 years, it was 984.8 / 100,000 (28). Results with all restrictions have confirmed that the highest incidence is between the age of 50 and 70, and that the value of PSAT increases with age. Our research showed that the lowest values of PSAT were found in BPH. Preden -Kerekovic et al. in their study also proved that the PSA was significantly higher in prostate cancer compared to benign prostatic hyperplasia (29). Chakraborty et al. have proven the same point (32). This research showed that when the level of PSAT is lower than 2.0 ng / mL, the chances for the existence of cancer are small, and the search of free PSA will give the doctor more information (32). Values over 10.0 ng/mL, generally indicate the necessity of biopsy, and values between 4.0 and 10.0 ng / mL are a diagnostic gray zone, and require an interpretation of PSAR (33). In this research, PSAT sensitivity was 62.7 % and specificity 45.3% for range of 4-10 ng/mL. Spencer determined for this value sensitivity of over 80 % and specificity of 50 % (33). Our research has found that the fro detection of prostate cancer optimal cut-off value is PSAT > 6.8 ng/mL, with the sensitivity of the test 60.2 % and specificity of 45.7 %. In atrophic and inflammatory changes of the prostate, the optimal cut-off value is < 5 ng/mL (sensitivity 71 %, specificity 59.8 %). Several European countries conducted a screening for prostate cancer, including Netherlands (Rotterdam) and Finland. In Rotterdam, data was recorded for the 7943 men, aged 55 to 74. Amongst 534 men who had PSA levels between 3.0 ng/mL and 3.9 ng/mL, 446 (83.5%) had a biopsy, and 96 (18%) of them had prostate cancer (a total of 4,7% of population that underwent the screening was diagnosed with prostate cancer) (34).
In a screening trial involving 6630 men, the positive predictive value of the PSA test increased from approximately 10% in men with a PSA <4 ng/mL, to greater than 80% in men with a PSA >20 ng/mL (35). In Finland, 15.685 of men were screened and at least 14% of them had PSA levels of at least 3.0 ng/mL. All men with a PSA higher than 4.0 ng/mL were recommended to undergo diagnostic monitoring which consisted of digital rectal examination, ultrasound and biopsy; 92% have complied with the recommendation and 2.6% of 15.685 screened men were diagnosed with prostate cancer (36). Out of 801 men with PSA levels between 3.0 ng/mL and 3.9 ng/mL (all patients underwent biopsy), 22 (3%) had cancer. Out of 1116 men with PSA levels between 4.0 ng/mL and 9.9 ng/mL, 247 (22%) had cancer, and out of 226 men with PSA levels of at least 10 ng/mL, 139 (62%) had cancer (36). Our results confirmed that levels of PSAT<2 ng/mL in prostate cancer show a 25% sensitivity, 61.3% specificity, PPV 4.8% and NPV 91.2%. Levels of PSAT between 10 and 20 ng/mL have 8.4% sensitivity and 94.2% specificity, while levels of PSAT greater than 20 ng/mL have 4.8% sensitivity and 97.8% specificity. While the specificity is 95%, PSAT has the greatest sensitivity in detecting prostate cancer (12,05%) followed by detecting BPH (8.00%). Tanguay et al. showed a 18% specificity for the given cut off level of 3 ng/mL in their research, so did Muller et al. too. Muller et al. had similar results with a 6.7% specificity while having a 95% sensitivity (cut off- 4-6 ng/mL) (38). Although the cut off level of 4.0 ng/mL is mostly used for quick prostate biopsies, screening studies showed that a decrease of the PSA cut off level will increase the number of diagnosed cancers (39). Furthermore, lower PSA cut-off levels are related with a high percentage of negative biopsies (false positive biopsies) (40). Aganovic et al proved that prostate cancer occurs in 34.4% of patients when PSAT levels are 4-10 ng/mL, in 23% when PSAT is lower than 4 ng/mL and in 37.5% of patients when PSAT is higher than 10 ng/mL (41). Our results showed the occurrence of prostate cancer in 40% of patients when PSAT levels are 4-10 ng/mL. Regarding other prostate diseases, our research showed that for precancerous conditions, when PSAT had the optimal cut off level <6.18, it showed a 66.7% sensitivity and 45.7% specificity. In atrophic and inflammatory changes, when PSAT had the optimal cut off level <5.02, it had 71% sensitivity and 59.8% specificity. In benign prostatic hyperplasia, when PSAT had the optimal cut off level <8.5, it had 85.7% sensitivity and 28% specificity. A combination of digital rectal examination and PSA level analysis (PSAT and PSAR) represents a screening method that greatly helps in early detection of prostate cancer and in that way allows a prompt action of the clinician. Similarly, when the PSA and DRE levels are normal, the probability of missing the cancer is 10% (42).
Although the results of specificity and sensitivity for prostate cancer detection were slightly below the value of the results obtained by other researchers, this research showed levels of sensitivity and specificity for other most common prostatic diseases. This can be a valuable tool in clinicians daily work. PSA level is still a tool, but it is not a method whereby a final diagnosis can be given, and requires the complementarity of other non-invasive and invasive diagnostic methods. However, it should be emphasized that the proper diagnosis of prostate diseases can be difficult due to the lack of specificity and sensitivity of diagnostic tests.
5. CONCLUSION
PSA (PSAT) at values of <2 ng/mL and > 10 ng/mL are at high levels of specificity, and a value > 10 ng / mL is also of high sensitivity in the detection of prostate cancer, and in this moment these values represent the optimal mode for the subsequent treatment. Levels of PSAT between 4-10 ng / mL still remain unknown in the daily work of clinicians and require the complementarity of all the mentioned non-invasive and invasive diagnostic tests, with more frequent reevaluations. PSAT has a relative significance in the detection of prostate cancer, and should not be used as a guideline without prior clinical examination (digital rectal examination). Prostate biopsy remains the gold standard for final diagnosis of prostate disease. Since the value of PSAT is affected by many etiological factors, especially age, PSAT values are not fully reliable and exclusive analysis is not enough specific nor sensitive for the distinction between prostate diseases.
Footnotes
• Conflict of interest: None declared.
REFERENCES
- 1.Valcour AA, Bowers GN, Jr, McComb RB. Evaluation of a kinetic method for prostatic acid phosphatase with use of self-indicating substrate, 2,6-dichloro-4-nitrophenyl phosphate. Clin Chem. 1989;35(6):939–45. [PubMed] [Google Scholar]
- 2.Wang MC, Valenzuela LA, Murphy GP, Chu TM. Purification of a human prostate specific antigen. Invest Urol. 1979;17:159–63. [PubMed] [Google Scholar]
- 3.Hara M, Koyanagi Y, Inoue T, Fukuyama T. Some physico-chemical characteristics of gamma seminoprotein, an antigenic component specific for human seminal plasma. Nippon Hoigaku Zasshi. 1971;25:322–4. [PubMed] [Google Scholar]
- 4.Lilja H. Kallikrein-like serine protease in prostatic fluid cleaves the predominant seminal vesicle protein. Journal of Clinical Investigation. 1985;76:1899–1903. doi: 10.1172/JCI112185. [DOI] [PMC free article] [PubMed] [Google Scholar]
- 5.Lundwall A, Lilja H. Molecular cloning of human prostate specific antigen cDNA. FEBS Letters. 1987:214–317. doi: 10.1016/0014-5793(87)80078-9. [DOI] [PubMed] [Google Scholar]
- 6.Reigman PH, Vlietstra RJ, Suurmeijer L, Cleutjens CB, Trapman J. Characterisation of the human kallikrein locus. Genomics. 1992;14:6–11. doi: 10.1016/s0888-7543(05)80275-7. [DOI] [PubMed] [Google Scholar]
- 7.Sokoll LJ, Chan DW. Prostate-specific antigen. Its discovery and biochemical characteristics. Urol Clin North Am. 1997;24:253–9. doi: 10.1016/s0094-0143(05)70370-0. [DOI] [PubMed] [Google Scholar]
- 8.Sensabaugh GH. Isolation and characterisation of a semen- specific protein from human seminal plasma:a potential new marker for serum identification. Journal of Forensic Science. 1978;23:106–15. [PubMed] [Google Scholar]
- 9.Christensson A, Laurell CB, Lilja H. Enzymatic activity of prostatic specific antigen and its reactions with extracellular serine protease inhibitors. European Journal of Biochemistry. 1990;194:755–63. doi: 10.1111/j.1432-1033.1990.tb19466.x. [DOI] [PubMed] [Google Scholar]
- 10.Lilja H, Ulmert D, Vickers AJ. Prostate-specific antigen and prostate cancer:prediction, detection and monitoring. Nat Rev Cancer. 2008;8(4):268–78. doi: 10.1038/nrc2351. [DOI] [PubMed] [Google Scholar]
- 11.Spajicć B. Procjena rizika biokemijskog relapsa karcinoma prostate nakon radikalne prostatektomije na osnovi patohistoloških obilježja bioptata (doktorska disertacija) Zagreb: Medicinski fakultet, Sveučilište u Zagrebu; 2008. [Google Scholar]
- 12.Nickel JC. Benign Prostatic Hyperplasia:Does Prostate Size Matter? Reviews in Urology. 2003;5(Suppl 4):S12–S17. [PMC free article] [PubMed] [Google Scholar]
- 13.Moon DG, Yu JW, Lee JG, Kim JJ, Koh SK, Cheon J. The influence of prostate volume on the prostate-specific antigen (PSA) level adjusted for the transition zone volume and free-to-total PSA ratio:a prospective study. BJU Int. 2000;86(6):670–4. doi: 10.1046/j.1464-410x.2000.00838.x. [DOI] [PubMed] [Google Scholar]
- 14.Oesterling JE, Jacobsen SJ, Chute CG, et al. Serum prostate-specific antigen in a community-based population of healthy men. JAMA. 1993;270:860–86. [PubMed] [Google Scholar]
- 15.Labrie F, Dupont A, Suburu R, et al. Serum prostate specific antigen as pre-screening test for prostate cancer. J Urol. 1992;147:846–52. doi: 10.1016/s0022-5347(17)37402-5. [DOI] [PubMed] [Google Scholar]
- 16.Catalona WJ, Smith DS, Ratliff TL, Dodds MK, Coplen DE, Yuan JJJ, et al. Measurement of prostate-specific antigen in serum as a screening test for prostate cancer. N Engl J Med. 1991;324:1156–61. doi: 10.1056/NEJM199104253241702. [DOI] [PubMed] [Google Scholar]
- 17.Ronnette BM, CarMicheal MJ, Carter HB, Epstein JI. Does prostatic intraepithelial neoplasia result in elevated serum prostate specific antigen levels? J Urol. 1993;150:386–9. doi: 10.1016/s0022-5347(17)35488-5. [DOI] [PubMed] [Google Scholar]
- 18.Nickel JC. Benign Prostatic Hyperplasia:Does Prostate Size Matter? Reviews in Urology. 2003;5(Suppl 4):S12–S17. [PMC free article] [PubMed] [Google Scholar]
- 19.Moon DG, Yu JW, Lee JG, Kim JJ, Koh SK, Cheon J. The influence of prostate volume on the prostate-specific antigen (PSA) level adjusted for the transition zone volume and free-to-total PSA ratio:a prospective study. BJU Int. 2000;86(6):670–4. doi: 10.1046/j.1464-410x.2000.00838.x. [DOI] [PubMed] [Google Scholar]
- 20.Partin AW, Kattan MW, Subong ENP. Combination of prostate-specific antigen, clinical stage, and Gleason score to predict pathological stage of localized prostate cancer:a multi-institutional update. JAMA. 1997;277:1445–54. [PubMed] [Google Scholar]
- 21.Smith DS, Catalona WJ, Herschman JD. Longitudinal screening for prostate cancer with prostate specific anti- gen. JAMA. 1996;276:1309–15. [PubMed] [Google Scholar]
- 22.Dugan JA, Bostwick DG, Myers RP. The definition and preoperative prediction of clinically insignificant prostate cancer. JAMA. 1996;275:288–94. [PubMed] [Google Scholar]
- 23.Coley CM, Barry MJ, Fleming C, Fahs MC, Mulley AG. Early detection of prostate cancer. Part I:prior probability and effectiveness of tests. Ann Intern Med. 1997;126:394–406. doi: 10.7326/0003-4819-126-5-199703010-00010. [DOI] [PubMed] [Google Scholar]
- 24.Coley CM, Barry MJ, Fleming C, Wasson JH, Fahs MC, Oesterling JE. Should Medicare provide reimbursement for prostate-specific antigen testing for early detection of prostate cancer? Part II:early detection strategies. Urology. 1995;46:125–141. doi: 10.1016/s0090-4295(99)80181-2. [DOI] [PubMed] [Google Scholar]
- 25.Bretton PR. Prostate-specific antigen and digital rectal examinationination in screening for prostate cancer:a community- based study. South Med J. 1994;87:720. doi: 10.1097/00007611-199407000-00009. [DOI] [PubMed] [Google Scholar]
- 26.Muschenheim F, Omarbasha B, Kardjian PM. Screening for carcinoma of the prostate with prostate specific antigen. Ann Clin Lab Sci. 1991;21:371–80. [PubMed] [Google Scholar]
- 27.Potosky AL, Miller BA, Albertsen PC, Kramer BS. The role of detection in the rising incidence of prostate cancer. JAMA. 1995;273:548–52. [PubMed] [Google Scholar]
- 28.Surveillance Epidemiology and End Results Program (SEER) of the National. Cancer Institute. Fast Stats:An interactive tool for access to SEER cancer statistics. Bethesda, MD: SEER, National Cancer Institute; [Google Scholar]
- 29.Preden- Kereković V, Zeljko Ž, Milivoj L. Dijagnostička vrijednost udjela slobodnog PSA u diferencijalnoj dijagnozi oboljenja prostate. Zagreb: Biochemica Medica; 2001. [Google Scholar]
- 30.Partin AW, Carter HB, Chan DW. Prostate specific antigen in the staging of localized prostate cancer:influence of tumor differentiation, tumor volume and benign hyperplasia. J Urol. 1990;143:747–52. doi: 10.1016/s0022-5347(17)40079-6. [DOI] [PubMed] [Google Scholar]
- 31.Partin AW, Yoo J, Pearson JD, Chan DW, Epstein JI, Walsh PC. The use of PSA, clinical stage and Gleason score to predict pathological stage in men with localized prostate cancer. J Urol. 1993;150:110–4. doi: 10.1016/s0022-5347(17)35410-1. [DOI] [PubMed] [Google Scholar]
- 32.Chakraborty L, Ahmed AN, Paul BK, Haque A, Ara A, Nabi S, et al. Comparative study of total prostate specific antigen and free to total prostate specific antigen ratio in the diagnosis of prostate cancer. Med J. 2012;21(1):98–102. [PubMed] [Google Scholar]
- 33.Spencer DV. Prostate Specific Antigen Testing:An Update. NewsPath. 2010 [Google Scholar]
- 34.Schröder FH, Roobol-Bouts M, Vis AN. Prostate-specific antigen-based early detection of prostate cancer - validation of screening without rectal examinationination. Urology. 2001;57(1):83–90. doi: 10.1016/s0090-4295(00)00863-3. [DOI] [PubMed] [Google Scholar]
- 35.Catalona WJ, Richie JP, Ahmann FR, M’Hudson MA, Scardino PT, Flanigan RC, et al. Comparison of digital rectal examinationination and serum prostate specific antigen in the early detection of prostate cancer:results of a multicentre clinical trial of 6630 men. Journal of Urology. 1994;151:1283–90. doi: 10.1016/s0022-5347(17)35233-3. [DOI] [PubMed] [Google Scholar]
- 36.Määttänen L, Auvinen A, Stenman UH, Tammela T, Rannikko S, et al. Three-year results of the Finnish prostate cancer screening trial. J Natl Cancer Inst. 2001;93(7):552–3. doi: 10.1093/jnci/93.7.552. [DOI] [PubMed] [Google Scholar]
- 37.Tanguay S, Bégin LR, Elhilali MM, Behlouli H, Karakiewicz PI, Aprikian AG. Comparative evaluation of total PSA, free/total PSA, and complexed PSA in prostate cancer detection. Urology. 2002 Feb;59(2):261–5. doi: 10.1016/s0090-4295(01)01497-2. [DOI] [PubMed] [Google Scholar]
- 38.Miller GJ, Brawer MK, Sakr WA, Thrasher JB, Townsend R. Prostate Cancer:Serum and Tissue Markers. Reviews in Urology. 2001;3(2):S11–S19. [PMC free article] [PubMed] [Google Scholar]
- 39.Smith DS, Carvalhal GF, Mager DE, Bullock AD, Catalona WJ. Use of lower prostate specific antigen cutoffs for prostate cancer screening in black and white men. J Urol. 1998;160(5):1734–8. [PubMed] [Google Scholar]
- 40.Moul JW, Connelly RR, Mooneyhan RM, Zhang W, Sesterhenn IA, Mostofi FK, et al. Racial differences in tumor volume and prostate specific antigen among radical prostatectomy patients. J Urol. 1999;162(2):394–7. [PubMed] [Google Scholar]
- 41.Aganovic D, Prcic A, Kulovac B, Hadziosmanovic O. Prostate cancer detection rate and the importance of premalignant lesion in rebiopsy. Med Arh. 2011;65(2):109–12. [PubMed] [Google Scholar]
- 42.Pérez-Lanzac-Lorca A, Barco-Sánchez A, Romero E, Martinez-Peinado A, López-Elorza F, Sanchez-Sanchez E, et al. Correlation between the complex PSA/total PSA ratio and the free PSA/total PSA ratio, sensitivity and specificity of both markers for the diagnosis of prostate cancer. Actas Urol Esp. 2013;37(8):498–503. doi: 10.1016/j.acuro.2012.11.014. [DOI] [PubMed] [Google Scholar]


