Abstract
Purpose
A research photon-counting CT system that consists of an energy-integrating detector (EID) and a photon-counting detector (PCD) was installed in our laboratory. The scanning fields-of-view (SFOV) of the EID and PCD at the iso-center are 500 mm and 275 mm, respectively. When objects are larger than the PCD SFOV, a data-completion scan (DCS) using the EID subsystem is needed to avoid truncation artifacts in PCD images. The goal of this work was to 1) find the impact of a DCS on noise of PCD images, and 2) determine the lowest possible dose for a DCS such that truncation artifacts are negligible in PCD images.
Methods
First, two semi-anthropomorphic abdomen phantoms were scanned on the PCD subsystem. For each PCD scan, we acquired one DCS with the maximum effective mAs and five with lower effective mAs values. The PCD image reconstructed using the maximum effective mAs was considered as the reference image, and those using the lower effective mAs as the test images. The PCD image reconstructed without a DCS was considered the baseline image. Each PCD image was assessed in terms of noise and CT number uniformity; the results were compared among the baseline, test, and reference images. Finally, the impact of a DCS on PCD image quality was qualitatively assessed for other body regions using an anthropomorphic torso phantom.
Results
The DCS had a negligible impact on the noise magnitude in the PCD images. The PCD images with the minimum available dose (CTDIvol < 2 mGy) showed greatly enhanced CT number uniformity compared to the baseline images without noticeable truncation artifacts. Further increasing the effective mAs of a DCS did not yield noticeable improvement in CT number uniformity.
Conclusion
A DCS using the minimum available dose had negligible effect on image noise and was sufficient to maintain satisfactory CT number uniformity for the PCD scans.
Keywords: CT, Data Completion Scan, Photon-counting CT, Dose
Introduction
Photon-counting CT (PCCT) is an emerging x-ray imaging technique with great potential in clinical practice [1–4]. It is capable of generating multi-energy projection data in a single scan, which opens the door to new applications, such as k-edge subtraction for multi-basis material decomposition. In addition, PCCT has the potential to provide improved spatial resolution, dose efficiency, contrast-to-noise ratio [5] and low-dose performance. Although PCCT in the current form does not outperform the state-of-the-art dual-energy CT, it has conceptual advantages and might have better performance with future advancement in detector technology, as recently reported in [6, 7].
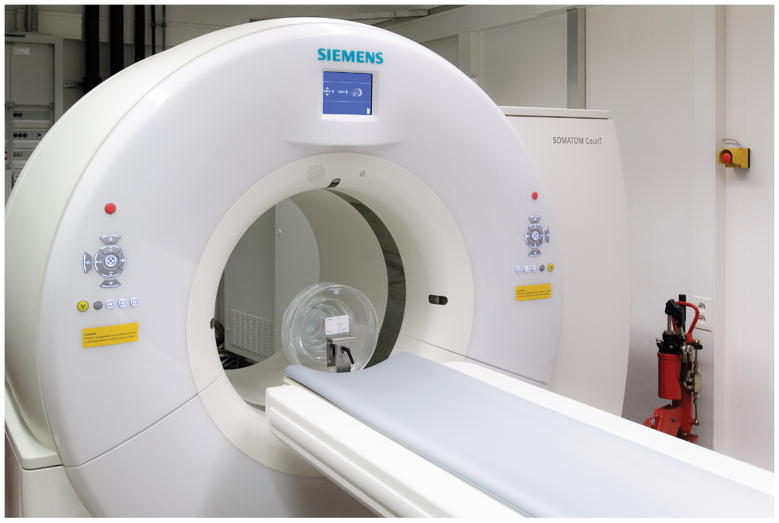
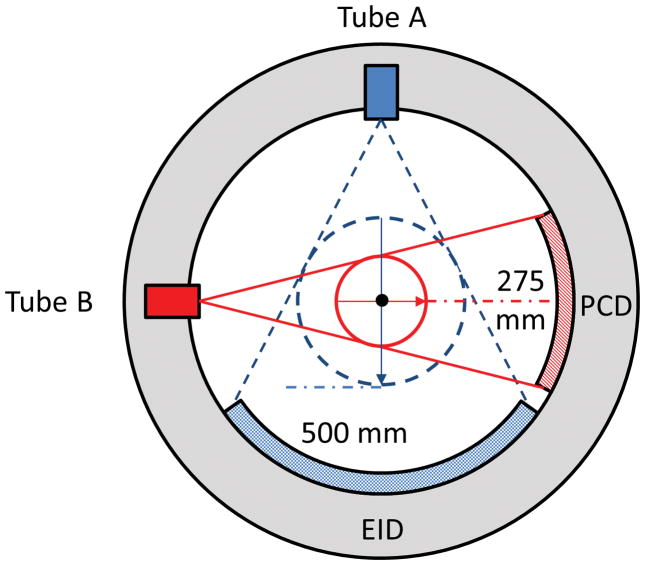
Recently, a research whole-body PCCT system [8–10] was installed in our laboratory. This system is built on the platform of the 2nd generation dual-source CT scanner (SOMATOM Definition FLASH, Siemens Healthcare, Forchheim, Germany; see Figure 1). It consists of two equivalent x-ray tubes that are located about 90° apart from each other, with one coupled to an energy-integrating detector (EID, Stellar, Siemens Healthcare) and the other to a photon-counting detector (PCD). The EID consists of 64 detector rows, with each row containing 736 channels, resulting in a 500 mm (diameter) scanning field-of-view (SFOV) at the iso-center. The PCD is CdTe Based. It is composed of 32 rows, with each row containing 480 channels, resulting in a 275 mm (diameter) SFOV at the iso-center. We refer to these two subsystems as the EID subsystem and the PCD subsystem; see Figure 2.
Figure 1.
Photograph of the research photon-counting CT system (Siemens Healthcare, Forchheim, Germany).
Figure 2.
Schematic drawing of the research photon-counting CT system. It is based on a 2nd generation dual-source CT system, with one source coupled to an energy-integrating detector (EID) and the other to a photon-counting detector (PCD). The fields-of-view of the EID and PCD subsystems are 500 mm and 275 mm, respectively.
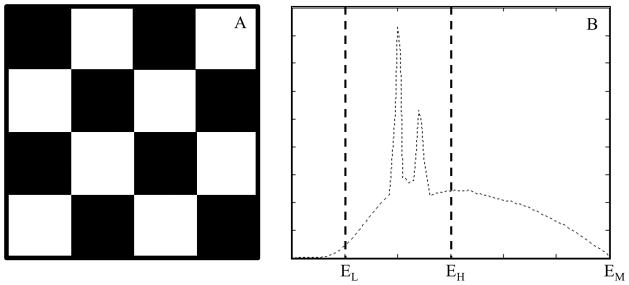
At present, the smallest readout unit of the PCD is called a macro pixel, which consists of 4×4 sub-pixels of size 0.225 mm × 0.225 mm; see Figure 3A. Each sub-pixel registers two energy thresholds. Depending on the threshold configuration of the 16 sub-pixels, the PCD subsystem provides two data acquisition modes, namely the macro mode and the chess mode. In the macro mode, each of the 16 sub-pixels uses the same two energy thresholds. In the chess mode, the 16 sub-pixels are interlaced into two 8-sub-pixel groups (Figure 3A), with each group using two different energy thresholds, resulting in 4 energy thresholds in total. For the purpose of this work, it was sufficient to use the macro mode; similar outcome is expected with the chess mode. Therefore, we will only focus on the macro mode in the rest of this paper. More details of the research PCCT system can be found in [5, 8–13].
Figure 3.
A: A macro pixel consists of 4×4 sub-pixels of size 0.225 mm × 0225 mm. Each sub-pixel uses two energy thresholds. B: The notation used in the macro mode.
The two energy thresholds of the macro mode are called threshold low and threshold high, which are denoted as EL keV and EH keV (Figure 3B). For each energy threshold, the system records all photons with energy higher than the energy threshold. Let EM be the maximum energy of the input x-ray spectrum (equal to the kVp of the X-ray beam used). Each macro mode produces three sets of images: 1) threshold-low images corresponding to x-ray photons of energy greater than threshold low ([EL, EM] keV); 2) bin-1 images corresponding to x-ray photons of energy between threshold low and threshold high ([EL, EH] keV); and 3) bin-2 images corresponding to x-ray photons of energy between threshold high and the maximum available energy ([EH, EM] keV). Both the EID and PCD subsystems provide two types of scan protocols: 1) Head scan protocols that use a carbon bowtie filter, and 2) abdominal scan protocols that uses the carbon bowtie filter and an aluminum bowtie filter [8, 10].
Currently, the reconstruction algorithm used on the PCD subsystem is based on the weighted-filtered-back-projection (WFBP) algorithm [14]. This algorithm first rebins cone-beam data into pseudo-parallel sinograms. The rebinned data are then filtered with an apodized ramp filter. Finally, images are reconstructed by back-projecting the filtered data. Note that the filtering process is effectively along the tangent of the source trajectory. Therefore, for a circular scan, the filtering is along the transverse direction, whereas for a spiral scan, although a small component of the filtering direction is longitudinal, its major component is however still in the transverse direction.
Due to the limited 275 mm SFOV, the projection data of the PCD subsystem are truncated in the transverse direction when part of the imaged object is located outside the PCD SFOV. This problem does not exist for head scans, but always exists for the body scans because part of the patient table is always outside the SFOV of the PCD subsystem. With transversely truncated projection data, the filtering process cannot be performed accurately as it is a global operation. Such contamination in the filtered data is expected to have a limited impact on noise magnitude of PCD images [15, 16]: For a given image pixel reconstructed using an FBP-type algorithm, its noise magnitude is mainly determined by the noise of the projection data associated with the back-projection rays that go through the given image pixel; contributions of other rays to the noise magnitude diminishes quickly from these back-projection rays. For example, as reported in [15, 16], for 2D conventional FBP-type reconstruction algorithms (both fan-beam and parallel beam data), the impact of individual x-rays on noise variance drops approximately 1 over the 4th power of the distance to the ray that goes through the image pixel of interest. However, the contaminated filtered projection data have a more substantial impact on CT number, which induces cupping artifacts in the reconstructed PCD images [17–20]: A bright halo appears near the boundary of the PCD SFOV with a gradient towards to the center. Depending on the degree of data truncation, such cupping artifacts may severely degrade diagnostic performance.
By default, the PCD subsystem automatically activates a truncation correction algorithm once it detects transverse data truncation. This algorithm is based on [17, 21]: The in-plane dimension of the imaged object is approximated, and the projection data are extrapolated along the filtering direction. As pointed out in [17], such an extrapolation-based correction algorithm works well with objects that are fairly uniform at the boundary of the SFOV, but may be not good enough for objects whose x-ray attenuation varies a lot along the boundary of the SFOV, e.g., the shoulders.
To maintain PCD image quality in different transverse data truncation scenarios, a more sophisticated method has been developed and installed on the PCD subsystem. This correction method works as follows. In addition to a targeted PCD scan, an additional scan of the imaged object using the EID subsystem (with SFOV of 500 mm) is employed. Such a scan is called a data-completion scan (DCS). The DCS data are used to estimate the missing projection data outside the PCD SFOV so that a complete set of projection data will be available to avoid truncation artifact. Note that the estimated PCD projection data are only needed during the ramp-filtering step of the image reconstruction algorithm, and that the filtered data outside of the SFOV are not used during the back-projection process. Consequently, the final reconstructed image from the PCD subsystem is limited to the 275 mm SFOV. A rough estimation is expected to be sufficient to suppress the occurrence of truncation artifacts. Therefore, the scan settings of the DCS, such as tube current, can be different from the corresponding PCD scan. Note that DCS data do not enlarge the PCD images beyond the SFOV of the PCD subsystem. For convenience, we call this DCS-based truncation-correction method the DCS method. It is important to note that the DCS method is not limited to the particular research PCCT system; it is generalizable to a class of volume-of-interest (VOI) imaging methods that use an additional scan for missing sinogram estimation. A number of such examples will be provided in the Discussion section.
Theoretically, it is generally expected that a DCS should have negligible impact on noise of PCD images. Also, as with other extrapolation-based VOI imaging techniques (e.g., [17, 18]), it is expected that a low-dose DCS would be sufficient to provide a good approximation of the missing projection data for the ramp filtering step, and thus avoid truncation artifacts. However, as the manufacturer’s specific DCS method is proprietary, further theoretical analysis of the performance of the DCS method is not possible. Therefore, the purpose of this work was to experimentally validate our general theoretical predictions. In particular, the goals of this work were 1) to demonstrate that a DCS has negligible impact on noise of the resultant PCD images, and 2) to find the lowest possible dose for a DCS on our specific scanner such that truncation artifacts are negligible in the resultant PCD images.
Materials and Methods
The impact of a DCS on the resultant PCD image was assessed qualitatively via visual inspection, and quantitatively in terms of noise and CT number uniformity. Our assessment only focused on body scans, as head scans do not require a DCS. All assessments were carried out using macro mode threshold-low images, as this is sufficient to achieve the stated goals of this study. Two semi-anthropomorphic abdomen phantoms and one anthropomorphic torso phantom were used for the assessments (Figure 4). The semi-anthropomorphic phantoms were selected because they provide a simple model of the human abdomen while providing uniform regions for quantitative assessment, whereas the anthropomorphic phantom was selected for qualitative assessment of the impact of a DCS on different regions of human anatomy (e.g. shoulder, thorax and abdomen) that have different degree of truncation. Note that we did not select pure water phantoms for quantitative measurements, because, without a DCS, PCD image reconstructions by default activate the extrapolation-based truncation-correction algorithm, which works well for uniform objects.
Figure 4.
Two types of anthropomorphic phantoms were used for DCS impact assessment. A: Two semi-anthropomorphic abdomen phantoms. B: An anthropomorphic torso phantom.
The two semi-anthropomorphic abdomen phantoms were used to represent a medium adult (model 007TE-07, CIRS, Norfolk, Virginia) and a large adult (model 007TE-08, CIRS). The medium CIRS phantom was 25.0 cm high in the anterior-posterior direction and 32.5 cm wide in the lateral direction, whereas the large CIRS phantom was 31.0 cm high in the anterior-posterior direction and 38.9 cm wide in the lateral direction. Both CIRS phantoms were aligned at the iso-center of the research PCCT system. Consequently, projection data of the medium CIRS phantom were only laterally truncated, whereas those of the large CIRS phantom were truncated in all radial directions.
The phantoms were scanned using abdominal protocols with 0.5 s rotation time and a 0.6 pitch. Tube potentials of 120 kV and 140 kV were used, as these are typical for standard- and large-sized patients, where most data truncation would occur. The PCD energy thresholds used for 120 kV and 140 kV scans were [25, 62] keV and [25, 65] keV, respectively. Effective mAs was adjusted for each PCD scan such that the corresponding dose level matched what is used in our routine abdominal CT exams; detailed effective mAs values and their corresponding dose levels are listed in Table 1. All scans were repeated for noise measurement purposes. For each PCD scan, six DCSs were acquired, with one using the maximum available effective mAs (663 mAs at 120 kV and 568 mAs at 140 kV), and the rest using effective mAs of values 17, 22, 27, 32, and 37 (17 was the minimum available mAs for a 0.6 pitch). Note that, other than the effective mAs, the DCSs were acquired with identical, or the closest available, scan parameters as those of the target PCD scan, except for the detector collimator, which was 128×0.6 mm for the EID (the only choice on the current system) and 32×0.5 mm for the PCD.
Table 1.
List of Effective mAs and CT Dose Index Values for the Scans of the CIRS Phantoms.
| PCD eff. mAs (CTDIvol-32 cm) | DCS min. eff. mAs (CTDIvol-32 cm) | DCS max. eff. mAs (CTDIvol-32 cm) | |
|---|---|---|---|
| Medium @ 120 kV | 150 mAs (11.41 mGy) | 17 mAs (1.13 mGy) | 663 mAs (44.21 mGy) |
| Medium @ 140 kV | 104 mAs (11.54 mGy) | 17 mAs (1.64 mGy) | 568 mAs (55.08 mGy) |
| Large @ 120 kV | 262 mAs (19.97 mGy) | 17 mAs (1.18 mGy) | 663 mAs (44.16 mGy) |
| Large @ 140 kV | 174 mAs (19.20 mGy) | 17 mAs (1.64 mGy) | 568 mAs (55.08 mGy) |
Threshold-low PCD images of the CIRS phantoms were reconstructed using a medium smooth kernel (D30), 3 mm slice thickness, and 2.5 mm slice increment, the same as those used in our clinical routine. We refer to the PCD images reconstructed without any DCS, with DCSs of low effective mAs, and with DCSs of the maximum effective mAs, as the baseline, test, and reference images, respectively. For each PCD scan configuration, results of both qualitative and quantitative assessment were compared among the baseline, test, and reference images.
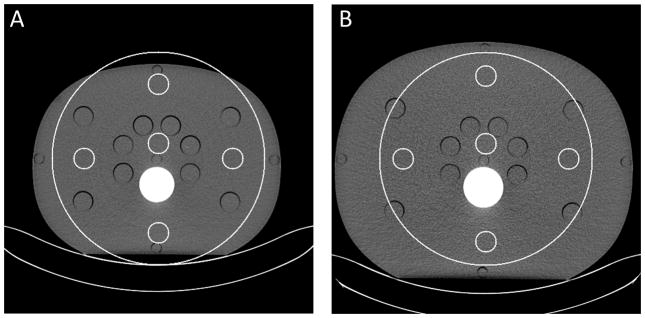
For qualitative assessment, all threshold-low PCD images of the CIRS phantom were visually inspected for noticeable truncation artifacts first. Then, each PCD image was quantitatively assessed using five region-of-interests (ROIs), with one roughly located at the center, and the other four located at 3, 6, 9, and 12 o’clock peripheral locations; see Figure 5. The central ROI was slightly off center so as to exclude the cylindrical opening located at the center. All peripheral ROIs were completely within the CIRS phantoms. Due to the size difference, the peripheral ROIs used in the medium CIRS phantom were slightly closer to the center than those used in the large CIRS phantom. For noise measurement, difference images between two equivalent scan configurations were generated. Standard deviation (std) was calculated for each of the ROIs in the difference images and normalized by . For uniformity assessment, four absolute differences in CT number between the central ROI and the peripheral ROIs were calculated for each PCD image, and the average and maximum values of the four differences were used as uniformity indicators. All results were compared among the baseline, test, and reference images.
Figure 5.
Regions-of-interest (ROIs) used in the assessment of noise and CT number uniformity for the medium (A) and large (B) CIRS phantoms. Small and large circles indicate ROIs and the FOV of the PCD subsystem.
The anthropomorphic torso phantom was used to assess the impact of a DCS on other body regions; see Figure 4B. The shoulder, thorax, and abdomen of the torso phantom were scanned on the PCD subsystem using organ specific protocols at 140 kV with thresholds [25, 65] keV. In particular, the shoulder, thorax, and abdomen scans used rotation times of 1.0 s, 0.5 s, and 0.5 s, and pitch values of 1.0, 0.9, and 0.6, respectively. The dose level of each PCD scan matched what is used in our routine CT exams for the corresponding body regions; detailed effective mAs values and their corresponding dose levels are listed in Table 2. For each PCD scan, two DCSs with the minimum and maximum effective mAs were performed. Threshold-low PCD images of the shoulder were reconstructed using a kernel with bone beam hardening correction (D34), whereas those of the thorax and abdomen were with a medium smooth kernel (D30). All threshold-low PCD images were reconstructed using 1.5 mm slice thickness and 1 mm slice increment. The baseline, test, and reference images were compared visually in terms of truncation artifacts.
Table 2.
List of Effective mAs and CT Dose Index Values for the Scans of the Torso Phantom.
| Torso Portion | PCD eff. mAs (CTDIvol-32 cm) | DCS min. eff. mAs (CTDIvol-32 cm) | DCS max. eff. mAs (CTDIvol-32 cm) |
|---|---|---|---|
| Shoulder | 146 mAs (16.17 mGy) | 20 mAs (1.87 mGy) | 570 mAs (55.38 mGy) |
| Thorax | 42 mAs (4.55 mGy) | 12 mAs (1.20 mGy) | 379 mAs (32.27 mGy) |
| Abdomen | 66 mAs (7.38 mGy) | 17 mAs (1.72 mGy) | 549 mAs (53.36 mGy) |
Results
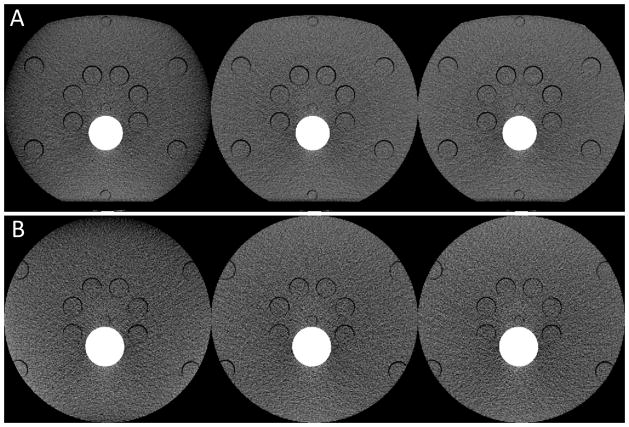
We observed evident capping and gradient truncation artifacts in the baseline images of the medium and large CIRS phantoms, respectively; see Figure 6. Conversely, both test and reference images presented comparable and satisfactory image quality: no noticeable truncation artifacts were observed in either images.
Figure 6.
PCD images of the medium (A) and large (B) CIRS abdomen phantoms obtained from 140 kV scans. These PCD images were generated using the macro mode with an energy range of [25, 140] keV. Display: W/L = 300/40 HU. Left to right: PCD images reconstructed without using any DCS (baseline images), using a DCS with the minimum effective mAs (test images), and using a DCS with the maximum effective mAs (reference images). The test images corresponding to the minimum effective mAs achieved substantial reduction of truncation artifacts and had comparable appearance as the reference images.
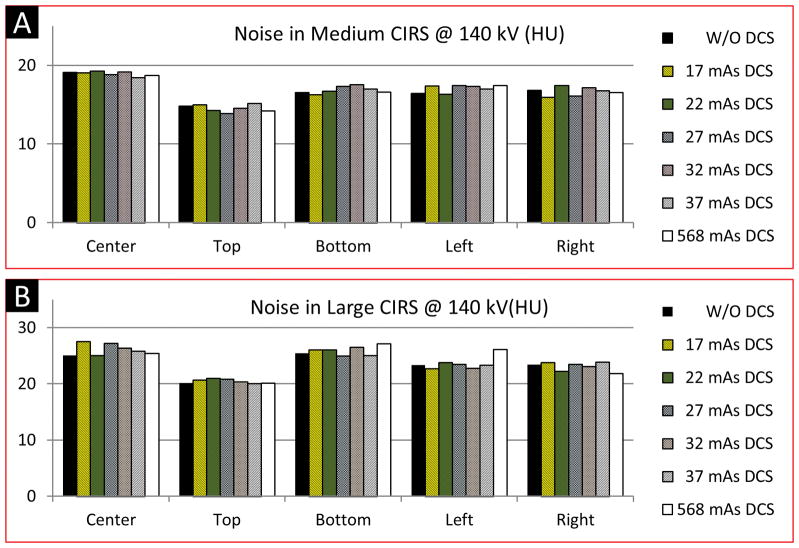
Noise measured in the test images was close to that measured in the baseline images. For any of the five ROIs, differences between the noise measured from the baseline images and that measured from the test images were within ± 2.5 HU, with about 90% strictly within ± 1HU. It was observed that the noise magnitude in the test images, even at high mAs of DCS scans, were not consistently lower or higher than the baseline images. In general, the relationship was random. This observation indicates that a DCS had negligible impact on noise in the resultant PCD image, and that increasing the effective mAs of a DCS did not reduce noise in the PCD images. The results of noise assessment corresponding to the 140 kV scans are shown in Figure 7; similar results were observed for the 120 kV scans.
Figure 7.
Results of noise assessment using the medium (A) and large (B) CIRS phantoms scanned at 140 kV. The PCD images used for the noise assessment were generated using the macro mode with an energy range of [25, 140] keV. Legends: baseline images – W/O DCS; Test images – 17, 22, 27, 32, 37 mAs DCS; Reference images – 568 mAs DCS.
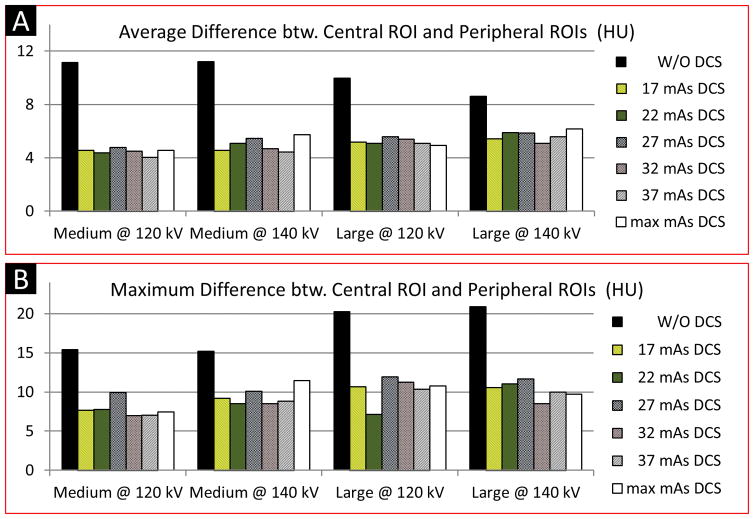
Results of CT number uniformity of the CIRS phantoms are shown in Figure 8. Compared to the baseline images, the test images reconstructed using the DCSs with the minimum effective mAs exhibited 37% ~ 59% improvement in CT number uniformity. No improvement was observed in CT number uniformity when the effective mAs of a DCS increased from the minimum available value to the maximum value. Hence, both our qualitative and quantitative assessments demonstrate that a DCS with the minimum available effective mAs had negligible effect on image noise and was sufficient to maintain satisfactory CT number uniformity for abdominal PCD scans.
Figure 8.
Results of CT number uniformity assessment using the CIRS phantoms. The PCD images used for the uniformity assessment were generated using the macro mode with two energy ranges: [25, 120] keV for 120 kV scans, and [25, 140] keV for 140 kV scans. Compared to the baseline images (W/O any DCS), substantial improvement in CT number uniformity was achieved in the test images. Increasing dose in DCS did not yield noticeable improvement in terms of CT number uniformity in PCD images. Legends: Baseline images – W/O DCS; Test images – 17, 22, 27, 32, 37 mAs DCS; Reference images – 568 mAs DCS.
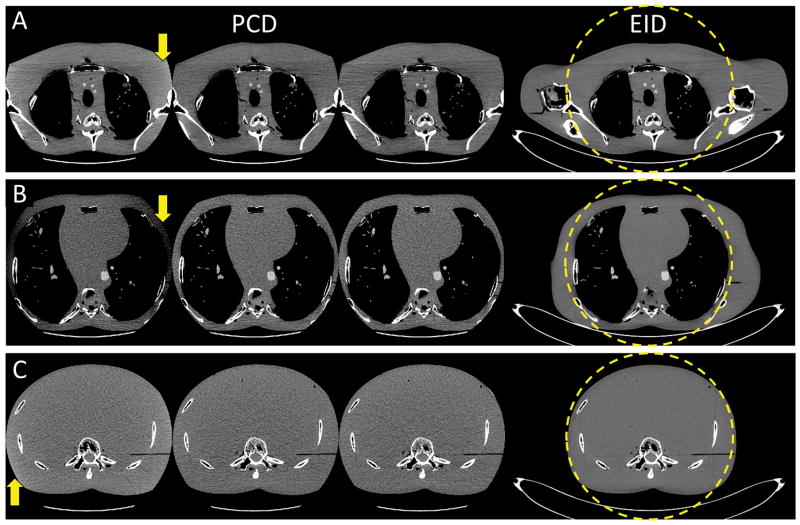
Images of the anthropomorphic phantom are shown in Figure 9. The EID images from complete projection data demonstrate that the amount and direction of data truncation were markedly different among the shoulder, thorax and abdomen. Consequently, the baseline images of these body regions exhibited different patterns of truncation artifacts: Evident cupping and capping artifacts in the lateral direction were observed in the shoulder and thorax images, respectively, whereas only slight cupping artifacts were observed in the abdomen images. All truncation artifacts were corrected in the test PCD images that were reconstructed using DCSs with the minimum effective mAs, and these test images had comparable image quality to the PCD reference images. The results demonstrated that a DCS with the minimum effective mAs was sufficient to maintain satisfactory image uniformity for PCD scans of different body regions.
Figure 9.
Reconstruction results of the anthropomorphic torso phantom. All PCD images were obtained using the macro mode with an energy range of [25, 140] keV. A: Shoulder. B: Thorax. C: Abdomen. Display: W/L = 300/40 HU. Left to right: baseline PCD images, test PCD images using DCS with the minimum effective mAs, reference images, and EID images from complete projection data. Truncation artifacts were evident in the baseline images. The test and reference images presented comparable image quality, and both were free of truncation artifacts. Truncation artifacts are indicated by arrows.
Discussions
In general, truncation artifacts usually appear as cupping artifacts. The capping and gradient artifacts in the baseline images of the CIRS phantoms and the anthropomorphic phantom were due to the default but non-ideal extrapolation-based truncation-correction method activated for PCD image reconstructions when there was no DCS available. The DCS method, however, was highly robust to the different amounts of transverse data truncation as well as the different internal morphology of the imaged objects, which is a strong advantage compared to the extrapolation-based truncation-correction method, as expected.
We have demonstrated that a DCS has negligible impact on noise magnitude in the resultant PCD images, and that a DCS using the minimum available dose is sufficient to avoid truncation artifacts. Further increasing the effective mAs of a DCS did not improve the image quality of the resultant PCD images. These observations are consistent with the theoretical expectations described in the Introduction.
Our observations about the DCS method are not limited to the evaluated research PCCT system. Rather, they provide a valuable reference for VOI imaging methods that involve an additional scan for estimation of missing sinogram. For example, the DCS method is directly applicable to dual-energy VOI imaging on all dual-source CT scanners. Another practical application of the DCS method is dual-energy VOI imaging using a single-source CT scanner with a sequential scanning technique [22]. Though the sequential scanning technique for dual-energy imaging has been around for a long time and newer alternatives exist, it is still in use [23, 24]. By incorporating the DCS method in the sequential scanning technique, one of the two scans can be performed with a reduced SFOV and substantial dose reduction can be achieved. Besides CT imaging, the DCS method also can be used for 3D imaging with a C-arm system. Indeed, a VOI C-arm CT imaging method similar to the DCS method has been reported by Kolditz et al. [25]. That method combines a full low-dose overview scan and a local high-dose scan to achieve C-arm CT VOI imaging with substantially reduced dose.
There are some limitations to this work. The lowest tube current on the PCD subsystem is currently set to 10 mA, which limited how low of an effective mAs we could achieve. It is possible that a DCS with effective mAs (and hence dose) lower than those used in this work may be sufficient to maintain clinical image quality of the PCD images. Evaluation of this would require modification of the system, particularly the x-ray generator. Alternatively, a very low tube potential and a very high pitch value could be used to obtain lower CTDIvol values than presented here. These possibilities will be considered in our future work.
Conclusion
A DCS using a very low dose (CTDIvol < 2 mGy) had negligible effect on image noise and was sufficient to maintain satisfactory uniformity in PCD images of objects that extended beyond the SFOV of the PCD subsystem.
Acknowledgments
Sources of Funding: The project described was supported by Grant numbers R01 EB016966 and C06 RR018898 from the National Institute of Health, in collaboration with Siemens Healthcare. The content is solely the responsibility of the authors and does not necessarily represent the official views of the National Institute of Health. The equipment and concepts described in this work are based on a research prototype and are not commercially available. Dr. Cynthia H. McCollough receives industry grant support from Siemens Healthcare. Dr. Ahmed F. Halaweish and Dr. Steffen Kappler are employees of Siemens Healthcare.
Footnotes
Conflicts of Interest: No other authors have a conflict of interest.
References
- 1.Taguchi K, Iwanczyk JS. Vision 20/20: Single photon counting x-ray detectors in medical imaging. Medical physics. 2013;40(10):100901. doi: 10.1118/1.4820371. [DOI] [PMC free article] [PubMed] [Google Scholar]
- 2.Awadalla S. Solid-State Radiation Detectors: Technology and Applications. Vol. 41. CRC Press; 2015. [Google Scholar]
- 3.Behling R. Modern Diagnostic X-Ray Sources: Technology, Manufacturing, Reliability. CRC Press; 2015. [Google Scholar]
- 4.Iwanczyk JS. Radiation Detectors for Medical Imaging. Vol. 45. CRC Press; 2015. [Google Scholar]
- 5.Gutjahr R, et al. Human imaging with photon-counting-based CT at clinical dose levels: Contrast-to-noise ratio and cadaver studies. Investigative Radiology. 2016 doi: 10.1097/RLI.0000000000000251. in press. [DOI] [PMC free article] [PubMed] [Google Scholar]
- 6.Atak H, Shikhaliev PM. Dual energy CT with photon counting and dual source systems: comparative evaluation. Physics in medicine and biology. 2015;60(23):8949. doi: 10.1088/0031-9155/60/23/8949. [DOI] [PubMed] [Google Scholar]
- 7.Faby S, et al. Performance of today’s dual energy CT and future multi energy CT in virtual non-contrast imaging and in iodine quantification: A simulation study. Medical physics. 2015;42(7):4349–4366. doi: 10.1118/1.4922654. [DOI] [PubMed] [Google Scholar]
- 8.Yu Z, et al. Evaluation of conventional imaging performance in a research whole-body CT system with a photon-counting detector array. Physics in Medicine and Biology. 2016 doi: 10.1088/0031-9155/61/4/1572. in press. [DOI] [PMC free article] [PubMed] [Google Scholar]
- 9.Kappler S, et al. Photon counting CT at elevated X-ray tube currents: contrast stability, image noise and multi-energy performance. SPIE Medical Imaging; 2014; International Society for Optics and Photonics; San Diego, CA. pp. 90331C–90331C-8. [Google Scholar]
- 10.Yu Z, et al. Initial results from a prototype whole-body photon-counting computed tomography system. SPIE Medical Imaging; 2015; International Society for Optics and Photonics; Orlando, FL. pp. 94120W–94120W-7. (PubMed version: http://www.ncbi.nlm.nih.gov/pmc/articles/PMC4470574/) [DOI] [PMC free article] [PubMed] [Google Scholar]
- 11.Kappler S, et al. SPIE Medical Imaging. International Society for Optics and Photonics; 2010. A research prototype system for quantum-counting clinical CT. [Google Scholar]
- 12.Kappler S, et al. SPIE Medical Imaging. International Society for Optics and Photonics; 2012. First results from a hybrid prototype CT scanner for exploring benefits of quantum-counting in clinical CT. [Google Scholar]
- 13.Kappler S, et al. SPIE Medical Imaging. International Society for Optics and Photonics; 2013. Multi-energy performance of a research prototype CT scanner with small-pixel counting detector. [Google Scholar]
- 14.Stierstorfer K, et al. Weighted FBP—a simple approximate 3D FBP algorithm for multislice spiral CT with good dose usage for arbitrary pitch. Physics in Medicine and Biology. 2004;49(11):2209. doi: 10.1088/0031-9155/49/11/007. [DOI] [PubMed] [Google Scholar]
- 15.Kak AC, Slaney M. Principles of computerized tomographic imaging. Society for Industrial and Applied Mathematics; 2001. [Google Scholar]
- 16.Wunderlich A, Noo F. Image covariance and lesion detectability in direct fan-beam x-ray computed tomography. Physics in medicine and biology. 2008;53(10):2471. doi: 10.1088/0031-9155/53/10/002. [DOI] [PMC free article] [PubMed] [Google Scholar]
- 17.Ohnesorge B, et al. Efficient correction for CT image artifacts caused by objects extending outside the scan field of view. Medical physics. 2000;27(1):39–46. doi: 10.1118/1.598855. [DOI] [PubMed] [Google Scholar]
- 18.Hsieh J, et al. A novel reconstruction algorithm to extend the CT scan field-of-view. Medical physics. 2004;31(9):2385–2391. doi: 10.1118/1.1776673. [DOI] [PubMed] [Google Scholar]
- 19.van Gompel G. Towards accurate image reconstruction from truncated X-ray CT projections. Universiteit Antwerpen, Faculteit Wetenschappen, Departement Fysica; 2009. [Google Scholar]
- 20.Dennerlein F, Maier A. Approximate truncation robust computed tomography—ATRACT. Physics in Medicine and Biology. 2013;58(17):6133. doi: 10.1088/0031-9155/58/17/6133. [DOI] [PubMed] [Google Scholar]
- 21.Scholz B. Method for correcting truncation artifacts in a reconstruction method for computer tomography recordings. Siemens Aktiengesellschaft; USA: 2010. [Google Scholar]
- 22.Millner MR, et al. Extraction of information from CT scans at different energies. Medical physics. 1979;6(1):70–71. doi: 10.1118/1.594555. [DOI] [PubMed] [Google Scholar]
- 23.Ruíz DSM, Murphy K, Gailloud P. 320-Multidetector row whole-head dynamic subtracted CT angiography and whole-brain CT perfusion before and after carotid artery stenting: technical note. European journal of radiology. 2010;74(3):413–419. doi: 10.1016/j.ejrad.2009.03.015. [DOI] [PubMed] [Google Scholar]
- 24.Luo Z, et al. Comparison of the accuracy of subtraction CT angiography performed on 320-detector row volume CT with conventional CT angiography for diagnosis of intracranial aneurysms. European journal of radiology. 2012;81(1):118–122. doi: 10.1016/j.ejrad.2011.05.003. [DOI] [PubMed] [Google Scholar]
- 25.Kolditz D, Kyriakou Y, Kalender WA. Volume-of-interest (VOI) imaging in C-arm flat-detector CT for high image quality at reduced dose. Medical physics. 2010;37(6):2719–2730. doi: 10.1118/1.3427641. [DOI] [PubMed] [Google Scholar]


