

Abstract
Aims
Type 2 diabetes (T2D) is a complex metabolic disease leading to complications in multiple organs. Diabetic myopathy and liver disease are common complications of T2D, but are incompletely understood. To gain insight into the pathogenesis of these conditions we performed metabolomic analysis of skeletal muscle and liver in a mouse model of T2D.
Methods
Tissue metabolomics were performed by GC/MS and LC/MS of the skeletal muscle and liver in the MKR mouse model of T2D, compared with control mice. MKR mice were treated with the β-3 adrenergic receptor agonist, CL-316,243 to determine metabolite changes after correcting hyperglycemia.
Results
Blood glucose was higher in MKR vs WT mice, and normalized with CL-316,243 treatment. Compared with WT mice, MKR mice had 2.5 fold higher concentrations of sorbitol and 1.7 fold lower concentrations of reduced glutathione in skeletal muscle. In liver, MKR mice had 2 fold higher concentrations of the pentitol ribitol. CL-316,243 treatment normalized sorbitol and ribitol concentrations in MKR skeletal muscle and liver, respectively to the levels of the WT mice.
Conclusions
These results demonstrate tissue-specific accumulation of polyols in a mouse model of T2D and provide novel insights into the pathogenesis of myopathy and liver disease in T2D.
Keywords: Type 2 diabetes, polyol pathway, metabolomics, diabetic myopathy, non-alcoholic fatty liver disease
Introduction
Type 2 diabetes (T2D) and its complications cause significant morbidity and premature mortality in patients, and major economic costs to the healthcare system. The molecular mechanisms that underlie T2D and many of its complications are incompletely understood. Therefore, developing a greater understanding of T2D and its complications would greatly benefit individual patients and the healthcare system. Metabolomic studies in humans with diabetes have largely focused on plasma and urine metabolites [1–3]. These studies have aimed to identify biomarkers of the disease or its complications, and have revealed novel changes in metabolites in those with diabetes [2, 1]. However, as plasma metabolite levels frequently do not reflect concentrations in specific tissues [4], it is difficult to know how the circulating metabolite profile reflects the changes in tissues that may contribute to the pathogenesis or complications of diabetes.
Both type 1 (T1D) and T2D negatively impact skeletal muscle health and may lead to diabetic myopathy, characterized by reduced physical capacity, strength and muscle mass. Murine models of T1D and T2D, display skeletal muscle dysfunction, impaired muscle growth, development and regeneration, reduced muscle mass and myofiber size and mitochondrial content, and metabolic inflexibility [6–8]. The decrease in regeneration is associated with decreased stem cell proliferation and/or migration into the damaged muscle regions [6]. Diabetic myopathy correlates with the other complications of diabetes, however the mechanisms underlying diabetic myopathy are incompletely understood [9].
Individuals with T2D also have high rates of liver disease, which includes non-alcoholic fatty liver disease (NAFLD), hepatic cirrhosis and carcinoma [10]. Diabetes is a major contributor to end stage liver disease [11]. Developing a greater insight into the metabolite changes that occur in diabetic liver disease will advance the understanding of the development of liver disease in T2D. Additionally, a major challenge to the diagnosis of NAFLD is to identify non-invasive tests that may diagnose the disease prior to the development of advanced fibrosis or cirrhosis, to allow for timely monitoring and therapeutic intervention to prevent or treat progressive fibrosis, cirrhosis and cancer.
The aim of our present study was to perform metabolomic analysis of skeletal muscle and liver tissues in a mouse model of T2D, to identify novel tissue specific metabolite changes that occur in the setting of T2D, which may contribute to diabetic myopathy and liver disease. In addition, we treated the mice with a β3-adrenergic receptor agonist, CL-316,243, that we have previously found to normalize the hyperglycemia in the diabetic mice in order to determine if the treatment of T2D would normalize the identified metabolite changes. We used a well-characterized mouse model of T2D, the MKR mouse [12]. Here, we discovered tissue specific differences in polyols in the MKR mice compared with wild-type (WT) mice, that were reversed upon treatment with CL-316,243, and provide novel insights into the pathogenesis of diabetic myopathy, and liver disease in T2D. The changes we have identified in skeletal muscle of our rodent model are consistent with limited cadaveric human studies that have previously been performed [17] and suggest that aldose reductase inhibitors may provide clinical benefit to individuals with diabetic myopathy. The identification of a specific polyol, ribitol, in the liver of the diabetic mice may provide a novel marker of hepatic disease in those with diabetes, or provide new insight into the mechanisms of hepatic dysfunction in T2D.
Materials and Methods
Animal care and treatment
Animal studies were approved by the Icahn School of Medicine at Mount Sinai School of Institutional Animal Care and Use Committee (IACUC). Mice were housed in Icahn School of Medicine at Mount Sinai Center for Comparative Medicine and Surgery, Association for Assessment and Accreditation of Laboratory Animal care International (AALAC) and Office of Laboratory Animal Welfare (OLAW) accredited facility, where animal care and maintenance were provided. Mice were kept on a 12 hour light/dark cycle, had free access to diet (Picolab Rodent Diet 20, 5053) and fresh water. All MKR and WT mice used in these studies were male, on the Friend virus B / National Institutes of Health (FVB/N) background and were 10–16 weeks of age. The generation and characterization of MKR mice, including their skeletal muscle and hepatic phenotype has been previously described [12]. Male MKR mice have many other abnormalities associated with T2D, including hepatic steatosis and skeletal muscle dysfunction [12, 8]. Skeletal muscle changes include a decreased cross-sectional area, the accumulation of myocellular lipids, decreased response to exercise training and impaired skeletal muscle regeneration after injury when compared with control mice [14, 15, 8, 16]. Non-fasted mice were euthanized at the end of each experiment. Liver and quadriceps (skeletal muscle) were collected and flash frozen in liquid nitrogen for subsequent metabolomic experiments.
Nine to ten week old male WT and MKR mice were injected intraperitoneally with CL-316,243 (1 mg/kg BW/day) or with an equivalent volume vehicle (sterile phosphate buffered saline) for three weeks. Body weight was measured before treatment and weekly during treatment. Body composition analysis was performed using the EchoMRI 3-in-1 NMR system (Echo Medical Systems, Houston, TX, USA) before treatment, and at the end of treatment. Non-fasting blood glucose measurements were performed on tail vein whole blood using a Bayer Contour Glucometer (Bayer Healthcare, Mishawaka, IN, USA), prior to commencing treatment and weekly thereafter. Serum or plasma collected from the retro-orbital sinus were used to measure circulating insulin (Mercodia, Uppsala, Sweden) and triglycerides (TG) (Pointe Scientific, Canton, MI).
Metabolomic Study
Five biological replicates from MKR vehicle treated, WT vehicle treated, and CL-316,243 treated MKR mice from skeletal muscle and liver tissues were shipped overnight on dry ice to Metabolon (Durham, NC, USA). At the time of analysis samples were extracted and prepared for analysis using Metabolon’s standard solvent extraction method. The extracted samples were split into equal parts for analysis on the gas chromatography / mass spectrometry (GC/MS) and liquid chromatography / mass spectrometry (LC/MS) platforms. Also included were several technical replicate samples created from a homogeneous pool containing a small amount of all study samples (“Client Matrix”). The sample preparation process was carried out using the automated MicroLab STAR® system from Hamilton Company. Recovery standards were added prior to the first step in the extraction process for quality control (QC) purposes. Sample preparation was conducted using a proprietary series of organic and aqueous extractions to remove the protein fraction while allowing maximum recovery of small molecules. The resulting extract was divided into two fractions; one for analysis by LC and one for analysis by GC. Samples were placed briefly on a TurboVap® (Zymark, Hopkinton, MA) to remove the organic solvent. Each sample was then frozen and dried under vacuum. Samples were then prepared for the appropriate instrument, either LC/MS or GC/MS. For quality assurance (QA)/QC purposes, a number of additional samples were included with each day’s analysis. Furthermore, a selection of QC compounds was added to every sample, including those under test. These compounds were carefully chosen so as not to interfere with the measurement of the endogenous compounds. The LC/MS portion of the platform was based on a Waters ACQUITY UPLC and a Thermo-Finnigan LTQ mass spectrometer, which consisted of an electrospray ionization (ESI) source and linear ion-trap (LIT) mass analyzer. The sample extract was split into two aliquots, dried, then reconstituted in acidic or basic LC-compatible solvents, each of which contained 11 or more injection standards at fixed concentrations. One aliquot was analyzed using acidic positive ion optimized conditions and the other using basic negative ion optimized conditions in two independent injections using separate dedicated columns. Extracts reconstituted in acidic conditions were gradient eluted using water and methanol both containing 0.1% Formic acid, while the basic extracts, which also used water/methanol, contained 6.5mM Ammonium Bicarbonate. The MS analysis alternated between MS and data-dependent MS2 scans using dynamic exclusion. The samples destined for GC/MS analysis were re-dried under vacuum desiccation for a minimum of 24 hours prior to being derivatized under dried nitrogen using bistrimethyl-silyl-triflouroacetamide (BSTFA). The GC column was 5% phenyl and the temperature ramp is from 40° to 300° C in a 16 minute period. Samples were analyzed on a Thermo-Finnigan Trace DSQ fast-scanning single-quadrupole mass spectrometer using electron impact ionization. The instrument was tuned and calibrated for mass resolution and mass accuracy on a daily basis. The information output from the raw data files was automatically extracted as discussed below.
Compounds were identified by comparison to library entries of purified standards or recurrent unknown entities. Identification of known chemical entities was based on comparison to metabolomic library entries of purified standards. As of this writing, more than 1000 commercially available purified standard compounds had been acquired registered into LIMS for distribution to both the LC and GC platforms for determination of their analytical characteristics.
The combination of chromatographic properties and mass spectra gave an indication of a match to the specific compound or an isobaric entity. Additional entities could be identified by virtue of their recurrent nature (both chromatographic and mass spectral). These compounds have the potential to be identified by future acquisition of a matching purified standard or by classical structural analysis.
Statistical Analysis
Blood glucose, insulin, TG, and MRI measurements were compared between groups by One Way ANOVA and Tukey’s HSD post hoc test using IBM SPSS Statistics. Metabolomic samples were analyzed using Welch’s two-sample t-tests. A P value of <0.05 was considered as a statistically significant difference between the groups.
Results
Differences in glucose-related metabolites in skeletal muscle and liver of MKR and WT mice before and after CL-316,243 treatment
At the time of dissection, non-fasting mean blood glucose was 17.3 (±2.1) mmol/L in non-treated MKR mice compared with 8.2 (±0.45) mmol/L in WT mice (p<0.01). After treatment of the MKR mice with CL-316,243 for 3 weeks, non-fasting glucose was 6.2(±2.4) mmol/L levels were significantly lower than the MKR untreated glucose levels (p<0.01), and similar to the WT mean glucose mice (p = 0.61). Treatment with CL-316,243 led to a significant decrease in the fat / lean ratio in the MKR mice (Figure 1A), with significant reductions in gonadal and retroperitoneal fat depots (Figure 1B). No significant differences were observed between quadriceps or tibialis muscle weight, or liver weight between the MKR vehicle and CL-316,243-treated mice. Plasma insulin, and serum TG were significantly higher in the MKR vehicle-treated mice, compared to WT mice (p<0.01, p<0.02, respectively), and were significantly lower in the MKR CL-316,243 treated mice, compared to the MKR vehicle treated mice (p<0.01) (Figure 1C, D).
Figure 1. CL-316,243 treatment reduced fat mass and reduced circulating insulin and triglyceride concentrations in MKR mice.

Body composition was measured in wild-type (WT) and MKR mice treated with vehicle (V) or CL-316,243 (CL) before treatment began, and after 3 weeks of treatment with CL-316,243 (A). & indicates p<0.05 between groups, as indicated. Organs (Quad = Quadriceps, S. fat = Subcutaneous fat, G. fat = gonadal fat, RP fat = retroperitoneal fat) weights at the end of the study (B). Plasma insulin concentrations (C), and serum triglyceride concentrations (D) after 3 weeks of treatment. All graphs represent the mean of each group, error bars are SEM. * indicates statistically significant different between WT V and MKR V groups, # indicates statistically significant difference between MKR V and MKR CL groups.
Consistent with the blood glucose changes, differences were observed in glucose related metabolites in skeletal muscle (Table 1) and liver (Table 2). 1,5-anhydroglucitol was lower in both liver and skeletal muscle in the MKR mice compared with WT mice, and normalized to WT levels in the MKR mice treated with CL-316,243. 1,5-anhydroglucitol (also known as 1,5-anhydrosorbitol) competes with glucose for reabsorption in the renal tubules [18]. Plasma concentrations of 1,5-anhydroglucitol are lower in patients with uncontrolled diabetes compared to healthy controls [18]. Significantly lower levels of methyl-β-glucopyranoside were found in both liver and muscle of the MKR mice, and decreased to levels similar to the WT mice in the CL-316,243 treated MKR mice. Methyl-β-glucopyranoside is a glucose-derived acetal. The observed decrease in tissue levels may be due to renal losses of methyl-β-glucopyranoside, which is also reabsorbed by the sodium-glucose transporters in the renal tubules [19].
Table 1.
Glucose metabolites in skeletal muscle
| Skeletal Muscle | MKR V / WT V |
P Value | MKR CL / MKR V |
P Value | MKR CL / WT V |
P Value |
|---|---|---|---|---|---|---|
| Glucose Metabolism | ||||||
| 1,5-anhydroglucitol (1,5-AG) |
−8.33 | 0.002 | 8.94 | 0.001 | 1.10 | 0.62 |
| Methyl-beta- glucopyranoside |
−7.69 | 0.000 | 9.49 | 0.000 | 1.22 | 0.258 |
| Glucose | 1.34 | 0.051 | −1.28 | 0.049 | 1.05 | 0.608 |
| Glycolysis | ||||||
| Glucose-6-phosphate (G6P) |
21.88 | 0.243 | 1.02 | 0.903 | 22.41 | 0.240 |
| Glucose 1-phosphate | 4.49 | 0.418 | 1.11 | 0.609 | 4.98 | 0.129 |
| Fructose-6-phosphate | 14.23 | 0.348 | −1.12 | 0.923 | 12.68 | 0.315 |
| Isobar: Fructose 1,6- diphosphate, Glucose 1,6-diphosphate, Myo- inositol 1,4 or 1,3- diphosphate |
4.26 | 0.052 | 1.79 | 0.537 | 7.65 | 0.038 |
| 2-phosphoglycerate | 1.93 | 0.129 | 1.46 | 0.346 | 2.81 | 0.026 |
| 3-phosphoglycerate | 1.86 | 0.154 | 1.45 | 0.295 | 2.70 | 0.023 |
| Phosphoenolpyruvate (PEP) |
1.58 | 0.279 | 1.64 | 0.156 | 2.59 | 0.010 |
| Pyruvate | 1.12 | 0.468 | 1.25 | 0.423 | 1.41 | 0.207 |
| Lactate | −1.14 | 0.413 | −1.01 | 0.894 | −1.15 | 0.409 |
| TCA Cycle | ||||||
| Citrate | −1.85 | 0.275 | 2.12 | 0.108 | 1.15 | 0.642 |
| Succinate | −1.02 | 0.950 | 1.16 | 0.225 | 1.14 | 0.310 |
| Fumarate | 1.44 | 0.206 | 1.08 | 0.771 | 1.55 | 0.124 |
| Malate | 1.81 | 0.005 | 1.04 | 0.745 | 1.89 | 0.002 |
| Acetyl CoA | −1.43 | 0.160 | 2.23 | 0.024 | 1.58 | 0.029 |
| Nicotinamide adenine dinucleotide (NAD+) |
−7.69 | 0.002 | 1.20 | 0.637 | −6.67 | 0.003 |
| Flavin adenine dinucleotide (FAD) |
1.28 | 0.206 | 1.57 | 0.052 | 2.01 | 0.007 |
| Pentose Phosphate Pathway | ||||||
| Ribose 5-phosphate | 1.73 | 0.049 | −1.39 | 0.188 | 1.25 | 0.626 |
| Sedoheptulose-7- phosphate |
−1.56 | 0.590 | 4.06 | 0.082 | 2.61 | 0.212 |
| Ribulose/xylulose 5- phosphate |
1.40 | 0.239 | −1.75 | 0.070 | −1.25 | 0.685 |
WT V = WT vehicle treated mice, MKR V = MKR vehicle treated mice, MKR CL = MKR CL-316,243 treated mice.
Bolded font highlights metabolites with statistically significant differences (P value <0.05). n=5 per group.
Table 2.
Glucose metabolites in liver
| Liver | MKR V / WT V |
P Value | MKR CL / MKR V |
P Value | MKR CL / WT V |
P Value |
|---|---|---|---|---|---|---|
| Glucose Metabolism | ||||||
| 1,5-anhydroglucitol (1,5-AG) |
−2.00 | 0.049 | 2.87 | 0.001 | 1.44 | 0.135 |
| Methyl-beta- glucopyranoside |
−3.45 | 0.000 | 4.04 | 0.001 | 1.16 | 0.644 |
| Glucose | 1.21 | 0.305 | −1.39 | 0.039 | −1.15 | 0.704 |
| Glycolysis | ||||||
| Glucose-6- phosphate (G6P) |
−2.08 | 0.392 | 1.07 | 0.567 | −1.96 | 0.529 |
| Fructose-6- phosphate |
−1.45 | 0.327 | 1.14 | 0.226 | −1.27 | 0.626 |
| Isobar: Fructose 1,6-diphosphate, Glucose 1,6- diphosphate, Myo- inositol 1,4 or 1,3- diphosphate |
−1.23 | 0.045 | 1.23 | 0.065 | −1.01 | 0.934 |
| 3-phosphoglycerate | −1.32 | 0.312 | 1.88 | 0.042 | 1.43 | 0.118 |
| Pyruvate | −1.08 | 0.976 | −1.30 | 0.438 | −1.39 | 0.499 |
| Lactate | 1.15 | 0.400 | −1.05 | 0.692 | 1.09 | 0.553 |
| TCA Cycle | ||||||
| Citrate | −1.39 | 0.656 | 1.40 | 0.291 | 0.00 | 0.796 |
| Succinylcarnitine | −1.28 | 0.374 | 2.14 | 0.001 | 1.66 | 0.046 |
| Succinate | −1.06 | 0.803 | 1.26 | 0.295 | 1.18 | 0.448 |
| Fumarate | −1.08 | 0.948 | 1.35 | 0.152 | 1.25 | 0.341 |
| Malate | −1.01 | 0.747 | 1.41 | 0.071 | 1.40 | 0.176 |
| Nicotinamide adenine dinucleotide (NAD+) |
−1.08 | 0.937 | 1.58 | 0.027 | 1.47 | 0.121 |
| Flavin adenine dinucleotide (FAD) |
−1.05 | 0.858 | 1.24 | 0.064 | 1.17 | 0.299 |
| Pentose Phosphate Pathway / Pentose Metabolism | ||||||
| 6- phosphogluconate |
−1.49 | 0.110 | −1.47 | 0.253 | −2.22 | 0.005 |
| Ribose 5-phosphate | −1.56 | 0.139 | 1.23 | 0.637 | −1.27 | 0.369 |
| Sedoheptulose-7- phosphate |
−1.25 | 0.621 | 1.33 | 0.165 | 1.07 | 0.581 |
| Ribulose/xylulose 5-phosphate |
−1.32 | 0.337 | 1.25 | 0.305 | −1.05 | 0.913 |
| Ribulose | 1.83 | 0.086 | −1.45 | 0.102 | 1.27 | 0.380 |
| Ribose | 1.60 | 0.146 | −1.49 | 0.094 | 1.07 | 0.614 |
| Glycogen Metabolism | ||||||
| Maltohexaose | −1.45 | 0.343 | −50.00 | 0.025 | −50.00 | 0.000 |
| Maltopentaose | −1.28 | 0.352 | −50.00 | 0.021 | −100.00 | 0.000 |
| Maltotetraose | −1.23 | 0.427 | −14.29 | 0.002 | −16.67 | 0.000 |
| Maltotriose | 1.01 | 0.979 | −7.69 | 0.001 | −7.69 | 0.001 |
| Maltose | 1.14 | 0.583 | −2.56 | 0.008 | −2.27 | 0.035 |
WT V = WT vehicle treated mice, MKR V = MKR vehicle treated mice, MKR CL = MKR CL-316,243 treated mice.
Bolded font highlights metabolites with statistically significant differences (P value <0.05). n=5 per group.
In skeletal muscle of MKR mice, there was a trend to higher concentrations of early glycolytic intermediates, notably in glucose 6-phosphate, fructose 6-phosphate and fructose 1,6 disphosphate (isobar: fructose 1,6-diphosphate, glucose 1,6-diphosphate, myo-inositol 1,4 or 1,3-diphosphate). These results are consistent with our previous findings of increased glucose uptake into the skeletal muscle of MKR mice [8, 20]. There were no changes in the late glycolysis or TCA cycle intermediates, except for malate that was elevated in the skeletal muscle of MKR mice. An increase in the pentose phosphate pathway intermediate, ribose 5-phosphate, was found in the skeletal muscle of the MKR mice. Treatment with CL-316,243 led to higher levels of glycolytic intermediates, and a reduction in ribose 5-phosphate. Malate remained elevated in the skeletal muscle of MKR mice treated with CL-316,243. Skeletal muscle concentrations of acetyl CoA were higher in the CL-316,243 treated MKR mice, compared with untreated MKR mice.
In the liver, the CL-316,243 treated MKR mice had dramatically lower levels of glycogen metabolism intermediates (Table 2). We have previously shown that MKR mice treated with CL-316,243 have a significant increase in glycogen synthesis over vehicle treated MKR mice [8]. A lower concentration of fructose 1,6 disphosphate was found in MKR mice compared with WT mice that normalized to WT levels in CL-316,243 treated MKR mice. An increase in 3-phosphoglycerate was found in the liver of the CL-316,243-treated MKR mice compared with the WT mice. TCA cycle intermediates were not significantly different between the liver of MKR and WT mice, however higher levels of some TCA cycle intermediates were found in the liver of MKR mice after CL-316,243 treatment, including of succinylcarnitine and malate.
Accumulation of sorbitol and oxidative stress markers in the muscle of the MKR mice
The polyol pathway and oxidative stress are known to contribute to the development of microvascular complications in diabetes [21]. Oxidative stress has also been hypothesized to contribute the diabetic myopathy [9]. The classical polyol pathway described in diabetes is shown in Figure 2. A significant accumulation of the polyol sorbitol was found in the skeletal muscle of the MKR mice, that was lowered after treatment with CL-316,243 (Table 3). The formation of sorbitol from glucose by the enzyme aldose reductase leads to consumption of NADPH, which lowers the levels of the antioxidant reduced glutathione (GSH) [21]. In the skeletal muscle of the MKR mice, a decrease in the concentration of GSH was found, with an increase in the level of cysteine-glutathione disulfide (Table 3), which can lead to the formation of reactive oxygen species. [21, 22] Treatment with CL-316,243 led to increased levels of GSH and normalization of cysteine glutathione disulphide in skeletal muscle. There were no differences in levels of oxidized glutathione (GSSG) between the groups. The second step of the polyol pathway involves the conversion of sorbitol to fructose (Figure 2) with the consumption of NAD+. A non-significant increase in fructose was also found in the MKR mice compared with WT mice, and treatment with CL-316,243 led to a non-significant reduction in skeletal muscle fructose in the MKR mice (Table 3). NAD+ levels were significantly reduced in the skeletal muscle of the MKR mice, compared to WT mice (Table 1), however no change was found after CL-316,243 treatment. Taurine, an antioxidant, was lower in the skeletal muscle of MKR mice, and was unchanged after CL-316,243 treatment. Overall these results are consistent with increased flux of glucose through the polyol pathway, and oxidative stress in skeletal muscle in this mouse model of T2D.
Figure 2. The potential pathways through which glucose may be metabolized in skeletal muscle in the setting of hyperglycemia.
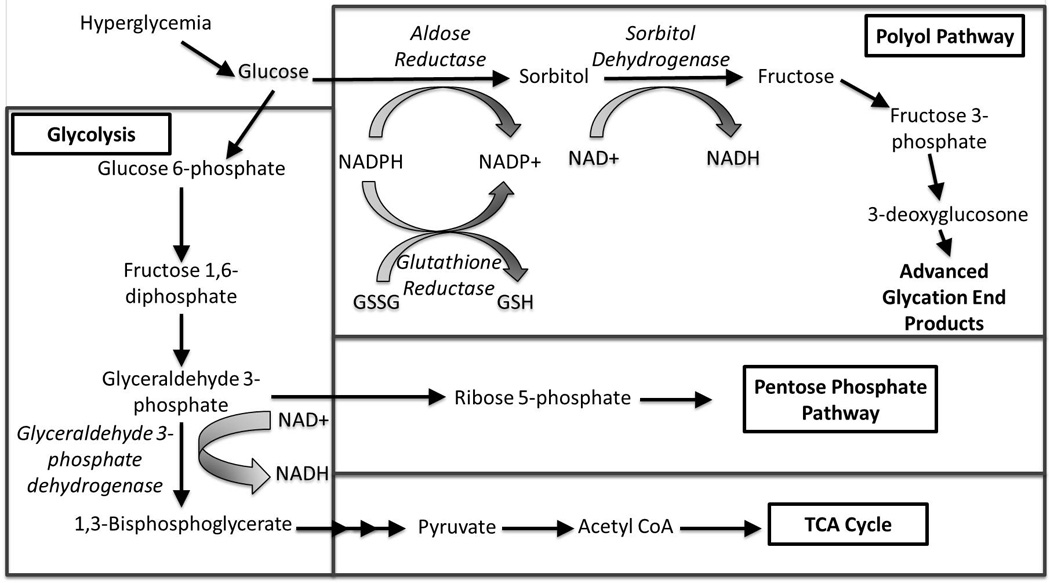
Schematic with key elements of the polyol pathway and interaction with glycolysis, the pentose phosphate pathway and TCA cycle. The polyol pathway consists of two steps: (1) The conversion of glucose to sorbitol by the enzyme aldose reductase, consuming NADPH. (2) The conversion of sorbitol to fructose by the enzyme sorbitol dehydrogenase, consuming NAD+. The consumption of NADPH by the first reaction leads to decreased amounts of the antioxidant reduced glutathione (GSH), contributing to oxidative stress. Fructose can be further metabolized to fructose-3-phosphate and 3-deoxyglucosone and the formation of advanced glycation end products (AGEs). NAD+ is a cofactor for the conversion of glyceraldehyde 3-phosphate to 1,3-bisphosphoglycerate by the enzyme glyceraldehyde 3-phosphate dehydrogenase. Depletion of NAD+, leads to increased flux into the pentose phosphate pathway. Multiple arrows indicate multiple steps in a pathway. GSSG: Oxidized glutathione. TCA Cycle: Tricarboxylic acid cycle. Enzyme names are italicized. Adapted from references [40–42].
Table 3.
Polyol pathway and oxidative stress in liver and skeletal muscle
| Liver | MKR V / WT V |
P Value | MKR CL / MKR V |
P Value | MKR CL / WT V |
P Value |
|---|---|---|---|---|---|---|
| Polyol Pathway | ||||||
| Fructose | 1.35 | 0.565 | −3.45 | 0.028 | −2.56 | 0.043 |
| Sorbitol | 1.60 | 0.106 | −1.54 | 0.109 | 1.04 | 0.757 |
| Mannitol | 1.27 | 0.377 | 1.30 | 0.337 | 1.64 | 0.085 |
| Ribitol | 1.95 | 0.042 | −1.64 | 0.006 | 1.18 | 0.347 |
| Xylitol | −1.09 | 0.934 | 1.48 | 0.280 | 1.37 | 0.364 |
| Myo-inositol | 1.03 | 0.673 | 1.18 | 0.303 | 1.22 | 0.326 |
| Erythritol | 1.21 | 0.394 | −1.15 | 0.494 | 1.06 | 0.979 |
| Oxidative Stress | ||||||
| Glutathione, reduced (GSH) |
−1.03 | 0.956 | −1.03 | 0.678 | −1.06 | 0.676 |
| Glutathione, oxidized (GSSG) |
−1.01 | 0.955 | 1.10 | 0.152 | 1.09 | 0.423 |
| Cysteine- glutathione disulfide |
1.25 | 0.720 | 2.44 | 0.032 | 3.06 | 0.003 |
| Taurine | −1.03 | 0.611 | 1.01 | 0.859 | −1.02 | 0.681 |
|
Skeletal Muscle Polyol Pathway | ||||||
| Fructose | 1.59 | 0.161 | −1.27 | 0.463 | 1.26 | 0.301 |
| Sorbitol | 2.52 | 0.014 | −1.89 | 0.047 | 1.34 | 0.180 |
| Mannitol | −1.11 | 0.738 | 1.16 | 0.458 | 1.05 | 0.777 |
| Galactitol (dulcitol) | −1.69 | 0.031 | 1.09 | 0.686 | −1.54 | 0.075 |
| Ribitol | −1.25 | 0.377 | 0.00 | 0.8045 | −1.25 | 0.3700 |
| Xylitol | 1.16 | 0.447 | 1.01 | 0.8230 | 1.18 | 0.4646 |
| Arabitol | 1.06 | 0.700 | −1.02 | 0.8132 | 1.04 | 0.7322 |
| Myo-inositol | 1.53 | 0.074 | 1.26 | 0.213 | 1.93 | 0.002 |
| Erythritol | 1.18 | 0.316 | −1.27 | 0.872 | −1.08 | 0.198 |
| Oxidative Stress | ||||||
| Glutathione, reduced (GSH) |
−1.72 | 0.011 | 1.64 | 0.014 | −1.05 | 0.736 |
| Glutathione, oxidized (GSSG) |
−1.05 | 0.803 | −1.06 | 0.565 | −1.12 | 0.497 |
| Cysteine- glutathione disulfide |
1.31 | 0.061 | −1.56 | 0.002 | −1.19 | 0.188 |
| S- lactoylglutathione |
−1.04 | 0.934 | 3.04 | 0.026 | 2.91 | 0.031 |
| 5-oxoproline | 1.24 | 0.097 | 1.24 | 0.093 | 1.54 | 0.005 |
| Ophthalmate | 1.24 | 0.239 | 1.47 | 0.053 | 1.82 | 0.027 |
| Taurine | −1.32 | 0.098 | 1.05 | 0.901 | −1.25 | 0.240 |
WT V = WT vehicle treated mice, MKR V = MKR vehicle treated mice, MKR CL = MKR CL-316,243 treated mice.
Bolded font highlights metabolites with statistically significant differences (P value <0.05). n=5 per group.
An increase in the polyol ribitol was found in the liver of the MKR mice and was reduced in CL-316,243 treated mice
A significantly higher level of the polyol ribitol (also known as adonitol) was found in the liver of the MKR mice (Table 3). Ribitol is a C5-polyol (pentitol) that is an end product of metabolism, formed from the reduction of ribose and ribulose [23, 24]. Non-significant increases in ribulose and ribose were found in the liver of the MKR mice (Table 2). No statistically significant differences were found in the hepatic levels of other polyols in the liver of the MKR mice compared with WT mice. CL-316,243 led to statistically significantly lower levels of ribitol and fructose, but had no effect on the concentrations of other polyols (Table 3). No significant differences were found in the concentrations of GSH, GSSG or cysteine glutathione disulfide in the vehicle treated MKR mice compared with WT mice. CL-316,243 treatment of the MKR mice led to significantly higher hepatic concentrations of cysteine glutathione disulfide when compared with levels in vehicle treated MKR mice and WT mice.
Lower levels of short chain acylcarnitines were found in the liver of MKR mice and increased upon treatment with CL-316,243
Changes in the circulating levels of short chain acylcarnitines have been reported to occur with diabetes, and these changes may potentially contribute to insulin resistance, although their role remains controversial [25]. Compared to WT mice, MKR mice had significantly lower levels of acetylcarnitine (C2), propionylcarnitine (C3), and isobutyrylcarnitine (C4) in the liver (Table 4). Following treatment with CL-316,243, increased levels of these short chain acylcarnitines were found in the liver. No differences in concentrations of leucine, isoleucine and valine were found in the liver in any of the groups, however after CL-316,243 treatment, hepatic levels of C22 and C17 fatty acids decreased, with an increase in the C14 fatty acid myristoleate.
Table 4.
Branched chain amino acids, fatty acids and acylcarnitines in liver and skeletal muscle
| Liver | MKR V / WT V |
P Value | MKR CL / MKR V |
P Value | MKR CL / WT V |
P Value |
|---|---|---|---|---|---|---|
| Leucine | 1.07 | 0.566 | −1.05 | 0.625 | 1.02 | 0.826 |
| Isoleucine | 1.03 | 0.665 | −1.02 | 0.747 | 1.01 | 0.793 |
| Valine | 1.10 | 0.486 | −1.01 | 0.829 | 1.09 | 0.600 |
| Carnitine | −1.22 | 0.172 | 1.44 | 0.002 | 1.18 | 0.201 |
| Acetylcarnitine (C2) |
−4.00 | 0.027 | 2.48 | 0.021 | −1.64 | 0.490 |
| Propionylcarnitine (C3) |
−3.23 | 0.001 | 4.66 | 0.000 | 1.44 | 0.157 |
| Isobutyrylcarnitine (C4) |
−2.44 | 0.009 | 1.73 | 0.056 | −1.39 | 0.260 |
| Hydroxybutyrylcar nitine* (C4) |
−1.23 | 0.274 | 1.18 | 0.403 | −1.04 | 0.795 |
| Isovalerylcarnitine (C5) |
−1.11 | 0.893 | 1.97 | 0.024 | 1.78 | 0.073 |
| Myristoleate (14:1n5) |
−1.33 | 0.516 | 3.11 | 0.005 | 2.33 | 0.037 |
| 10-heptadecenoate (17:1n7) |
1.24 | 0.338 | −1.79 | 0.035 | −1.45 | 0.4819 |
| Erucate (22:1n9) | 1.39 | 0.239 | −1.75 | 0.078 | −1.27 | 0.6112 |
| Skeletal Muscle | ||||||
| Leucine | −1.05 | 0.988 | 1.04 | 0.994 | −1.01 | 0.986 |
| Isoleucine | 1.01 | 0.816 | −1.03 | 0.710 | −1.02 | 0.865 |
| Valine | −1.04 | 0.999 | −1.05 | 0.616 | −1.10 | 0.687 |
| Carnitine | 1.40 | 0.011 | 1.36 | 0.069 | 1.90 | 0.002 |
| Acetylcarnitine (C2) |
1.04 | 0.747 | 1.10 | 0.583 | 1.14 | 0.420 |
| Propionylcarnitine (C3) |
1.41 | 0.042 | 1.24 | 0.177 | 1.74 | 0.002 |
| Butyrylcarnitine (C4) |
1.47 | 0.349 | −2.08 | 0.075 | −1.41 | 0.289 |
| Hydroxybutyrylcar nitine (C4-OH) |
2.13 | 0.002 | 1.49 | 0.075 | 3.17 | 0.000 |
| Isobutyrylcarnitine (C4) |
1.52 | 0.101 | 1.45 | 0.359 | 2.20 | 0.048 |
| 2- methylbutyrylcarnit ine (C5) |
1.31 | 0.190 | −1.05 | 0.521 | 1.24 | 0.711 |
| Valerylcarnitine (C5) |
1.40 | 0.214 | −1.04 | 0.821 | 1.35 | 0.353 |
| Isovalerylcarnitine (C5) |
1.74 | 0.067 | 1.01 | 0.588 | 1.77 | 0.300 |
| Beta- hydroxyisovaleroyl carnitine (C5-OH) |
1.09 | 0.460 | 1.40 | 0.116 | 1.53 | 0.058 |
| Tiglyl carnitine (C5:1) |
1.88 | 0.002 | −1.22 | 0.260 | 1.55 | 0.253 |
| Hexanoylcarnitine (C6) |
1.07 | 0.994 | 1.05 | 0.909 | 1.13 | 0.890 |
| Octanoylcarnitine (C8) |
1.19 | 0.819 | −2.08 | 0.101 | −1.72 | 0.046 |
| Acetyl CoA | −1.43 | 0.160 | 2.23 | 0.024 | 1.56 | 0.029 |
| 3-hydroxybutyryl CoA |
1.37 | 0.239 | 1.70 | 0.036 | 2.32 | 0.001 |
| Myristate (14:0) | −1.79 | 0.051 | 2.16 | 0.012 | 1.20 | 0.486 |
| Myristoleate (14:1n5) |
−1.75 | 0.005 | 3.32 | 0.017 | 1.91 | 0.141 |
| Stearate (18:0) | −1.16 | 0.450 | 1.48 | 0.044 | 1.27 | 0.218 |
| 10-nonadecenoate (19:1n9) |
−1.79 | 0.085 | 8.87 | 0.003 | 4.97 | 0.006 |
| Erucate (22:1n9) | −1.49 | 0.336 | 4.24 | 0.014 | 2.83 | 0.053 |
WT V = WT vehicle treated mice, MKR V = MKR vehicle treated mice, MKR CL = MKR CL-316,243 treated mice.
Bolded font highlights metabolites with statistically significant differences (P value <0.05). n=5 per group.
In contrast, in the skeletal muscle a significantly higher level of C3 and C4 acylcarnitines were found in the MKR mice. However, no difference was observed in skeletal muscle acylcarnitine levels between the MKR vehicle and CL-316,243 treated mice. Furthermore, no differences were seen in the levels of valine, isoleucine or leucine in the skeletal muscle of MKR compared to WT mice, although increases in C14, C18, C19 and C22 fatty acids were found (Table 4).
Discussion
The findings in this study reveal novel insights into the tissue specific metabolite changes, specifically in polyols that occur with T2D and may contribute to diabetic myopathy and liver disease. The polyol pathway has been hypothesized to contribute to many complications of diabetes, including retinopathy, neuropathy, nephropathy and vascular disease. In these tissues, glucose is converted to sorbitol by the enzyme aldose reductase, consuming NADPH, followed by oxidation of sorbitol to fructose by sorbitol dehydrogenase (SDH) with NAD+ as a co-factor (Figure 2). The fructose produced can be phosphorylated to fructose-3-phosphate, leading to the production of advanced glycation end products. The polyol pathway induces oxidative stress due to the consumption of NADPH, which is required to regenerate GSH, an important scavenger of reactive oxygen species (ROS). The use of NAD+ by SDH causes an increase in the NADH/NAD+ ratio, inhibiting the activity of the enzyme glyceraldehyde 3-phosphate dehydrogenase (GAPDH) increasing glyceraldehyde 3-phosphate concentration (Figure 2). Decreased GAPDH activity, leads to a reduction of flux through glycolysis and increased flux through the pentose phosphate pathway. Our current study suggests that in skeletal muscle, the polyol pathway, with increased sorbitol production, and increased oxidative stress likely contribute to the skeletal muscle abnormalities in the MKR model of T2D [26, 14, 20]. We hypothesize that normalizing the blood glucose led to the reduction of polyol levels in the MKR mice. The role of sorbitol accumulation in skeletal muscle dysfunction in T2D has not been widely examined. A previous study in a rodent model of streptozotocin-induced (insulin-deficient) diabetes found that sorbitol accumulation in skeletal muscle was higher in diabetic rats than in the control animals, and was reduced following insulin administration [27]. In other studies using models of insulin deficient diabetes, aldose reductase was increased in the skeletal muscle of diabetic rats, and aldose reductase inhibitors partially improved the skeletal muscle dysfunction [28, 29]. While diabetic myopathy is a well-recognized complication of diabetes, it remains poorly understood and is not specifically treated in a clinical setting [6]. Human skeletal muscle samples obtained from autopsy have been found to express aldose reductase. The investigators found that glucose was a substrate for skeletal muscle aldose reductase, and it catalyzed the conversion of glucose to sorbitol with the consumption of NADPH. Furthermore, aldose reductase in skeletal muscle was inhibited by pharmacological aldose reductase inhibitors [17]. Further studies have not been performed to examine the expression or activity of aldose reductase in the skeletal muscle of individuals with diabetes or diabetic myopathy. Aldose reductase inhibitors are currently being studied in humans for their efficacy in treating diabetic neuropathy, but studies in diabetic myopathy may also be warranted.
In contrast to our findings in skeletal muscle, the pentitol ribitol was significantly elevated in the liver of the MKR mice. Ribitol has been reported to be elevated in the urine of humans with transaldolase and ribose-5-phosphate isomerase (RPI) deficiency, and in cataracts in patients with uncontrolled diabetes [30, 31]. RPI catalyzes the interconversion of ribulose 5-phosphate to ribose 5-phosphate [24], and previous studies have reported that the expression of RPI and activity of transaldolase are altered in the liver in diabetes, but no previous studies have reported hepatic concentrations of ribitol in diabetic patients [32, 33]. A tendency toward increased urinary ribitol levels has previously been reported in individuals with diabetes, although in the published study no details regarding diabetes type, control or liver disease were reported [34]. Furthermore, in a West African population with liver disease, a higher urinary level of ribitol was found in those with hepatocellular carcinoma, compared with those with cirrhosis [35]. As congenital transaldose deficiency is associated with hepatic cirrhosis [30], it is possible that changes in transaldolase or RPI expression, or activity in those with T2D contribute to the accumulation of ribitol. Ribitol is an end product of metabolism and is excreted in the urine; therefore elevated urinary ribitol levels in those with T2D may be a marker of hepatic dysfunction and warrants further investigation. Tissue specific differences in polyol formation may be related to different levels of expression of aldose reductase in different tissues. It has been reported that in human liver aldose reductase levels are low [36].
The role of acylcarnitines in the development of insulin resistance is still being explored. It has been demonstrated that plasma, skeletal muscle and hepatic acylcarnitine levels do not correlate [4]; however, the role of tissue acylcarnitines remains to be determined. The decrease in short chain acylcarnitines in the liver of the MKR mice may reflect a decrease in fatty acid oxidation. Similarly, the increase of carnitine in skeletal muscle may reflect a decrease in carnitine consumption by the muscle, due to decreased fatty acid oxidation. We have previously found a significant decrease in gene expression of multiple enzymes involved in fatty acid beta oxidation in the skeletal muscle of the MKR mice [37].
We compared the results of our study to those of the db/db mouse, ob/ob mouse [38] and to the ob/ob/LDLR double knockout mouse after treatment with rosiglitazone and fenofibrate [39]. While the MKR mice are on an FVB/n background, the db/db, ob/ob and ob/ob/LDLR double knockout mice (ob/ob/LDLR−/−) were on a C57/Bl6 background. Compared with the db/db and ob/ob mice, some similarities were found. Ob/ob mice had higher levels of fructose 1,6 diphosphate and myo-inositol in the skeletal muscle, compared to control mice, consistent with our findings in the MKR mice. In addition decreased GSH levels were found in the skeletal muscle of both ob/ob and db/db mice, similar to the MKR mice. Tissue sorbitol and ribitol levels were not reported in the ob/ob or db/db mice. Some similar results in the hepatic metabolomic profiles of the ob/ob/LDLR−/− mouse treated with rosiglitazone and fenofibrate [39] and those of the CL-316,243 treated MKR mice in our study were found. Specifically, fructose, maltose and glucose were decreased after treatment in both studies. These studies also found a decrease in metabolites of the pentose phosphate pathway after treatment, although in different metabolites to those identified in our current study. No change was observed in branched chain amino acids in our study, while in ob/ob/LDLR−/− mice fenofibrate and rosiglitazone had opposing effects on BCAA concentrations. The authors of the study on the ob/ob/LDLR−/− mice however, did not compare their ob/ob/LDLR−/− mice with the wild type C57/BL6 mice for the metabolomics profiling and therefore, it is possible that the ob/ob/LDLR−/− mice had significant abnormalities in these metabolites at baseline.
Overall, our current study demonstrates tissue specific polyol accumulation in skeletal muscle and liver in a mouse model of T2D. In this study we did perform metabolomics on other tissues that may also be affected by diabetes, but future studies may be useful to understand tissue specific differences in polyol levels. The accumulation of polyols and oxidative stress in skeletal muscle may contribute to diabetic myopathy, a poorly understood complication of diabetes. Additionally, the accumulation of ribitol in the liver is a novel finding and warrants further investigation as a biomarker of hepatic disease in those with T2D. Validation of our findings in human cohorts could provide new insights into the pathophysiology of diabetic myopathy and liver disease, and possible new treatments for these poorly understood complications of T2D, including aldose reductase inhibitors for diabetic myopathy.
Acknowledgments
EJG is the guarantor of this work and, as such, had full access to all the data in the study and takes responsibility for the integrity of the data and the accuracy of the data analysis.
Funding: Funding for the study was provided by the Intramural program of the National Institute of Diabetes and Digestive and Kidney Diseases, National Institutes of Health. EJG received funding from NCI/NIH 1K08CA190770, DLR received funding from ADA 1-13-BS-108, and NCI/NIH 2R01CA128799-06A1. We would like to thank Dr. Amit Kumar for his technical assistance in conducting these studies.
Footnotes
Publisher's Disclaimer: This is a PDF file of an unedited manuscript that has been accepted for publication. As a service to our customers we are providing this early version of the manuscript. The manuscript will undergo copyediting, typesetting, and review of the resulting proof before it is published in its final citable form. Please note that during the production process errors may be discovered which could affect the content, and all legal disclaimers that apply to the journal pertain.
Conflicts of Interest
The authors declare that they have no conflicts of interest
Authors’ contributions. All authors contributed to the design and analysis of experiments, interpretation of data, writing and editing of the manuscript. In addition, vivo mouse experiments were performed by EJG, MS and ZZ.
References
- 1.Palmer ND, Stevens RD, Antinozzi PA, Anderson A, Bergman RN, Wagenknecht LE, et al. Metabolomic profile associated with insulin resistance and conversion to diabetes in the Insulin Resistance Atherosclerosis Study. The Journal of clinical endocrinology and metabolism. 2015;100(3):E463–E468. doi: 10.1210/jc.2014-2357. [DOI] [PMC free article] [PubMed] [Google Scholar]
- 2.Bain JR, Stevens RD, Wenner BR, Ilkayeva O, Muoio DM, Newgard CB. Metabolomics applied to diabetes research: moving from information to knowledge. Diabetes. 2009;58(11):2429–2443. doi: 10.2337/db09-0580. [DOI] [PMC free article] [PubMed] [Google Scholar]
- 3.Menni C, Fauman E, Erte I, Perry JR, Kastenmuller G, Shin SY, et al. Biomarkers for type 2 diabetes and impaired fasting glucose using a nontargeted metabolomics approach. Diabetes. 2013;62(12):4270–4276. doi: 10.2337/db13-0570. [DOI] [PMC free article] [PubMed] [Google Scholar]
- 4.Schooneman MG, Achterkamp N, Argmann CA, Soeters MR, Houten SM. Plasma acylcarnitines inadequately reflect tissue acylcarnitine metabolism. Biochimica et biophysica acta. 2014;1841(7):987–994. doi: 10.1016/j.bbalip.2014.04.001. [DOI] [PubMed] [Google Scholar]
- 5.DeFronzo RA, Tripathy D. Skeletal muscle insulin resistance is the primary defect in type 2 diabetes. Diabetes care. 2009;32(Suppl 2):S157–S163. doi: 10.2337/dc09-S302. [DOI] [PMC free article] [PubMed] [Google Scholar]
- 6.D'Souza DM, Al-Sajee D, Hawke TJ. Diabetic myopathy: impact of diabetes mellitus on skeletal muscle progenitor cells. Frontiers in physiology. 2013;4:379. doi: 10.3389/fphys.2013.00379. [DOI] [PMC free article] [PubMed] [Google Scholar]
- 7.Nguyen MH, Cheng M, Koh TJ. Impaired muscle regeneration in ob/ob and db/db mice. The Scientific World Journal. 2011;11:1525–1535. doi: 10.1100/tsw.2011.137. [DOI] [PMC free article] [PubMed] [Google Scholar]
- 8.Kim H, Pennisi PA, Gavrilova O, Pack S, Jou W, Setser-Portas J, et al. Effect of adipocyte beta3-adrenergic receptor activation on the type 2 diabetic MKR mice. American journal of physiology Endocrinology and metabolism. 2006;290(6):E1227–E1236. doi: 10.1152/ajpendo.00344.2005. [DOI] [PubMed] [Google Scholar]
- 9.Aragno M, Mastrocola R, Catalano MG, Brignardello E, Danni O, Boccuzzi G. Oxidative stress impairs skeletal muscle repair in diabetic rats. Diabetes. 2004;53(4):1082–1088. doi: 10.2337/diabetes.53.4.1082. [DOI] [PubMed] [Google Scholar]
- 10.Leite NC, Villela-Nogueira CA, Cardoso CR, Salles GF. Non-alcoholic fatty liver disease and diabetes: from physiopathological interplay to diagnosis and treatment. World journal of gastroenterology. 2014;20(26):8377–8392. doi: 10.3748/wjg.v20.i26.8377. [DOI] [PMC free article] [PubMed] [Google Scholar]
- 11.Bugianesi E, Vanni E, Marchesini G. NASH and the risk of cirrhosis and hepatocellular carcinoma in type 2 diabetes. Current diabetes reports. 2007;7(3):175–180. doi: 10.1007/s11892-007-0029-z. [DOI] [PubMed] [Google Scholar]
- 12.Fernandez AM, Kim JK, Yakar S, Dupont J, Hernandez-Sanchez C, Castle AL, et al. Functional inactivation of the IGF-I and insulin receptors in skeletal muscle causes type 2 diabetes. Genes & development. 2001;15(15):1926–1934. doi: 10.1101/gad.908001. [DOI] [PMC free article] [PubMed] [Google Scholar]
- 13.Lu H, Koshkin V, Allister EM, Gyulkhandanyan AV, Wheeler MB. Molecular and metabolic evidence for mitochondrial defects associated with beta-cell dysfunction in a mouse model of type 2 diabetes. Diabetes. 2010;59(2):448–459. doi: 10.2337/db09-0129. [DOI] [PMC free article] [PubMed] [Google Scholar]
- 14.Heron-Milhavet L, Mamaeva D, LeRoith D, Lamb NJ, Fernandez A. Impaired muscle regeneration and myoblast differentiation in mice with a muscle-specific KO of IGF-IR. Journal of cellular physiology. 2010;225(1):1–6. doi: 10.1002/jcp.22218. [DOI] [PubMed] [Google Scholar]
- 15.Kawashima Y, Fritton JC, Yakar S, Epstein S, Schaffler MB, Jepsen KJ, et al. Type 2 diabetic mice demonstrate slender long bones with increased fragility secondary to increased osteoclastogenesis. Bone. 2009;44(4):648–655. doi: 10.1016/j.bone.2008.12.012. [DOI] [PMC free article] [PubMed] [Google Scholar]
- 16.Mallipattu SK, Gallagher EJ, LeRoith D, Liu R, Mehrotra A, Horne SJ, et al. Diabetic nephropathy in a nonobese mouse model of type 2 diabetes mellitus. American journal of physiology Renal physiology. 2014;306(9):F1008–F1017. doi: 10.1152/ajprenal.00597.2013. [DOI] [PMC free article] [PubMed] [Google Scholar]
- 17.Vander Jagt DL, Robinson B, Taylor KK, Hunsaker LA. Aldose reductase from human skeletal and heart muscle. Interconvertible forms related by thiol-disulfide exchange. The Journal of biological chemistry. 1990;265(34):20982–20987. [PubMed] [Google Scholar]
- 18.Yamanouchi T, Akanuma H, Nakamura T, Akaoka I, Akanuma Y. Reduction of plasma 1,5-anhydroglucitol (1-deoxyglucose) concentration in diabetic patients. Diabetologia. 1988;31(1):41–45. doi: 10.1007/BF00279131. [DOI] [PubMed] [Google Scholar]
- 19.Bormans GM, Van Oosterwyck G, De Groot TJ, Veyhl M, Mortelmans L, Verbruggen AM, et al. Synthesis and biologic evaluation of (11)c-methyl-d-glucoside, a tracer of the sodium-dependent glucose transporters. Journal of nuclear medicine : official publication, Society of Nuclear Medicine. 2003;44(7):1075–1081. [PubMed] [Google Scholar]
- 20.Vaitheesvaran B, LeRoith D, Kurland IJ. MKR mice have increased dynamic glucose disposal despite metabolic inflexibility, and hepatic and peripheral insulin insensitivity. Diabetologia. 2010;53(10):2224–2232. doi: 10.1007/s00125-010-1827-4. [DOI] [PMC free article] [PubMed] [Google Scholar]
- 21.Brownlee M. The pathobiology of diabetic complications: a unifying mechanism. Diabetes. 2005;54(6):1615–1625. doi: 10.2337/diabetes.54.6.1615. [DOI] [PubMed] [Google Scholar]
- 22.Chakravarthi S, Jessop CE, Bulleid NJ. The role of glutathione in disulphide bond formation and endoplasmic-reticulum-generated oxidative stress. EMBO reports. 2006;7(3):271–275. doi: 10.1038/sj.embor.7400645. [DOI] [PMC free article] [PubMed] [Google Scholar]
- 23.Huck JH, Roos B, Jakobs C, van der Knaap MS, Verhoeven NM. Evaluation of pentitol metabolism in mammalian tissues provides new insight into disorders of human sugar metabolism. Molecular genetics and metabolism. 2004;82(3):231–237. doi: 10.1016/j.ymgme.2004.05.003. [DOI] [PubMed] [Google Scholar]
- 24.Wamelink MM, Struys EA, Jakobs C. The biochemistry, metabolism and inherited defects of the pentose phosphate pathway: a review. Journal of inherited metabolic disease. 2008;31(6):703–717. doi: 10.1007/s10545-008-1015-6. [DOI] [PubMed] [Google Scholar]
- 25.Perl A, Hanczko R, Telarico T, Oaks Z, Landas S. Oxidative stress, inflammation and carcinogenesis are controlled through the pentose phosphate pathway by transaldolase. Trends in molecular medicine. 2011;17(7):395–403. doi: 10.1016/j.molmed.2011.01.014. [DOI] [PMC free article] [PubMed] [Google Scholar]
- 26.Fernandez AM, Dupont J, Farrar RP, Lee S, Stannard B, Le Roith D. Muscle-specific inactivation of the IGF-I receptor induces compensatory hyperplasia in skeletal muscle. The Journal of clinical investigation. 2002;109(3):347–355. doi: 10.1172/JCI13503. [DOI] [PMC free article] [PubMed] [Google Scholar]
- 27.Sanchez OA, Walseth TF, Snow LM, Serfass RC, Thompson LV. Skeletal muscle sorbitol levels in diabetic rats with and without insulin therapy and endurance exercise training. Experimental diabetes research. 2009;2009:737686. doi: 10.1155/2009/737686. [DOI] [PMC free article] [PubMed] [Google Scholar]
- 28.Cotter MA, Cameron NE, Robertson S, Ewing I. Polyol pathway-related skeletal muscle contractile and morphological abnormalities in diabetic rats. Experimental physiology. 1993;78(2):139–155. doi: 10.1113/expphysiol.1993.sp003675. [DOI] [PubMed] [Google Scholar]
- 29.Ghahary A, Chakrabarti S, Sima AA, Murphy LJ. Effect of insulin and statil on aldose reductase expression in diabetic rats. Diabetes. 1991;40(11):1391–1396. doi: 10.2337/diab.40.11.1391. [DOI] [PubMed] [Google Scholar]
- 30.Huck JH, Verhoeven NM, Struys EA, Salomons GS, Jakobs C, van der Knaap MS. Ribose-5-phosphate isomerase deficiency: new inborn error in the pentose phosphate pathway associated with a slowly progressive leukoencephalopathy. American journal of human genetics. 2004;74(4):745–751. doi: 10.1086/383204. [DOI] [PMC free article] [PubMed] [Google Scholar]
- 31.Yoshioka S, Kameyama K, Sanaka M, Sekine I, Kagimoto S, Fujitsuka S, et al. Effect of diabetes on the free polyol pattern in cataractous lenses. Clinical chemistry. 1991;37(5):686–689. [PubMed] [Google Scholar]
- 32.Novello F, Gumaa JA, McLean P. The pentose phosphate pathway of glucose metabolism. Hormonal and dietary control of the oxidative and non-oxidative reactions of the cycle in liver. The Biochemical journal. 1969;111(5):713–725. doi: 10.1042/bj1110713. [DOI] [PMC free article] [PubMed] [Google Scholar]
- 33.Baquer NZ, Sochor M, McLean P. Hormonal control of the 'compartmentation' of the enzymes of the pentose phosphate pathway associated with the large particle fraction of rat liver. Biochemical and biophysical research communications. 1972;47(1):218–226. doi: 10.1016/s0006-291x(72)80031-7. [DOI] [PubMed] [Google Scholar]
- 34.Ge SL, Wang H, Wang ZF, Cheng S, Wang QJ, He PG, et al. Sensitive measurement of polyols in urine by capillary zone electrophoresis coupled with amperometric detection using on-column complexation with borate. Journal of chromatography B, Analytical technologies in the biomedical and life sciences. 2013;915–916:39–45. doi: 10.1016/j.jchromb.2012.12.017. [DOI] [PubMed] [Google Scholar]
- 35.Ladep NG, Dona AC, Lewis MR, Crossey MM, Lemoine M, Okeke E, et al. Discovery and validation of urinary metabotypes for the diagnosis of hepatocellular carcinoma in West Africans. Hepatology. 2014;60(4):1291–1301. doi: 10.1002/hep.27264. [DOI] [PubMed] [Google Scholar]
- 36.Vander Jagt DL, Hunsaker LA. Methylglyoxal metabolism and diabetic complications: roles of aldose reductase, glyoxalase-I, betaine aldehyde dehydrogenase and 2-oxoaldehyde dehydrogenase. Chemicobiological interactions. 2003;143–144:341–351. doi: 10.1016/s0009-2797(02)00212-0. [DOI] [PubMed] [Google Scholar]
- 37.Kumar A, Shiloach J, Betenbaugh MJ, Gallagher EJ. The beta-3 adrenergic agonist (CL-316,243) restores the expression of down-regulated fatty acid oxidation genes in type 2 diabetic mice. Nutrition & metabolism. 2015;12:8. doi: 10.1186/s12986-015-0003-8. [DOI] [PMC free article] [PubMed] [Google Scholar]
- 38.Giesbertz P, Padberg I, Rein D, Ecker J, Hofle AS, Spanier B, et al. Metabolite profiling in plasma and tissues of ob/ob and db/db mice identifies novel markers of obesity and type 2 diabetes. Diabetologia. 2015 doi: 10.1007/s00125-015-3656-y. [DOI] [PubMed] [Google Scholar]
- 39.Rull A, Geeraert B, Aragones G, Beltran-Debon R, Rodriguez-Gallego E, Garcia-Heredia A, et al. Rosiglitazone and fenofibrate exacerbate liver steatosis in a mouse model of obesity and hyperlipidemia. A transcriptomic and metabolomic study. Journal of proteome research. 2014;13(3):1731–1743. doi: 10.1021/pr401230s. [DOI] [PubMed] [Google Scholar]
- 40.Brownlee M. Biochemistry and molecular cell biology of diabetic complications. Nature. 2001;414(6865):813–820. doi: 10.1038/414813a. [DOI] [PubMed] [Google Scholar]
- 41.Stincone A, Prigione A, Cramer T, Wamelink MM, Campbell K, Cheung E, et al. The return of metabolism: biochemistry and physiology of the pentose phosphate pathway. Biological reviews of the Cambridge Philosophical Society. 2014 doi: 10.1111/brv.12140. [DOI] [PMC free article] [PubMed] [Google Scholar]
- 42.Chung SS, Ho EC, Lam KS, Chung SK. Contribution of polyol pathway to diabetes-induced oxidative stress. Journal of the American Society of Nephrology : JASN. 2003;14(8 Suppl 3):S233–S236. doi: 10.1097/01.asn.0000077408.15865.06. [DOI] [PubMed] [Google Scholar]