

Summary
Diabetic nephropathy (DN) is the leading cause of renal failure in the world. It is characterized by albuminuria and abnormal glomerular function and is considered a hyperglycaemic “microvascular’ complication of diabetes, implying a primary defect in the endothelium. However, we have previously shown that human podocytes have robust responses to insulin. To determine whether insulin signaling in podocytes affects glomerular function in vivo we generated mice with specific deletion of the insulin receptor from their podocytes. These animals develop significant albuminuria together with histological features that recapitulate DN, but in a normoglycaemic environment. Examination of “normal” insulin responsive podocytes in vivo and in vitro demonstrates that insulin signals through the MAPK and PI3-kinase pathways via the insulin receptor and directly remodels the actin cytoskeleton of this cell. Collectively, this work reveals the critical importance of podocyte insulin sensitivity for kidney function.
Graphical abstract

INTRODUCTION
In 2007 in the United States 54% of patients requiring dialysis or renal transplantation had diabetes mellitus and the annual economic cost of caring for these patients was is in excess of $12 billion (USRDS Atlas of End-stage Renal disease in the United States, 2007). This is similar in other parts of the world and these numbers are predicted to increase greatly in forthcoming years due to the global epidemic of type-2 diabetes (Zimmet et al., 2001).
The natural history of DN is dominated by progressive albuminuria. Initially small amounts of albumin escape into the urine (microalbuminuria) and this develops into overt albuminuria as nephropathy progresses. Not only does albuminuria predict renal disease but it is also an independent cardiovascular risk factor (Perkovic et al., 2008). The presence of albuminuria suggests that the glomerular filtration barrier (GFB) is an early target in this disease. The GFB is composed of two cell types, podocytes and glomerular endothelial cells (GEnC) (Pavenstadt et al., 2003) which are located on either side of the glomerular basement membrane (GBM). The podocyte is particularly important in maintaining the integrity of the GFB in humans as illustrated by a growing number of podocyte specific mutations all of which result in significant albumin loss into the urine (reviewed in(Lavin et al., 2008) and the recently added to by the INF2 gene mutation (Brown et al., 2009)). Albuminuria in DN has previously been considered to be predominantly a consequence of hyperglycaemia directed against the microvasculature (Nishikawa et al., 2000). However, microalbuminuria also occurs in the insulin resistant metabolic syndrome (it is now one of the diagnostic criteria as defined by the World Health Organization). This often occurs with a normal blood glucose level and supports a non- hyperglycaemic pathway of GFB disruption. Furthermore there is growing evidence that podocyte dysfunction plays an important role in the pathogenesis of DN (Wolf et al., 2005). We have previously shown that in respect to glucose uptake podocytes, and not GEnC, are uniquely insulin sensitive cells in the glomerulus of the kidney and able to absorb glucose via translocation of the glucose transporters GLUT1 and GLUT4 (Coward et al., 2005) dependent on the podocyte protein nephrin (Coward et al., 2007). We now show that insulin sensitivity is crucial in maintaining the integrity of the GFB and when lost recapitulates features of diabetic nephropathy.
RESULTS
Specific Loss of Podocyte Insulin Signaling Recapitulates features of Diabetic Nephropathy
We generated two podocyte specific insulin receptor knockout mice (podIRKO) models by crossing floxed insulin receptor (IR) mice with podocyte specific cre recombinase mice driven by both the nephrin and podocin promoters. As we were moving facilities this had the advantage that we could analyze mice in both a conventional facility (Mount Sinai, Toronto - podocin cre IRKO) and a specific pathogen free facility (Toronto centre for phenogenomics- nephrin cre IRKO) to allow us to control for environment. Initially we crossed our cre expressing mice with lacZ/EGFP (Z/EG) reporter mice and ascertained that there were good levels of excision exclusively in podocytes (Figure 1A). We confirmed that the IR was knocked down specifically in the podocyte in 3-week old mice by studying genomic excision of IR DNA in a variety of tissues in podIRKO and control mice and found that genomic DNA was excised in a pure glomerular extract (Figure 1B) only from podIRKO mice (Figure 1C). We went on to prove the IR was specifically knocked down in podocytes in the glomeruli of podIRKO mice by isolating a pure podocyte fraction and performing real time PCR analysis. This revealed at least a 90% knockdown in IR message in podIRKO podocytes. In contrast there was increased IR message in the podocytes of control mice when compared to the other cells of their glomeruli (Figure 1D).
Figure 1. In vivo podocyte specific IR knockdown in transgenic mice.


A. Glomeruli of Z/EG reporter mice immuno-stained with an anti GFP antibody. Specific excision demonstrated in podocytes (arrowed).
B. Glomeruli were extracted and purified using dynabeads. This is light microscopic analysis of the extract showing a pure glomerular population and the beads.
C. PCR of genomic DNA from different tissues in podIRKO compared with (cw) IRfl/fl cre negative mice. Only podIRKO glomeruli have a smaller excised genomic DNA band present [arrowed] (G=glomeruli S=spleen E= ear).
D. Podocyte isolation of CFP positive podocytes from 3 week old podIRKO and control mice demonstrate that the IR mRNA is knocked down by over 90% in podocytes of the podIRKO mice compared with other glomerular cells (OGC) which were CFP negative. In control mice the IR is increased by 60% in the podocyte fraction.
E. There is increased production (100%) of IGF-1 receptor mRNA in podocyte fraction of podIRKO mice compared with a 50% reduction in the control mice.
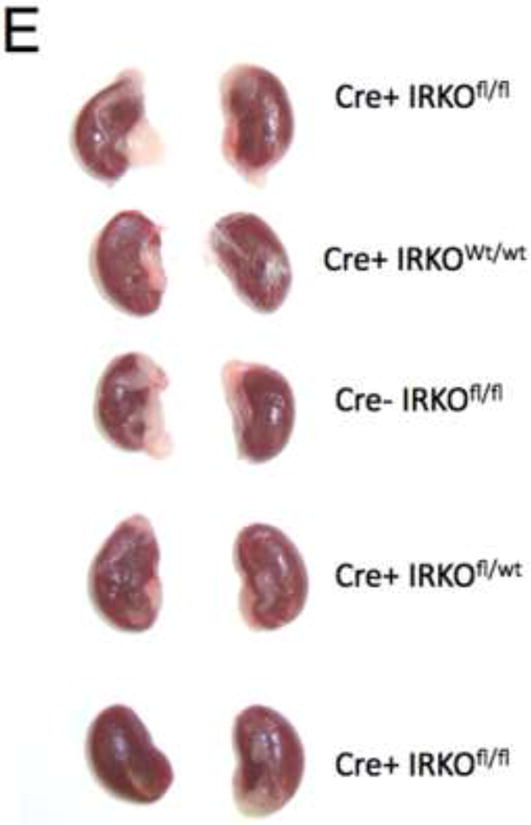
PodIRKO mice were born with normal Mendelian frequency and initially appeared entirely normal. At 8 weeks both podIRKO models were comparable in size to their littermates (Figure 2A and B), were normoglycaemic and had comparable serum insulin levels (Figure 2C and D). The kidney size of these animals was indistinguishable from their controls (Figure 2E).
Figure 2. PodIRKO mice are normoglycaemic and normally grown at 8 weeks of age.

A. Macroscopically mice were indistinguishable.
B. No difference between podIRKO and littermate controls after formal weighing (Mean+/− SEM).
C. They had comparable random blood glucose levels in both podocin and nephrin cre groups (Mean+/− SEM).
D. No difference in serum insulin levels in a subset of mice at 8 weeks.
E. Macroscopically no difference in kidney size between podIRKO and control mice at 8 weeks.
Detailed renal investigation at 3 weeks of age was normal in PodIRKO mice with no abnormality identifiable using either light (data not shown) or electron microscopic analysis (Figure 3I). They were not albuminuric. However, at approximately 5 weeks of age both podIRKO models (nephrin and podocin cre) started to develop albuminuria. The only histological change at this time was loss of structure of the podocyte foot process detected using electron microscopy (Figure 3I). At 8 weeks of age significant levels of albuminuria (Figure 3A and B) and histological changes were present in podIRKO animals. Histological involvement included extensive loss of foot process architecture of the podocyte (Figure 3I), evidence of podocyte apoptosis as illustrated by hyperchromatic, condensed nuclei visualised by hematoxylin and eosin (H and E) stain at 8 weeks of age (Figure 3C) and by Tunel assay at 13 weeks of age (Figure 3F). Furthermore podIRKO mice had increased amounts of glomerular matrix (Figure 3D), which included type IV collagen (Figure 3E), thickened GBM (Figure 3J and K) and increased levels of glomerulosclerosis (Figure 3D). These are classical histological features of DN (Wolf and Ziyadeh, 1999). As they aged these pathological features became more prominent (Figure 3G) with some of the podIRKO mice developing macroscopically shrunken and sclerosed kidneys (Figure 3H). However, we did not find that mesangial hypercellularity was present on objective assessment (Figure 3D).
Figure 3. PodIRKO mice develop albuminuria and histological changes recapitulating features of diabetic nephropathy.


A. At 8 weeks podIRKO mice become albuminuric. SDS page gel shows specific band at 66KD corresponding to Albumin only in PodIRKO mice (2μl of urine loaded for each).
B. Significant proteinuria in podIRKO mice generated on different cre promoters, raised in different environments. However there is variability both between strains and also within the groups (***p<0.001 n≥10 each group, mean +/− SEM shown).
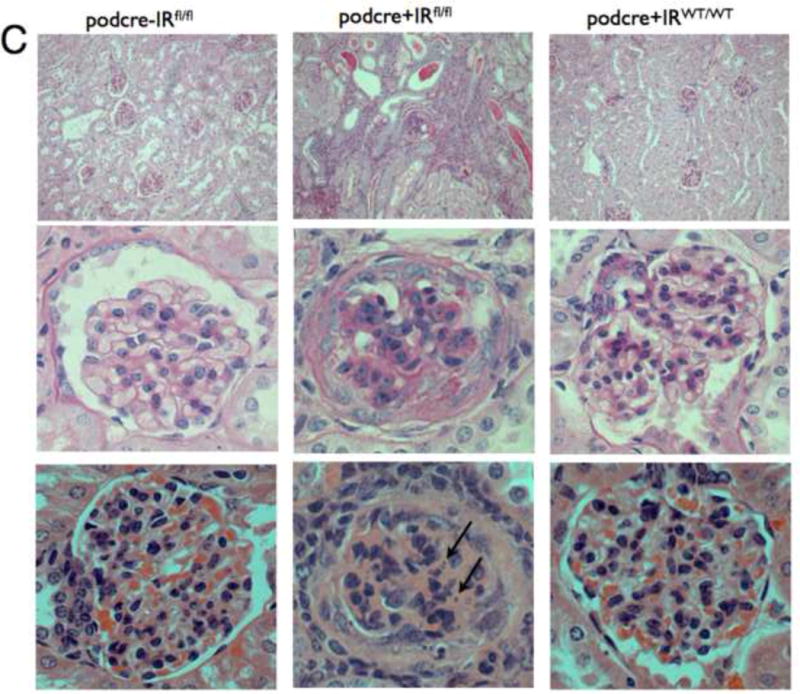
C. Light microscopy for podocin cre podIRKO mice and controls age 8 weeks. Top panels are low power Periodic Acid Schiff (PAS) staining middle high power PAS and lower H and E staining - high power. PodIRKO (middle column) demonstrate dilated tubules containing proteinaceous casts. The glomeruli show increased mesangial matrix production. Several glomeruli appear shrunken, associated with foci of segmental glomerulosclerosis. The affected glomerular segments show adhesion to Bowman’s capsule, segmental scarring, and capillary insudative (hyalinotic) lesions. Occasional podocytes show small, hyperchromatic, condensed nuclei suggestive of apoptotic bodies (arrowed bottom middle panel). Focal glomeruli show podocyte and parietal epithelial cell swelling with large protein absorption droplets.
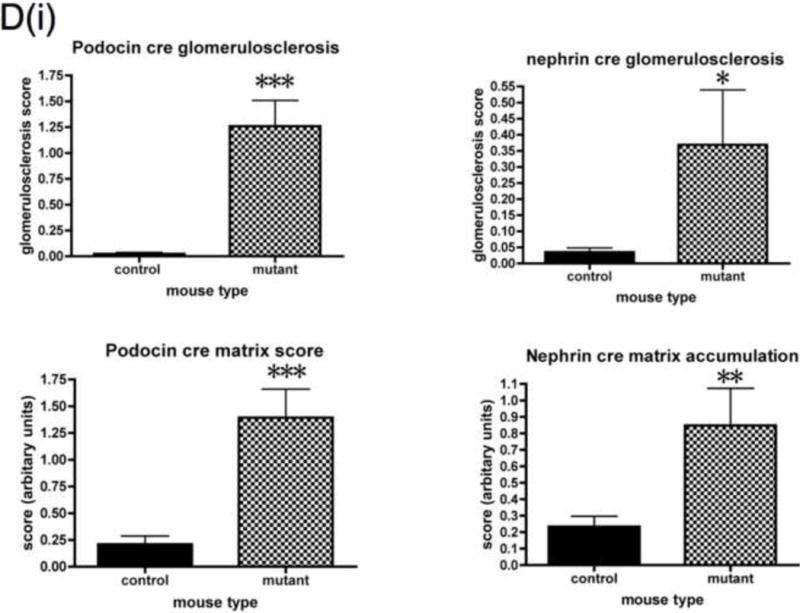
D. Objective histological glomerular scoring reveals significant levels of glomerulosclerosis and matrix accumulation in both the podocin and nephrin cre mice. Histological abnormality is more marked in the podocin animals. No difference in mesangial hypercellularity detected. (*p<0.05 **p<0.005 ***p<0.0005 n≥10 each group, mean +/− SEM shown). Plasma creatinine levels were measured in a subset of mice at 8 weeks. No difference was detected in the nephrin cre mice but in the podocin cre IRKO animals there was a mildly raised creatinine level in mutants when compared to controls.
E. Type IV collagen progressively accumulates in glomeruli of podIRKO mice (brown staining).
F. Podocyte apoptosis is detected using Tunel stain in 13 week podIRKO mice (nephrin promoter). Apoptotic nuclei arrowed.
G. Light microscopy of 13 week old podIRKO (nephrin promoter) showed massive amounts of matrix formation as well as increased glomerulosclerosis, mesangial expansion and protein in the tubules in comparison to the 8 week old mice. right = high power (x63 magnification), left = low power(x10 magnification) PAS staining.
H. Some 13 week old podIRKO mice had small sclerosed kidneys.
I. Transmission electron microscopy of podIRKO and control mice. PodIRKO mice have normal GFB at 3 weeks of age. By age 5 weeks the podocyte actin cytoskeleton is beginning to become deranged with broadening of foot processes (arrowed). Foot processes are completely lost by 8 weeks (arrowed). No obvious changes were detected in the GEnC.
J. Thickening of the GBM of podIRKO mice when measuring the lamina densa.
K. Multiple sections from 3 mutant mice were compared with 3 control mice. Each section had at least 10 measurements of Lamina densa thickness performed perpendicular with the edge of the GBM. **p=0.007 Mean +/− SEM shown.
We detected phenotypic variation between individual podIRKO mice both within the podocin and nephrin cre groups and between these groups (Figure 3B and D). The podocin cre animals were more albuminuric, had greater histological abnormality and worse renal function (Figure 3D) in comparison to the nephrin cre mice. However, although there was variation both groups as a whole were significantly different from their littermate controls. There are a number of possible explanations for the variability between and within groups; firstly the mice were generated on mixed genetic backgrounds, so genetic modifiers could be important. This could also explain the variability within each group. It is recognized that genetic background is important for severity of disease both in diabetic (Kulkarni et al., 2003) and albuminuric models of renal disease (Gurley et al., 2006). Secondly the mice were housed in different facilities and it is likely that the podocin cre mice, which were cared for in a conventional facility were exposed to more environmental stressors which may have resulted in a more severe phenotype. Thirdly, there may be differences in the efficiency of the cre recombinase between the two lines resulting in less IR excision in the nephrin cre mice.
We were interested to assess if compensation of insulin receptor loss was occurring by up-regulation of the IGF-1 receptor, as insulin is able to signal through both of these receptors (although signals considerably less through the IGF-1 receptor (Kurtzhals et al., 2000)). In vivo we found that IGF1 receptor mRNA was up-regulated in the podocytes of podIRKO mice (Figure 1E) compared with controls. This suggests there is a cellular attempt to compensate for insulin receptor loss, presumably to allow insulin to continue to signal to the podocyte.
Insulin signals to the podocyte in the glomerulus
To study insulin stimulated signaling in the glomerulus we utilized a mouse model in which wild-type mice were fasted overnight, thereby lowering insulin to basal levels, and then gave them either insulin or saline via an intra-peritoneal route. After 15 minutes they were sacrificed and their kidneys immediately snap frozen in liquid nitrogen in an attempt to preserve insulin induced protein phosphorylation. We elected to study the Mitogen-activated protein kinase (MAPK), Phosphoinoside 3 kinase (PI3-k) and cap/cbl pathways as these are the signaling cascades described in other rapidly insulin sensitive cells (adipocytes and muscle)(Chiang et al., 2001; Shepherd and Kahn, 1999). Ex vivo, in the glomerulus we could robustly identify insulin stimulated signaling. For MAPK the signaling was exclusively detected in the podocyte using phosphospecific(p) 42 and 44 MAPK (Figure 4A and B). We assessed the PI3-k pathway by using pAKT [ser 273] and found again that signaling was predominantly in the podocyte (Figure 4E). We confirmed these observations by studying immortalized human podocytes and GEnC in isolation and found that when the cells were exposed to low doses of insulin (1nM) that insulin signaled to podocytes via both the MAPK and PI3 kinase pathways (Figure 4C,D,F and G) and that there was a small amount of PI3-k signaling to GEnC (Figure 4F) but not MAPK (Figure 4C). Finally we ascertained that podocyte insulin signaling was through the insulin receptor, and not through the IGF-1 receptor, by repeating the experiments in vivo using PodIRKO mice and in vitro using short hairpin siRNA IR knockdown human podocytes (Figure 4B,C,E and F). These both showed abrogation of both MAPK and PI3-k signaling pathways in response to insulin. We could not detect any effect of insulin on the cap/cbl pathway in podocytes or GEnC (data not shown).
Figure 4. Insulin signals to the podocyte in the glomerulus.
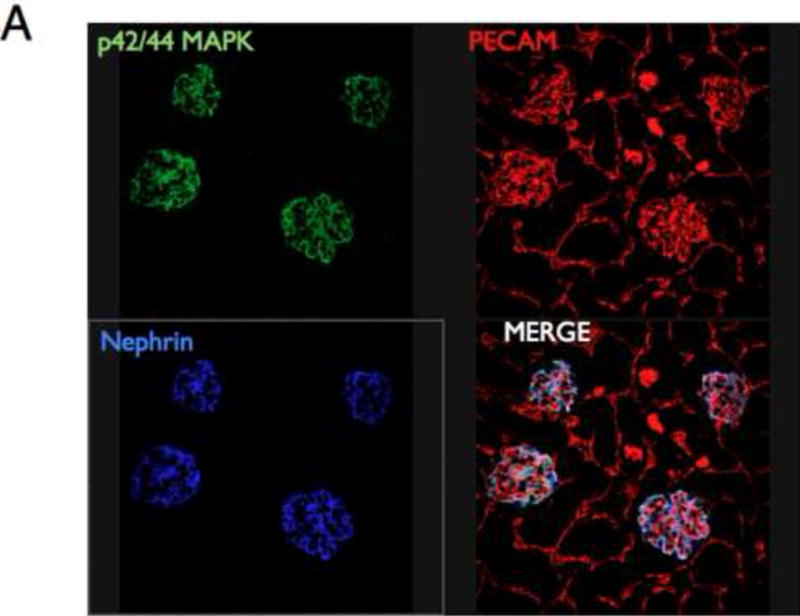


A. MAPK signaling. Mice given insulin phosphorylated p42/44 MAPK only in the glomerulus (×10 magnification). Green =p42/44MAPK; red = PECAM (endothelial marker); blue = nephrin (podocyte marker).
B. Using high power confocal microscopy (×63 magnification) insulin stimulated p42/44 MAPK co-localizes with nephrin demonstrating specific podocyte signaling (middle row). Representative of 3 independent experiments. PodIRKO mice were unable to phosphorylate p42/44 MAPK in response to insulin stimulation (lower row).
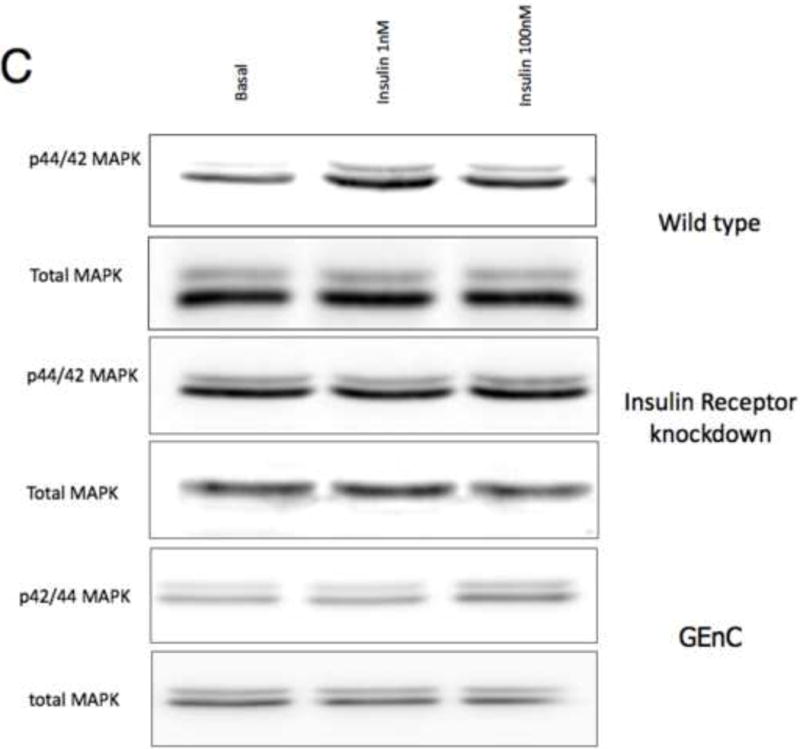
C. p42/44 MAPK is switched on at 15 minutes with both low (1nM) and high dose (100nM) insulin in wild type human podocytes. This does not occur in IR knockdown podocyte cell lines and GEnC in response to low dose insulin.
D. Densitometry in wild type podocytes reveals a 120% increase in insulin-stimulated p42/44MAPK at 15 minutes (p=0.0093 n=6. Mean+/− SEM shown).
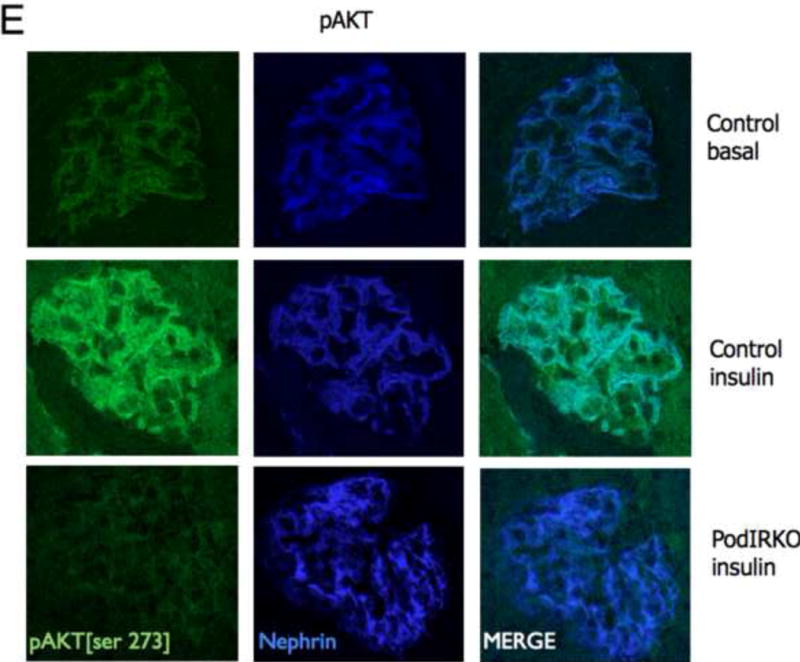
E. pAKT signaling is predominantly in podocytes after 15 minutes stimulation with insulin in wild type mice (upper and middle panels)[representative images from 3 independent experiments]. Insulin stimulated AKT phosphorylation was abrogated in podIRKO mice (lower panels).
F. AKT is phosphorylated in ciPods by 15 minutes at both low and high dose insulin. This does not occur in insulin receptor knockdown podocytes. In contrast to MAPK there is a small amount of pAKT detectable in human GEnC in response to low and high dose insulin.
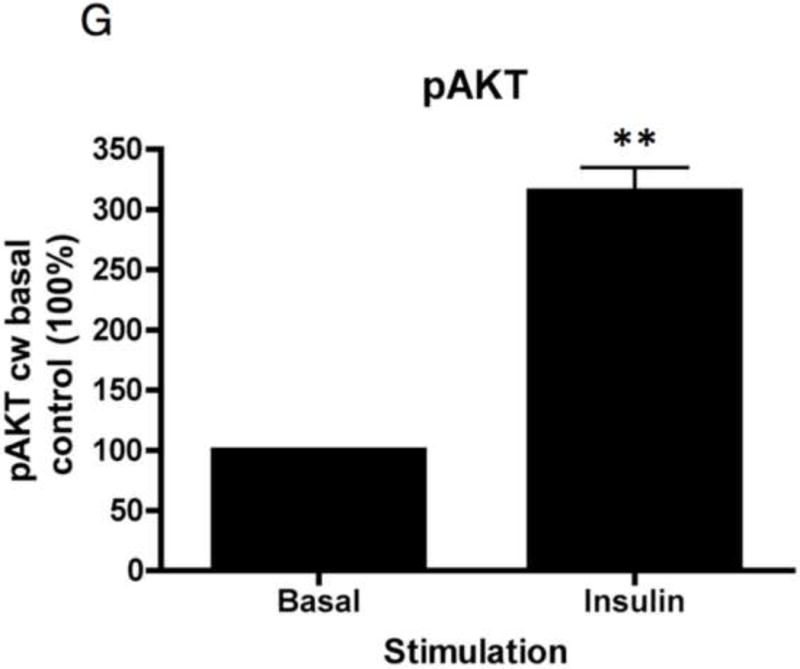
G. Densitometry shows a 200% increase in pAKT phosphorylation in response to insulin in human podocytes (**p= 0.007 n=6. Mean+/− SEM shown).
Insulin directly and specifically reorganizes the actin cytoskeleton of podocytes
Podocyte function in maintaining the integrity of the GFB is dependent on its structure, particularly in the filamentous (F) actin rich foot processes of this cell (Pavenstadt et al., 2003). We therefore assessed if there was any role for insulin in podocyte actin remodeling.
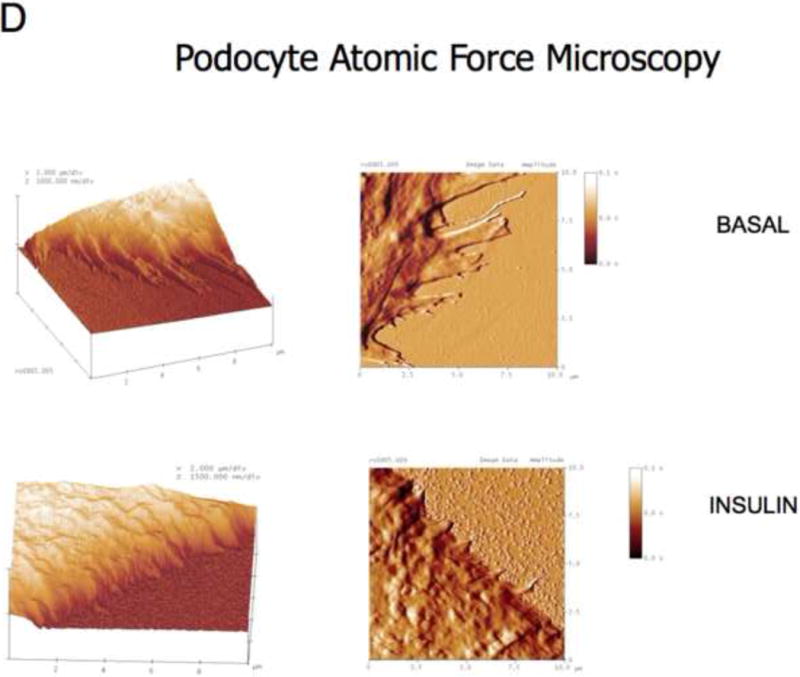
In vitro, we found that insulin directly remodeled the actin cytoskeleton of human podocytes, but not GEnC, in a dose dependent manner causing cortical reorganization of F-actin and that this was IR dependent (Figures 5A,B and C). Actin reorganization resulted in changes in podocyte morphology, particularly retraction of cellular processes (akin to foot processes) as shown by high-resolution atomic force microscopy (Figure 5D), increase in cell motility and migration as measured by scratch assay (Figure 5E), and reduction of monolayer resistance using sensitive electrical cell impedance sensing (ECIS) methodology (Figure 5F). This is a method which can accurately detect changes in monolayer permeability and is particularly good for studying cells that do not form tight monolayers in culture as is the case for podocytes in their differentiated form, which is how they exist in vivo (Pavenstadt et al., 2003) and when they are most insulin sensitive (Coward et al., 2005). As with F-actin reorganization insulin did not alter the monolayer permeability in GEnC treated in the same manner (Figure 5F).
Figure 5. Insulin directly remodels the actin cytoskeleton of podocytes.


A. Immortalized human podocytes and GEnC were insulin stimulated (100nM) for 15 minutes and their F-actin cytoskeleton analyzed with phalloidin staining. Podocytes cortically reorganized (arrowed) their cytoskeleton and this did not occur in GEnC.
B. Insulin receptor knock down (IRKD) immortalized podocytes do not remodel their F-actin cytoskelton in response to insulin (phalloidin staining).
C. Objective computer assisted analysis with the in cell analyzer showed a dose response in insulin stimulated actin reorganization in Wild type podocytes which was statistically significant from 6.25nM. (ANOVA p<0.001 bonferonni *p<0.05 **p<0.001 compared with (cw) baseline n=8. Mean+/− SEM). This did not occur in the IRKD treated podocytes.
D. Atomic force microscopy representative of 4 independent experiments. Insulin causes retraction of cell processes. Insulin applied for 15 minutes.
E. Cell motility is increased in podocytes given insulin but not with IGF-1. Number of cells per unit area was significantly higher in insulin treated group 15 hours after insulin stimulation. This did not occur in IGF-1 treatment. (n=4 ** p< 0.01. Mean +/− SEM shown)
F. Electrical resistance is lost across podocyte monolayers within 5 minutes of insulin stimulation but returns to baseline by 30 minutes using ECIS analysis. ANOVA post hoc Bonferroni *p<0.05 ** p<0.01. No effect observed in GEnC treated in the same manner (n=12). Mean+/− SEM shown.
G. Insulin activates RhoA by 5 minutes (*p=0.018) and inhibits CDC42 by 2 minutes (*p=0.02) of insulin stimulation. These are both back to baseline by 30 and 15 minutes respectively (n=4 each. Mean+/− SEM shown).
H. Differentiated human podocytes transfected with dominant negative constructs v Rho (c3 transferase) and CDC42 (N17CDC42). There is diminished insulin induced cortical actin reorganization in Rho dominant negatively treated cells. CDC42 dominant negative transfection resulted in a high proportion of cells being cortically organized in their basal state.
IGF-1 has the ability to signal via the insulin receptor (Kurtzhals et al., 2000), and shows considerable structural homology with insulin (Rinderknecht and Humbel, 1978). However we found functionally that IGF-1 had no biological effect on actin remodeling, alteration in monolayer electrical resistance (Supplementary Figure 1), or migration and motility (Figure 5E) of podocytes within the same time frame as that observed for insulin.
We went on to explore the mechanism of insulin‟s action on podocyte actin remodeling by studying its effect on small GTPases. Using our in vitro human model we found that insulin activated the GTP form of RhoA within 5 minutes and switched off the GTP form of CDC42 within 2 minutes (Figure 5G). This was confirmed using dominant negative constructs that were virally transfected into the cells. C3 transferase (Dominant negative Rho) prevented insulin stimulated cortical actin reorganization and dominant negative CDC42 (N17CDC42) resulted in cortical F-actin patterning in basal cells (Figure 5H).
DISCUSSION
This study shows that insulin rapidly, and directly, signals to the podocyte in the glomerulus, is able to dynamically remodel the actin cytoskeleton of this cell and has a critically important role in maintaining the integrity of the GFB. Furthermore when podocyte insulin signaling is lost glomerular changes develop that recapitulate a number of features typical of diabetic nephropathy.
The central hypothesis underpinning this study was that podocyte specific insulin sensitivity was important for glomerular function. This had originated from our previous work on conditionally immortalized human podocytes and GEnC suggesting a specific response of differentiated podocytes to insulin in respect to rapid glucose uptake. To explore this hypothesis we generated transgenic podIRKO mice. These mice were born with normal mendelian frequency, were indistinguishable from littermates, and had no evidence of renal disease implying that insulin signaling to the podocyte is not critical for glomerular development. This is similar to the whole body insulin receptor knockout mouse that is normal at birth but dies of diabetic ketoacidosis at 72 hours (Accili et al., 1996) as well as an array of other tissue specific IRKO models that are also initially normal but develop phenotypes as they age (Biddinger and Kahn, 2006). From a renal perspective we found no abnormality until 5 weeks of age when albuminuria started to appear and the only histological abnormality detectable was alterations in the structure of the F-actin rich foot processes. This is in keeping with the observation that early in human DN the cytoskeletal architecture of the podocyte is altered as shown by foot process widening (Bjorn et al., 1995)(Pagtalunan et al., 1997). By 8 weeks of age podIRKO mice had developed significant albuminuria together with histological changes typical of DN (Alsaad and Herzenberg, 2007). These included loss of podocyte morphology, production of large amounts of matrix (including type IV collagen), increased GBM thickness and glomerulosclerosis. There was also evidence of podocyte apoptosis. This is important as podocyte loss is a feature of DN that occurs relatively early in its natural history and is an excellent predictor of disease progression that is superior to other pathological features including mesangial expansion, matrix accumulation and thickening of the GBM ((Pagtalunan et al., 1997)(Wolf et al., 2005). Interestingly the kidneys of the podIRKO mice were not enlarged and on objective analysis of the glomerular mesangium we found no evidence of hypercellularity. These are also characteristic features of human DN and imply that there may be aspects of DN that are the result of podocyte insulin resistance (podocyte actin disorganization and loss of foot process structure, increased matrix, thickening of GBM, podocyte apoptosis and glomerulosclerosis) and aspects that are not (kidney enlargement and mesangial expansion). It may be that the non-insulin resistant podocyte features are consequences of hyperglycaemic or insulin resistant effects on the other cells of the kidney (GEnC and mesangium).
Our results suggest that insulin resistance of the podocyte per se, may be an important initiator for many of the pathological processes observed in DN. In respect to glucose uptake and actin remodeling we have found that GEnC do not rapidly respond to insulin. However there is evidence that insulin also directly signals to the vascular endothelium (Potenza et al., 2009) controlling features such as vascular tone via nitric oxide. Currently there are no murine models that are able to specifically target the GEnC. If they become available they will be helpful in defining the direct role of insulin signaling on GenC and if this is also important for glomerular function.
Cellular insulin resistance is central to the development of the metabolic syndrome and type-2 diabetes. A role for podocyte insulin resistance in the progression of nephropathy in these situations is therefore conceptually easy to understand. Enhancement of podocyte insulin sensitivity may also explain how thiazolidinediones delay or stop progression of nephropathy in these settings (Panchapakesan et al., 2005). Type-1 diabetes is caused by insulin deficiency but the associated nephropathy is similar to type-2 diabetes in respect to both its natural history and histological features. Conceptually in type-1 DN podocyte insulin resistance would appear not to be important. However, there is compelling evidence that patients with type-1 diabetes who develop nephropathy are also more insulin resistant at a cellular level compared to those patients who do not develop kidney disease. Type-1 nephropathic patients often require higher doses of insulin to treat their diabetes (Andersen et al., 1983), have higher levels of cellular insulin resistance as determined by objective euglycaemic clamp studies (Orchard et al., 2002), and are more likely to have a positive family history of cellular insulin resistance (Hadjadj et al., 2004). Furthermore type-1 diabetes itself induces cellular insulin resistance when prolonged (Yki-Jarvinen and Koivisto, 1986), and nephropathy commonly takes years to develop. Therefore, it is distinctly possible that podocyte insulin resistance is also influential in the development of nephropathy in type-1 diabetes. Therapeutically this is important, as it implys that cellular insulin sensitizers could be beneficial in preventing or slowing progression of nephropathy in this setting. This is supported by a number of type-1 diabetic animal models (Isshiki et al., 2000; Nicholas et al., 2001; Zhang et al., 2008) in which insulin sensitizers have been shown to slow renal disease progression independent of glycaemic control.
It was not surprising that insulin signals to the podocyte through both the MAPK and PI3-k pathways given the extensive literature on other rapidly insulin responsive cells such as adipocytes and skeletal muscle (Shepherd and Kahn, 1999), and work performed on podocytes by both us (Coward et al., 2005) and other groups (Tejada et al., 2008). However, the importance and specificity of this effect in the kidney has not been previously reported. We found that the rapid effects of insulin in phosphorylating key molecules in these pathways (p42/p44 MAPK and pAKT [Ser473]) occurred predominantly in the podocyte of the kidney. We went on to knock down the insulin receptor both in vivo and in vitro revealing that in both models these signaling pathways were abrogated. This supports the notion that insulin signals predominantly through the insulin receptor in podocytes and not through the IGF-1 or hybrid IGF-1/IR receptor.
Insulin directly, rapidly and specifically reorganized the actin cytoskeleton of normal human podocytes, again via the IR, and loss of podocyte foot process cytoskeletal architecture was the earliest abnormality detected in the GFB of our podIRKO models. As the podocyte is dependent on maintaining the structure of its foot process to maintain the integrity of the GFB with think this is an important observation. We speculate that in health insulin induced dynamic remodeling of the podocyte and particularly its foot process occurs physiologically after a meal to deal with the increased filtration load the GFB experiences at this time. We believe this is facilitated by the insulin- stimulated uptake of glucose into this cell through translocation of glucose transporters (Coward et al., 2005) as a source of energy.
Podocyte actin reorganization was achieved through activation of Rho-A and inhibition of CDC42. This is consistent with studies that have examined the activation state of these small GTPases in models of relaxation (Zhang et al., 2007) and tightening (Gao et al., 2007) of cell junctions between podocytes. Our work has shown that insulin activated Rho-A causes contraction and cortical reorganization of filamentous actin. This is not the case for fibroblasts that have been most intensely studied (Nobes and Hall, 1995), where Rho-A induces stress fibres. However, cortical reorganization has been shown to occur in other cell types (Maddox and Burridge, 2003) and Rho-A induced loss of processes is a common finding in neurons (Postma et al., 1996), a cell type with a number of similarities to podocytes (Kobayashi et al., 2004).
Collectively this work shows that the podocyte is a uniquely insulin sensitive cell in the kidney and is able to rapidly remodel its actin cytoskeleton and morphology in response to insulin. Furthermore, insulin signaling to this cell is critically important for the glomerulus to function normally and when diminished results in a number of pathological features that are similar to diabetic nephropathy. Enhancing insulin sensitivity of the podocyte is an attractive approach in the treatment of the commonest cause of renal failure in the world.
EXPERIMENTAL PROCEEDURES
In vivo studies
Transgenic Mice studies
PodIRKO mice were generated by crossing mice who had loxP sites inserted on either side of exon 4 (Bruning et al., 1998) of their insulin receptor with cre recombinase producing animals linked to either the podocin (Ding et al., 2006) or nephrin promoter (Eremina et al., 2003). PodIRKO mice were homozygous for the floxed insulin receptor gene and were heterozygous for cre recombinase. These animals were on a mixed genetic background with contributions from C57BL/6, 129/SV, and FVB strains. Mice were genotyped using PCR as previously described (Bruning et al., 1998; Ding et al., 2006; Eremina et al., 2003). Control mice were litter-mates of podIRKOs and included flox/flox insulin receptor mice but without cre, together with cre positive mice with no floxed insulin receptor present. They were all fed on standard chow. Z/EG reporter mice (Novak et al., 2000) were initially crossed with the cre producing mice as previously described to ensure specific excision in podocytes. All animal husbandry was carried out in accordance with the Canadian Council on Animal Care protocols and protocols were approved by the animal care committee at the Samuel Lunenfeld Research Institute.
CFP podocyte isolation and quantitative real time PCR
To isolate podocytes from glomeruli we utilized the nephrin Cyan Fluorescent Protein (CFP) mouse (Cui et al., 2005) which has CFP linked to the nephrin promoter and is able to label podocytes. These mice were crossed with podIRKO mice and animals were generated that were heterozygous for nephrin CFP and podocin cre and homozygous for loxP IR. These were then compared to other control nephrin CFP positive mice that were also heterozgous for only podocin cre or homozygous for the floxed insulin receptor gene. Animals were sacrificed and their kidneys passed through a 105μm sieve and caught on a 71μm sieve. A single cell suspension was made by incubating the glomeruli in digestion buffer containing 0.2% trypsin 1 mg/ml collagenase A, 2 mg/ml EDTA and 100units/ml DNAse I at 37°C for 40 minutes. 7-aminoactinomyocin was added to the cells just prior to FACS sorting to identify dead cells, which were excluded in the sort. They were then FACS sorted and gating was set to isolate a pure CFP positive population. These were compared to CFP negative cells from the glomerular sort. To ensure we had isolated a pure podocyte population in the CFP positive fraction we measured mRNA production of nephrin (podocyte marker) and platelet/endothelial cell adhesion molecule 1 (PECAM) (endothelial marker) in both fractions. We found substantially more nephrin and less PECAM in the CFP positive fraction indicating we had specifically isolated podocytes in our experiments (Supplementary Figure 2).
To obtain enough mRNA from these experiments we needed to pool 3 mice from both the CFP positive podIRKO group and from the control group. Messenger RNA was prepared using trizol and reverse transcribed into cDNA using the reverse first strand DNA synthesis kit (Fermentas Burlington, Canada). Expression for the insulin receptor, IGF-1 receptor, nephrin, PECAM and HPRT (housekeeping gene) was measured. The primers used are shown in supplementary data table 1. The comparative ΔΔCT method of relative quantification was used to calculate for differences in gene expression using the software for ABI Prism 7900 Sequence Detection system (Applied Biosystems).
Glomerular isolation and detection of genomic excision of the IR
This was performed as previously described (Cui et al., 2005) with the use of magnetic dynabeads . Identification of insulin receptor gene excision was achieved by Reverse transcription PCR with primers flanking the loxP sites situated in the insulin receptor gene. The primer sequence used was forward TCTATCATGTGATCAATGATTC and reverse ATACCAGAGCATAGGAG.
Glomerular insulin signaling in wild type mice
We used the same approach as previously described (Patel et al., 2008) to prepare, dose with insulin and isolate the kidneys of these mice. Phospho specific antibodies against 42/44 MAPK and serine 273 AKT were purchased from Cell signaling.
Histological analysis
Kidneys were processed as previously described (Eremina et al., 2003). We used phosphoantibodies from Cell signaling to detect insulin stimulated phosphorylated proteins in both the tissue immunofluorescence and in our cell culture experiments. Nephrin (Acris, Germany), PECAM (Pharmingen, San Diego, CA) and type IV collagen (Cedarlane) antibodies were used in the mouse experiments. Immunohistochemistry was performed on formulin fixed tissue as previously described (Eremina et al., 2003) as was the Tunel stain (Wijsman et al., 1993). Electron microscopy was achieved using a similar technique as previously employed (Eremina et al., 2003) with one variation. The fixation buffer consisted of 0.1M Sodium Cocodylate and 2% Glutaraldehyde. Blinded analysis of glomerular histology was performed by an experienced histopathologist (AMH) (Supplementary methods).
In vitro studies
Immortalized cells
Conditionally immortalized human podocytes and GEnC were used as previously described (Saleem et al., 2002; Satchell et al., 2006). Podocytes were studied 2 weeks after thermoswitching from 33°C to 37°C. Thermo-switching silences a temperature sensitive SV40 gene in the cells which prevents them from entering the cell cycle (as occurs at 33°C) and allows them to differentiate. This is important as in vivo podocytes are terminally differentiated cells. Conditionally immortalized podocytes express cellular markers and morphologically resemble differentiated podocytes. Two different wild type podocyte cell lines were studied and one endothelial cell line. Different clones of each cell line were studied to ensure we were not observing a clonal effect. Passage numbers between 10 to15 were examined.
Insulin stimulation
Cells were insulin and fetal calf serum (FCS) starved for at least 12 hours prior to stimulation. They were treated with insulin doses ranging from 0.1mM to 200mM for 15 minutes to assess actin reorganization. To elucidate signaling pathways a dose of 100nM for 15 minutes was used which is common practice in insulin cell signaling studies.
Immunofluorescence
Cells were prepared in 96 well cell bind plates (Nunc Roskilde, Denmark) or on glass cover slips (Menzel-Glaser). They were fixed in 4% paraformaldehyde for 15 minutes, permeabilized with 0.2% Triton and then washed with 0.1% sodium borohydride. The actin cytoskeleton was visualized using phalloidin conjugated alexaflour 488 or texas red (Invitrogen) and nuclei using DAPI (Sigma). Cells were imaged using the In Cell Analyser (GE healthcare) and changes assessed and processed using the multi target analysis algorithm software as recently described (Caunt et al., 2008). The In Cell Analyser is able to detect cells by virtue of their nuclei (DAPI staining) it then objectively identifies actin patterning and assigns each cell as either having cortical or cytoplasmic distribution.
Atomic force microscopy
Atomic force microscopy was carried out on a commercial instrument (Nanoscope IIIa controller and Dimension head, Veeco, UK), using standard triangular silicon nitride cantilevers with a nominal spring constant of 0.32 N/m (Olympus ORC8, Veeco, UK). Cells were fixed with 4% sucrose/ 2% paraformaldehyde and then imaged using intermittent contact mode in liquid (under Phosphate Buffered Saline)(Tamayo et al., 2001).
Activated GTPase assays and dominant negative studies
Measurement of the GTP form of cell division cycle 42 (CDC42) was achieved using EZ-detect small GTPase kits (Pierce, Northumberland UK). Activated GTP Rho-A was performed using the same techniques as recently reported (Lennon et al., 2008). Rho and CDC42 dominant negative adenoviral constructs were generated by Myc tagged C3-transferase and N17Cdc42 mutants being subcloned them into pacAd vectors. These were fully sequenced and transfected into differentiated podocytes 24 hours prior to experimentation. We found that adenoviral transfection was excellent (greater than 95%) in podocytes using adenoviral GFP tagged RhoA and CDC42 constructs (Supplementary Figure 3).
Electrical cell substrate impedance sensing
Time course analysis and resistance measurement was performed using an automated cell monitoring system ‘Electrical Cell-Substrate Impedance Sensing’ (ECIS 1600R, Applied Biophysics, Rochester, NY) as recently described (Satchell et al., 2007). This detects nanometre scale changes in cell morphology, in real time, by virtue of the changes in electrical resistance it detects. Briefly, immortalised podocytes and endothelial cells were seeded onto gold microelectrodes in wells of ECIS arrays (8 well, 10 electrodes per well). Confluent cell monolayers were treated with 100nM insulin or vehicle control in usual medium. Using the ECIS attachment mode resistance was measured at regular time intervals of 30 seconds. The ratio of measured resistance to baseline resistance was calculated for each well and plotted as a function of time, normalized to control.
Scratch assay
This was performed as previously described (Vollenbroker et al., 2009).
Short hairpin Insulin receptor knockdown
Specific lentiviral transduction particles (Sigma) were used to produce stable knockdown human podocyte cell clones. The lentiviral transduction particles consist of an average of 3–5 individual constructs targeting different regions of the gene sequence. Therefore, a range of knockdown efficiency can be expected. Proliferating podocytes at 33°C were co-incubated with approximately 525 lentiviral transducing particles in standard culture media containing Polybrene® (Sigma) for 24 hours. Following viral incubation the cells were washed with normal media then left to recover for a further 24 hours in fresh media before the addition of puromycin dihydrochloride. Antibiotic selection pressure was exerted on the cells until individual puromycin resistant colonies of cells developed. These clones were then selected, expanded and examined for their level of receptor knockdown. We analyzed knock down by Western blot and quantitative real time PCR and studied a clone that had 70% of knockdown of the insulin receptor (Supplementary Figure 4).
Statistics
Comparison between two groups was performed using student’s t-test. For more than 2 groups analysis of variance with a post-hoc Bonferroni was used. Statistical significance was defined as a p value less than 0.05. Standard error of mean (SEM) is shown for each population.
Supplementary Material
Acknowledgments
RJMC and LH are supported by the Medical Research Council (Grant number G0501901). The majority of the work presented here was funded by this grant. RL and SCS are supported by the Wellcome trust. AMH was supported by Canadian Diabetes Association Operating Grant #300349. Some of this work was supported by a grant awarded by North Bristol NHS Trust. We would like to thank Doug Holmyard who processed the electron microscopic pictures, Ken Harpal who prepared the renal histology and Dionne White who FACS sorted the glomerular cells. This work is dedicated to the brilliant Andrew Herzenberg (1971–2010) who was a major driving force within this project.
Footnotes
Publisher's Disclaimer: This is a PDF file of an unedited manuscript that has been accepted for publication. As a service to our customers we are providing this early version of the manuscript. The manuscript will undergo copyediting, typesetting, and review of the resulting proof before it is published in its final citable form. Please note that during the production process errors may be discovered which could affect the content, and all legal disclaimers that apply to the journal pertain.
Author contributions
GIW, LJH, RL, DAP performed the in-vitro studies. VE, MJ and YM helped perform the mouse studies. RJO and MJM facilitated the atomic force microscopy. CJC and CAM performed in cell analysis of the actin cytoskeleton, and generated the dominant negative RhoA and CDC42 constructs. SCS supplied the human glomerular endothelial cells and coordinated ECIS experiments. AMH analyzed the murine glomerular histology and also performed the type IV collagen immunohistochemistry and Tunel stains. CRK supplied the floxed insulin receptor knockout mice. HWP facilitated the in vivo work. JMT facilitated the in vitro work. PMW, MAS and SEQ contributed to experimental design, critically appraised the manuscript and greatly facilitated this work through their laboratories. RJMC designed the experiments, performed some of the in vitro and in vivo work, analyzed the data and wrote the manuscript.
Bibliography
- Accili D, Drago J, Lee EJ, Johnson MD, Cool MH, Salvatore P, Asico LD, Jose PA, Taylor SI, Westphal H. Early neonatal death in mice homozygous for a null allele of the insulin receptor gene. Nat Genet. 1996;12:106–109. doi: 10.1038/ng0196-106. [DOI] [PubMed] [Google Scholar]
- Alsaad KO, Herzenberg AM. Distinguishing diabetic nephropathy from other causes of glomerulosclerosis: an update. J Clin Pathol. 2007;60:18–26. doi: 10.1136/jcp.2005.035592. [DOI] [PMC free article] [PubMed] [Google Scholar]
- Andersen AR, Christiansen JS, Andersen JK, Kreiner S, Deckert T. Diabetic nephropathy in Type 1 (insulin-dependent) diabetes: an epidemiological study. Diabetologia. 1983;25:496–501. doi: 10.1007/BF00284458. [DOI] [PubMed] [Google Scholar]
- Biddinger SB, Kahn CR. From mice to men: insights into the insulin resistance syndromes. Annu Rev Physiol. 2006;68:123–158. doi: 10.1146/annurev.physiol.68.040104.124723. [DOI] [PubMed] [Google Scholar]
- Bjorn SF, Bangstad HJ, Hanssen KF, Nyberg G, Walker JD, Viberti GC, Osterby R. Glomerular epithelial foot processes and filtration slits in IDDM patients. Diabetologia. 1995;38:1197–1204. doi: 10.1007/BF00422369. [DOI] [PubMed] [Google Scholar]
- Brown EJ, Schlondorff JS, Becker DJ, Tsukaguchi H, Uscinski AL, Higgs HN, Henderson JM, Pollak MR. Mutations in the formin gene INF2 cause focal segmental glomerulosclerosis. Nat Genet. 2009 doi: 10.1038/ng.505. [DOI] [PMC free article] [PubMed] [Google Scholar]
- Bruning JC, Michael MD, Winnay JN, Hayashi T, Horsch D, Accili D, Goodyear LJ, Kahn CR. A muscle-specific insulin receptor knockout exhibits features of the metabolic syndrome of NIDDM without altering glucose tolerance. Mol Cell. 1998;2:559–569. doi: 10.1016/s1097-2765(00)80155-0. [DOI] [PubMed] [Google Scholar]
- Caunt CJ, Rivers CA, Conway-Campbell BL, Norman MR, McArdle CA. Epidermal growth factor receptor and protein kinase C signaling to ERK2: spatiotemporal regulation of ERK2 by dual specificity phosphatases. J Biol Chem. 2008;283:6241–6252. doi: 10.1074/jbc.M706624200. [DOI] [PMC free article] [PubMed] [Google Scholar]
- Chiang SH, Baumann CA, Kanzaki M, Thurmond DC, Watson RT, Neudauer CL, Macara IG, Pessin JE, Saltiel AR. Insulin-stimulated GLUT4 translocation requires the CAP-dependent activation of TC10. Nature. 2001;410:944–948. doi: 10.1038/35073608. [DOI] [PubMed] [Google Scholar]
- Coward RJ, Welsh GI, Koziell A, Hussain S, Lennon R, Ni L, Tavare JM, Mathieson PW, Saleem MA. Nephrin is critical for the action of insulin on human glomerular podocytes. Diabetes. 2007;56:1127–1135. doi: 10.2337/db06-0693. [DOI] [PubMed] [Google Scholar]
- Coward RJ, Welsh GI, Yang J, Tasman C, Lennon R, Koziell A, Satchell S, Holman GD, Kerjaschki D, Tavare JM, et al. The Human Glomerular Podocyte Is a Novel Target for Insulin Action. Diabetes. 2005;54:3095–3102. doi: 10.2337/diabetes.54.11.3095. [DOI] [PubMed] [Google Scholar]
- Cui S, Li C, Ema M, Weinstein J, Quaggin SE. Rapid isolation of glomeruli coupled with gene expression profiling identifies downstream targets in Pod1 knockout mice. J Am Soc Nephrol. 2005;16:3247–3255. doi: 10.1681/ASN.2005030278. [DOI] [PubMed] [Google Scholar]
- Ding M, Cui S, Li C, Jothy S, Haase V, Steer BM, Marsden PA, Pippin J, Shankland S, Rastaldi MP, et al. Loss of the tumor suppressor Vhlh leads to upregulation of Cxcr4 and rapidly progressive glomerulonephritis in mice. Nat Med. 2006;12:1081–1087. doi: 10.1038/nm1460. [DOI] [PubMed] [Google Scholar]
- Eremina V, Sood M, Haigh J, Nagy A, Lajoie G, Ferrara N, Gerber HP, Kikkawa Y, Miner JH, Quaggin SE. Glomerular-specific alterations of VEGF-A expression lead to distinct congenital and acquired renal diseases. J Clin Invest. 2003;111:707–716. doi: 10.1172/JCI17423. [DOI] [PMC free article] [PubMed] [Google Scholar]
- Gao SY, Li CY, Shimokawa T, Terashita T, Matsuda S, Yaoita E, Kobayashi N. Rho-family small GTPases are involved in forskolin-induced cell-cell contact formation of renal glomerular podocytes in vitro. Cell Tissue Res. 2007;328:391–400. doi: 10.1007/s00441-006-0365-3. [DOI] [PubMed] [Google Scholar]
- Gurley SB, Clare SE, Snow KP, Hu A, Meyer TW, Coffman TM. Impact of genetic background on nephropathy in diabetic mice. Am J Physiol Renal Physiol. 2006;290:F214–222. doi: 10.1152/ajprenal.00204.2005. [DOI] [PubMed] [Google Scholar]
- Hadjadj S, Pean F, Gallois Y, Passa P, Aubert R, Weekers L, Rigalleau V, Bauduceau B, Bekherraz A, Roussel R, et al. Different patterns of insulin resistance in relatives of type 1 diabetic patients with retinopathy or nephropathy: the Genesis France-Belgium Study. Diabetes Care. 2004;27:2661–2668. doi: 10.2337/diacare.27.11.2661. [DOI] [PubMed] [Google Scholar]
- Isshiki K, Haneda M, Koya D, Maeda S, Sugimoto T, Kikkawa R. Thiazolidinedione compounds ameliorate glomerular dysfunction independent of their insulin-sensitizing action in diabetic rats. Diabetes. 2000;49:1022–1032. doi: 10.2337/diabetes.49.6.1022. [DOI] [PubMed] [Google Scholar]
- Kobayashi N, Gao SY, Chen J, Saito K, Miyawaki K, Li CY, Pan L, Saito S, Terashita T, Matsuda S. Process formation of the renal glomerular podocyte: is there common molecular machinery for processes of podocytes and neurons? Anat Sci Int. 2004;79:1–10. doi: 10.1111/j.1447-073x.2004.00066.x. [DOI] [PubMed] [Google Scholar]
- Kulkarni RN, Almind K, Goren HJ, Winnay JN, Ueki K, Okada T, Kahn CR. Impact of genetic background on development of hyperinsulinemia and diabetes in insulin receptor/insulin receptor substrate-1 double heterozygous mice. Diabetes. 2003;52:1528–1534. doi: 10.2337/diabetes.52.6.1528. [DOI] [PubMed] [Google Scholar]
- Kurtzhals P, Schaffer L, Sorensen A, Kristensen C, Jonassen I, Schmid C, Trub T. Correlations of receptor binding and metabolic and mitogenic potencies of insulin analogs designed for clinical use. Diabetes. 2000;49:999–1005. doi: 10.2337/diabetes.49.6.999. [DOI] [PubMed] [Google Scholar]
- Lavin PJ, Gbadegesin R, Damodaran TV, Winn MP. Therapeutic targets in focal and segmental glomerulosclerosis. Curr Opin Nephrol Hypertens. 2008;17:386–392. doi: 10.1097/MNH.0b013e32830464f4. [DOI] [PMC free article] [PubMed] [Google Scholar]
- Lennon R, Singh A, Welsh GI, Coward RJ, Satchell S, Ni L, Mathieson PW, Bakker WW, Saleem MA. Hemopexin induces nephrin-dependent reorganization of the actin cytoskeleton in podocytes. J Am Soc Nephrol. 2008;19:2140–2149. doi: 10.1681/ASN.2007080940. [DOI] [PMC free article] [PubMed] [Google Scholar]
- Maddox AS, Burridge K. RhoA is required for cortical retraction and rigidity during mitotic cell rounding. J Cell Biol. 2003;160:255–265. doi: 10.1083/jcb.200207130. [DOI] [PMC free article] [PubMed] [Google Scholar]
- Nicholas SB, Kawano Y, Wakino S, Collins AR, Hsueh WA. Expression and function of peroxisome proliferator-activated receptor-gamma in mesangial cells. Hypertension. 2001;37:722–727. doi: 10.1161/01.hyp.37.2.722. [DOI] [PubMed] [Google Scholar]
- Nishikawa T, Edelstein D, Brownlee M. The missing link: a single unifying mechanism for diabetic complications. Kidney Int Suppl. 2000;77:S26–30. doi: 10.1046/j.1523-1755.2000.07705.x. [DOI] [PubMed] [Google Scholar]
- Nobes CD, Hall A. Rho, rac, and cdc42 GTPases regulate the assembly of multimolecular focal complexes associated with actin stress fibers, lamellipodia, and filopodia. Cell. 1995;81:53–62. doi: 10.1016/0092-8674(95)90370-4. [DOI] [PubMed] [Google Scholar]
- Novak A, Guo C, Yang W, Nagy A, Lobe CG. Z/EG, a double reporter mouse line that expresses enhanced green fluorescent protein upon Cre-mediated excision. Genesis. 2000;28:147–155. [PubMed] [Google Scholar]
- Orchard TJ, Chang YF, Ferrell RE, Petro N, Ellis DE. Nephropathy in type 1 diabetes: a manifestation of insulin resistance and multiple genetic susceptibilities? Further evidence from the Pittsburgh Epidemiology of Diabetes Complication Study. Kidney Int. 2002;62:963–970. doi: 10.1046/j.1523-1755.2002.00507.x. [DOI] [PubMed] [Google Scholar]
- Pagtalunan ME, Miller PL, Jumping-Eagle S, Nelson RG, Myers BD, Rennke HG, Coplon NS, Sun L, Meyer TW. Podocyte loss and progressive glomerular injury in type II diabetes. J Clin Invest. 1997;99:342–348. doi: 10.1172/JCI119163. [DOI] [PMC free article] [PubMed] [Google Scholar]
- Panchapakesan U, Chen XM, Pollock CA. Drug insight: thiazolidinediones and diabetic nephropathy–relevance to renoprotection. Nat Clin Pract Nephrol. 2005;1:33–43. doi: 10.1038/ncpneph0029. [DOI] [PubMed] [Google Scholar]
- Patel S, Doble BW, MacAulay K, Sinclair EM, Drucker DJ, Woodgett JR. Tissue-specific role of glycogen synthase kinase 3beta in glucose homeostasis and insulin action. Mol Cell Biol. 2008;28:6314–6328. doi: 10.1128/MCB.00763-08. [DOI] [PMC free article] [PubMed] [Google Scholar]
- Pavenstadt H, Kriz W, Kretzler M. Cell biology of the glomerular podocyte. Physiol Rev. 2003;83:253–307. doi: 10.1152/physrev.00020.2002. [DOI] [PubMed] [Google Scholar]
- Perkovic V, Verdon C, Ninomiya T, Barzi F, Cass A, Patel A, Jardine M, Gallagher M, Turnbull F, Chalmers J, et al. The relationship between proteinuria and coronary risk: a systematic review and meta-analysis. PLoS Med. 2008;5:e207. doi: 10.1371/journal.pmed.0050207. [DOI] [PMC free article] [PubMed] [Google Scholar]
- Postma FR, Jalink K, Hengeveld T, Moolenaar WH. Sphingosine-1-phosphate rapidly induces Rho-dependent neurite retraction: action through a specific cell surface receptor. Embo J. 1996;15:2388–2392. [PMC free article] [PubMed] [Google Scholar]
- Potenza MA, Addabbo F, Montagnani M. Vascular actions of insulin with implications for endothelial dysfunction. Am J Physiol Endocrinol Metab. 2009;297:E568–577. doi: 10.1152/ajpendo.00297.2009. [DOI] [PubMed] [Google Scholar]
- Rinderknecht E, Humbel RE. The amino acid sequence of human insulin-like growth factor I and its structural homology with proinsulin. J Biol Chem. 1978;253:2769–2776. [PubMed] [Google Scholar]
- Saleem MA, O’Hare MJ, Reiser J, Coward RJ, Inward CD, Farren T, Xing CY, Ni L, Mathieson PW, Mundel P. A conditionally immortalized human podocyte cell line demonstrating nephrin and podocin expression. J Am Soc Nephrol. 2002;13:630–638. doi: 10.1681/ASN.V133630. [DOI] [PubMed] [Google Scholar]
- Satchell SC, Buchatska O, Khan SB, Bhangal G, Tasman CH, Saleem MA, Baker DP, Lobb RR, Smith J, Cook HT, et al. Interferon-beta reduces proteinuria in experimental glomerulonephritis. J Am Soc Nephrol. 2007;18:2875–2884. doi: 10.1681/ASN.2006101104. [DOI] [PubMed] [Google Scholar]
- Satchell SC, Tasman CH, Singh A, Ni L, Geelen J, von Ruhland CJ, O’Hare M J, Saleem MA, van den Heuvel LP, Mathieson PW. Conditionally immortalized human glomerular endothelial cells expressing fenestrations in response to VEGF. Kidney Int. 2006;69:1633–1640. doi: 10.1038/sj.ki.5000277. [DOI] [PubMed] [Google Scholar]
- Shepherd PR, Kahn BB. Glucose transporters and insulin action–implications for insulin resistance and diabetes mellitus. N Engl J Med. 1999;341:248–257. doi: 10.1056/NEJM199907223410406. [DOI] [PubMed] [Google Scholar]
- Tamayo J, Humphris AD, Owen RJ, Miles MJ. High-Q dynamic force microscopy in liquid and its application to living cells. Biophys J. 2001;81:526–537. doi: 10.1016/S0006-3495(01)75719-0. [DOI] [PMC free article] [PubMed] [Google Scholar]
- Tejada T, Catanuto P, Ijaz A, Santos JV, Xia X, Sanchez P, Sanabria N, Lenz O, Elliot SJ, Fornoni A. Failure to phosphorylate AKT in podocytes from mice with early diabetic nephropathy promotes cell death. Kidney Int. 2008;73:1385–1393. doi: 10.1038/ki.2008.109. [DOI] [PubMed] [Google Scholar]
- USRDS Atlas of End-stage Renal disease in the United States N.I.o.H. US Renal Data System, USRDS 2007 Annual Data Report: Atlas of End-Stage Renal Disease in the United States. National Institutes of Health, National Institute of Diabetes and Digestive and Kidney Diseases; Bethesda, MD: 2007. p. 2007. [Google Scholar]
- Vollenbroker B, George B, Wolfgart M, Saleem MA, Pavenstadt H, Weide T. mTOR regulates expression of slit diaphragm proteins and cytoskeleton structure in podocytes. Am J Physiol Renal Physiol. 2009;296:F418–426. doi: 10.1152/ajprenal.90319.2008. [DOI] [PubMed] [Google Scholar]
- Wijsman JH, Jonker RR, Keijzer R, van de Velde CJ, Cornelisse CJ, van Dierendonck JH. A new method to detect apoptosis in paraffin sections: in situ end-labeling of fragmented DNA. J Histochem Cytochem. 1993;41:7–12. doi: 10.1177/41.1.7678025. [DOI] [PubMed] [Google Scholar]
- Wolf G, Chen S, Ziyadeh FN. From the periphery of the glomerular capillary wall toward the center of disease: podocyte injury comes of age in diabetic nephropathy. Diabetes. 2005;54:1626–1634. doi: 10.2337/diabetes.54.6.1626. [DOI] [PubMed] [Google Scholar]
- Wolf G, Ziyadeh FN. Molecular mechanisms of diabetic renal hypertrophy. Kidney Int. 1999;56:393–405. doi: 10.1046/j.1523-1755.1999.00590.x. [DOI] [PubMed] [Google Scholar]
- Yki-Jarvinen H, Koivisto VA. Natural course of insulin resistance in type I diabetes. N Engl J Med. 1986;315:224–230. doi: 10.1056/NEJM198607243150404. [DOI] [PubMed] [Google Scholar]
- Zhang H, Cybulsky AV, Aoudjit L, Zhu J, Li H, Lamarche-Vane N, Takano T. Role of Rho-GTPases in complement-mediated glomerular epithelial cell injury. Am J Physiol Renal Physiol. 2007;293:F148–156. doi: 10.1152/ajprenal.00294.2006. [DOI] [PubMed] [Google Scholar]
- Zhang H, Saha J, Byun J, Schin M, Lorenz M, Kennedy RT, Kretzler M, Feldman EL, Pennathur S, Brosius FC., 3rd Rosiglitazone reduces renal and plasma markers of oxidative injury and reverses urinary metabolite abnormalities in the amelioration of diabetic nephropathy. Am J Physiol Renal Physiol. 2008;295:F1071–1081. doi: 10.1152/ajprenal.90208.2008. [DOI] [PMC free article] [PubMed] [Google Scholar]
- Zimmet P, Alberti KG, Shaw J. Global and societal implications of the diabetes epidemic. Nature. 2001;414:782–787. doi: 10.1038/414782a. [DOI] [PubMed] [Google Scholar]
Associated Data
This section collects any data citations, data availability statements, or supplementary materials included in this article.