

Abstract
Acetyl-L-carnitine (ALCAR) is an endogenous metabolic intermediate that facilitates the influx and efflux of acetyl groups across the mitochondrial inner membrane. Exogenously administered ALCAR has been used as a nutritional supplement and also as an experimental drug with reported neuroprotective properties and effects on brain metabolism. The aim of this study was to determine oxidative metabolism of ALCAR in the immature rat forebrain. Metabolism was studied in 21 day old rat brain at 15, 60 and 120 minutes after an intraperitoneal injection of [2-13C]acetyl-L-carnitine. The amount, pattern, and fractional enrichment of 13C-labeled metabolites were determined by ex vivo 13C-NMR spectroscopy. Metabolism of the acetyl moiety from [2-13C]ALCAR via the tricarboxylic acid (TCA) cycle led to incorporation of label into the C4, C3 and C2 positions of glutamate (GLU), glutamine (GLN) and GABA. Labeling patterns indicated that [2-13C]ALCAR was metabolized by both neurons and glia; however, the percent enrichment was higher in GLN and GABA than in GLU, demonstrating high metabolism in astrocytes and GABAergic neurons. Incorporation of label into the C3 position of alanine, both C3 and C2 of lactate, and the C1 and C5 positions of glutamate and glutamine demonstrated that [2-13C]ALCAR was actively metabolized via the pyruvate recycling pathway. The enrichment of metabolites with 13C from metabolism of ALCAR was highest in alanine C3 (10%) and lactate C3 (9%), with considerable enrichment in GABA C4 (8%), GLN C3 (~4%) and GLN C5 (5%). Overall, our 13C-NMR studies reveal that the acetyl moiety of ALCAR is metabolized for energy in both astrocytes and neurons and the label incorporated into the neurotransmitters glutamate and GABA. Cycling ratios showed prolonged cycling of carbon from the acetyl moiety of ALCAR in the TCA cycle. Labeling of compounds formed from metabolism of [2-13C]ALCAR via the pyruvate recycling pathway was higher than values reported for other precursors and may reflect high activity of this pathway in the developing brain. This is, to our knowledge, the first study to determine the extent and pathways of ALCAR metabolism for energy and neurotransmitter biosynthesis in the brain.
Keywords: acetyl-L-carnitine, immature brain, metabolism, 13C-NMR spectroscopy, glutamate, glutamine, GABA, pyruvate recycling
Introduction
Acetyl-L-carnitine (ALCAR) is an endogenous metabolic intermediate present in the brain and involved in transmitochondrial membrane trafficking of acetyl units for catabolic and anabolic metabolism (Dolezal and Tucek 1981), and buffering the pool of Acetyl CoA (Jones et al.; Miecz et al. 2008). ALCAR is synthesized intramitochondrially in many tissues including brain, liver, heart, kidney, muscle by transferring acetyl groups to carnitine (Jones et al.; Farrell et al. 1986; Rebouche 2004). Serum levels of ALCAR increase during exercise or starvation (Jones et al.; Stephens et al. 2007).
Carnitine and acyl carnitines, including ALCAR, cross the blood-brain barrier primarily via the high affinity, Na+ dependent organic cation/carnitine transporter OCTN2 (SLC22A5) and to a lesser extent via the B(0,+) amino acid transporter (Inano et al. 2003; Nalecz et al. 2004; Miecz et al. 2008). Recent studies have demonstrated that the high affinity OCTN2 and OCTN3 transporters are present on both astrocytes and neurons in suckling and adult brain. (Januszewicz et al.; Januszewicz et al. 2009).
ALCAR has been studied by many groups since numerous reports in the literature show neuroprotective effects of exogenous ALCAR in a variety of neurological disorders (Fiskum et al. 1992; Ishii et al. 2000; Virmani et al. 2001; Calabrese et al. 2005; Zanelli et al. 2005; Calabrese et al. 2008). Exogenously administered ALCAR is rapidly removed from plasma and taken up by many tissues including kidney, gut, heart, brain and liver (Rebouche 2004). ALCAR was taken up in brain within 15 seconds following jugular artery injection in rats (Kido et al. 2001). In PET studies a single injection of [1-11C] or [2-11C]ALCAR was taken up into primate brain within 5 minutes and a high concentration remained in the cortex 60 min later (Kuratsune et al. 1997). Within brain cells ALCAR can be converted via the reversible enzyme reversible carnitine acetyltransferase (EC 2.3.1.7) into acetyl CoA and carnitine without ATP utilization (Ramsay et al. 2001). Thus, ALCAR can serve as a reservoir of the acetyl groups which can be utilized in many pathways including synthesis of lipids, glycogen and acetylcholine (Dolezal and Tucek 1981; Farrell et al. 1986; Aureli et al. 1998; Ricciolini et al. 1998). Ricciolini et al. (Ricciolini et al. 1998) demonstrated that [1-14C]acetyl-L-carnitine injected directly into the lateral ventricle was primarily expired as CO2 and also rapidly incorporated into saturated, monounsaturated and polyunsaturated fatty acids in brain. ALCAR also can supply acetyl groups for the production of the neurotransmitter acetylcholine (Dolezal and Tucek 1981; Ricny et al. 1992).
A number of studies have shown that intravenous ALCAR modulates brain energy metabolism leading to increased cerebral glucose metabolism (CMRglc) in adult rats within 10–30 min of administration (Ori et al. 2002; Freo et al. 2009), and decreased brain lactate after ischemia (Fiskum et al. 1992; Zanelli et al. 2005). Although investigators have proposed that ALCAR stimulates cerebral energy metabolism by providing acetyl CoA as an oxidizable substrate to the TCA cycle (Fiskum et al. 1992; Kuratsune et al. 1997; Zanelli et al. 2005), direct evidence of the metabolism of ALCAR for energy and neurotransmitter synthesis has not been reported. The present study tested the hypothesis that the immature brain is capable of utilizing the acetyl moiety of exogenous [2-13C]acetyl-L-carnitine for both energy metabolism and neurotransmitter biosynthesis.
Materials and Methods
Chemicals
[2-13C]acetyl-L-carnitine 99% 13C enriched, was synthesized by Isotec (Sigma), and generously provided by Sigma Tau, SpA (Pomezia, Italy). The 13C-ALCAR was dissolved in bicarbonate at a concentration of 30 mg/ml and adjusted to pH 7.4.
Animals
This study was approved by the University of Maryland, Baltimore, Animal Care and Use Committee. All care and handling of rats were in compliance with the National Institutes of Health guidelines. Male Sprague–Dawley rats were obtained with the dam from Charles River Laboratories (Wilmington, MA, USA). Immature male rat pups 21–22 days old, weighing 50–60 g were used in all studies.
Rats were given intraperitoneal (i.p.) injections of [2-13C]acetyl-L-carnitine (100mg/kg). Animals were euthanized at 15, 60 and 120 min after injection of 13C-ALCAR. Brains were rapidly removed, and the forebrain snap-frozen in liquid nitrogen. Blood samples (400μl of trunk blood) were obtained from some rats at each time point and also at 5 and 30 min; the plasma was obtained by centrifugation. All samples were stored at −80°C until further processing.
Tissue extraction
Each frozen tissue sample was homogenized in ice-cold 7% perchloric acid (PCA) using a dounce homogenizer (Fisher, Fairlawn, NJ) and extracted as described by Richards et al. (Richards et al. 2007). The supernatants were combined and neutralized with KOH, centrifuged, lyophilized and stored at −20°C. Lyophilized samples were reconstituted in 800 μl of deuterium oxide (D2O) with 0.4% dioxane added as an internal standard for quantification. Samples were adjusted to pH 6.8–7.0, and 0.65 ml was transferred to a 5 mm NMR tube (Wilmad, Buena, NJ, USA).
NMR spectroscopy
Proton-decoupled 125.5-MHz 13C NMR spectra were obtained at the NMR Center, University of Maryland School of Medicine, using a Varian Inova 500 MHz spectrometer with a broad band direct detection probe. 13C-NMR spectra were acquired at ambient temperature using a 35° pulse angle, 25 KHz spectra width, and 64K data points as described by Richards et al. (Richards et al. 2007). Acquisition time of 1.3 seconds and a relaxation delay of 4.3 second were used. The number of scans was typically 11,000–13,000. Plasma samples were run as described by Melo et al. (Melo et al. 2005); however, 55,000 scans were obtained so that 13C-ALCAR or any other 13C-labeled compounds would be detected. All spectra were corrected for nuclear Overhauser effects (NOE) by using correction factors obtained by comparing peak intensities from spectra collected with decoupling throughout the experiment to spectra decoupled only during acquisition as described by Richards et al. (Richards et al. 2007). A line broadening of 5 Hz was used. Dioxane was used as an internal concentration standard for quantification. Chemical shifts are reported relative to the dioxane peak at 67.4 ppm, and peak assignments were made by comparison 13C-labeled standards and to the literature values.
Protein, amino acid and lactate quantification
The protein content of the pellets from the PCA extracts of the brains was determined using the Pierce BCA microreagent assay (Smith et al. 1985). Amino acids were determined with a Biochrom 30 amino acid analyzer. Lactate was determined with a lactate oxidase assay as described in earlier studies (Richards et al. 2007).
Calculations of percent enrichment
The total concentration of lactate or specific amino acids, and the amount of 13C-labeling (corrected for natural abundance) was used to calculate percent enrichment for each isotope isomer of lactate, glutamate, glutamine, GABA or alanine according to the following equation:
It should be noted that this formula actually calculates the “excess enrichment” since enrichment from natural abundance is subtracted. However, we refer to this value as percent enrichment to be consistent with the other study to which our data are compared (Hassel et al. 1995).
Statistical analyses
Data are expressed as mean ± SEM for n = 5 brains at 15 min and 60min, and n = 8 at 120 min. Data were analyzed by one-way ANOVA with p<0.05 as the level of significance, and all pair wise multiple comparisons tested with Tukey’s post hoc test using GraphPad Prism software.
Results
Plasma was extracted at 5, 15, 30, 60 and 120 minutes after intraperitoneal injection to determine how much [2-13C]acetyl-L-carnitine remained in plasma, and if metabolism in peripheral tissues led to labeling of any metabolites. There were only very low amounts of labeled glucose and myoinositol detectable by NMR in plasma at any time after injection of the [2-13C]acetyl-L-carnitine (Supplemental Figure 1). The enrichment of glucose C4 in plasma was 0.16, 0.15, 0.14, and 0.20% at 5, 15, 60 and 120 min, respectively. Enrichment of plasma glucose C1 was 0 at 5 min and less than 0.01% at all other time points. There was no quantifiable enrichment in lactate or alanine in plasma at any time point. These findings are consistent with results from a recent pharmacokinetic study demonstrating that the label from exogenously administered 11C-acetyl-L-carnitine was rapidly removed from plasma and taken up into brain and other tissue (Kuratsune et al. 1997)
Amino acid concentration in brain
The concentrations of the amino acids glutamate, glutamine, GABA, aspartate and alanine in 21–22 day old rat brain were not different at 15, 60 and 120 minutes after i.p. injection of ALCAR (Supplemental Table 1). The concentrations of all amino acids were comparable to values recently reported for 21–22 day old rat brain (Scafidi et al. 2009). The percent enrichment of all isotopomers (isotope isomers) of compounds labeled from metabolism of [2-13C]acetyl-L-carnitine was calculated from the nmol 13C incorporated/mg protein and the amino acid concentration data.
Incorporation of label from [2-13C]acetyl-L-carnitine into metabolites in the immature rat brain
Label from the metabolism of [2-13C]acetyl-L-carnitine was incorporated into glutamate, glutamine, GABA, aspartate, lactate and alanine in 21–22 day old rat brain. A typical 13C-NMR spectrum of metabolites in a perchloric acid extract of brain is shown in Figure 1. At 15 min after i.p. injection of ALCAR incorporation of label into metabolites was observed in the spectra and there was low but detectable enrichment of all amino acids and lactate. In contrast to the labeling with glucose which peaks at 15 min and then declines, the incorporation of label from [2-13C]acetyl-L-carnitine continued to increase over time, with the highest incorporation in many metabolites found at 120 min as described in detail below.
Figure 1.
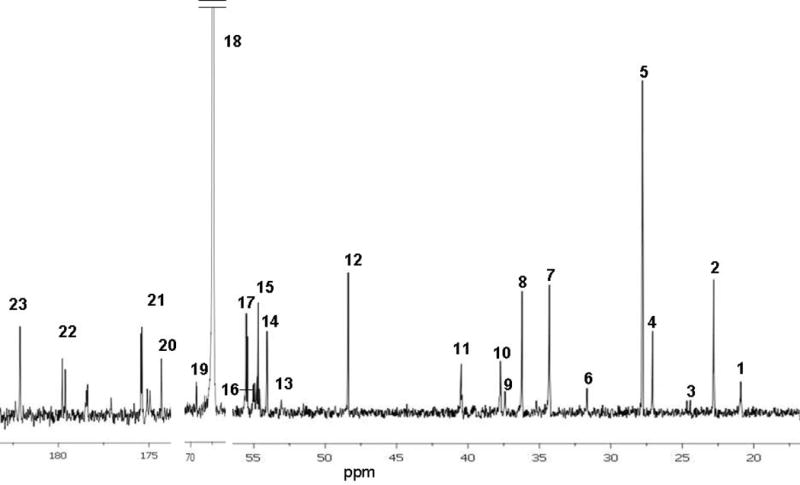
A typical 13C-NMR spectrum of metabolites in brain 120 min after intraperitoneal injection of [2-13C]acetyl-L-carnitine. The numbers for labeled peaks correspond to: 1, Lactate C3; 2, N-acetyl aspartate C6; 3, GABA C3; 4, glutamine C3; 5, glutamate C3; 6, glutamine C4; 7, glutamate C4; 8, GABA C2; 9, taurine C2; 10, aspartate C3; 11, GABA C4; 12, taurine C1; 13, aspartate C2; 14, N-acetyl aspartate C2; 15, creatine C2; 16, glutamine C2; 17, glutamate C2; 18, dioxane (internal standard); 19, lactate C2; 20, glutamine C1; 21, glutamate C1; 22. glutamine C5; 23, glutamate C5. Alanine C3 was observed in some, but not all spectra. Spectrum was obtained as described in methods. Details of the labeling are given in results section.
Labeling pattern from metabolism of [2-13C]acetyl-L-carnitine via the TCA cycle
The labeling pattern from the metabolism of [2-13C]acetyl-L-carnitine is shown in Figure 2 and. the metabolism is described in detail in the figure legend. Briefly, in the mitochondria [2-13C]acetyl-L-carnitine ([2-13C]ALCAR) is converted to [2-13C]acetyl CoA, which condenses with unlabeled oxaloacetate to form citrate which is metabolized via the TCA cycle, giving rise [4-13C]α-ketoglutarate in the first turn. The [4-13C]glutamate formed from α-ketoglutarate can be converted to glutamine, and also to [2-13C]GABA. [4-13C]α-ketoglutarate can remain in the TCA cycle leading to formation of [3-13C]malate and [3-13C]Oxaloacetate, which can be subsequently converted to [3-13C]aspartate (ASP C3). Labeling from randomization, and from subsequent turns of the TCA cycle are described in the legend to figure 2.
Figure 2.

Labeling pattern obtained from the metabolism of [2-13C]acetyl-L-carnitine via the TCA cycle in rat brain. Labeling pattern from the first and “nth” turns of the cycle are shown. Black circles indicate carbons labeled from metabolism in the first turn of the TCA cycle; grey circles are labeled from metabolism in the second and later turns of the TCA cycle. Open circles are carbons that are not labeled from the metabolism of [2-13C]ALCAR via the TCA cycle. [2-13C]acetyl-L-carnitine is converted to [2-13C]acetyl CoA which condenses with unlabeled oxaloacetate to form labeled citrate which is metabolized via the TCA cycle, giving rise [4-13C]α-ketoglutarate in the first turn. [4-13C]α-ketoglutarate can be converted to [4-13C]glutamate (GLU C4), which can be converted to [2-13C]GABA in GABAergic neurons. In astrocytes, [4-13C]Glutamate can be converted to [4-13C]glutamine by the enzyme glutamine synthetase. [4-13C]α-ketoglutarate can remain in the TCA cycle leading to formation of [3-13C]fumarate, which is a symmetrical molecule so randomization of the label occurs leading to some labeling in the 2 position as well. The same labeling pattern occurs in malate. [3-13C]Oxaloacetate and [2-13C]oxaloacetate formed in the first turn of the TCA cycle can be converted to [3-13C]aspartate (ASP C3) and also [2-13C]aspartate (ASP C2). GLN C3 and GLU C3 are formed after metabolism in the second turn of the cycle, and ASP C2 can also be formed. Abbreviations: GLU, glutamate; GLN, glutamine; MAL, malate; OAA, oxaloacetate.
Labeling pattern from recycling of carbons from metabolism of [2-13C]acetyl-L-carnitine via the pyruvate recycling pathway
Since 13C from [2-13C]ALCAR enters the TCA cycle directly at the level of acetyl CoA, 13C-labeling in other metabolites that eventually generate acetyl CoA (i.e. pyruvate, lactate and alanine), can only be formed from further metabolism of the labeled TCA cycle intermediates via the pyruvate recycling pathway, as shown in Figure 3. This pathway involves the conversion of either 13C-malate to pyruvate via malic enzyme, or conversion of 13C-oxaloacetate to pyruvate via the combined action of PEPCK and pyruvate kinase (Cerdan et al. 1990; Kunnecke et al. 1993; Sonnewald et al. 1996; Cruz et al. 1998; Haberg et al. 1998). Pyruvate formed from these TCA cycle intermediates can be converted to lactate or alanine labeled in the C2 and C3 positions (Figure 3). The pyruvate formed from these TCA cycle intermediates can also re-enter the TCA cycle as acetyl CoA labeled in the C1 or C2 position. Metabolism of [2-13C]acetyl CoA formed via pyruvate recycling can not be distinguished from the acetyl CoA formed directly from metabolism of [2-13C]ALCAR. However, the [1-13C]acetyl CoA combines with oxaloacetate to form citrate and leads to formation of [5-13C]glutamate, [5-13C]glutamine and also [1-13C]glutamate, [1-13C]glutamine (Haberg et al. 1998; Olstad et al. 2007).
Figure 3.
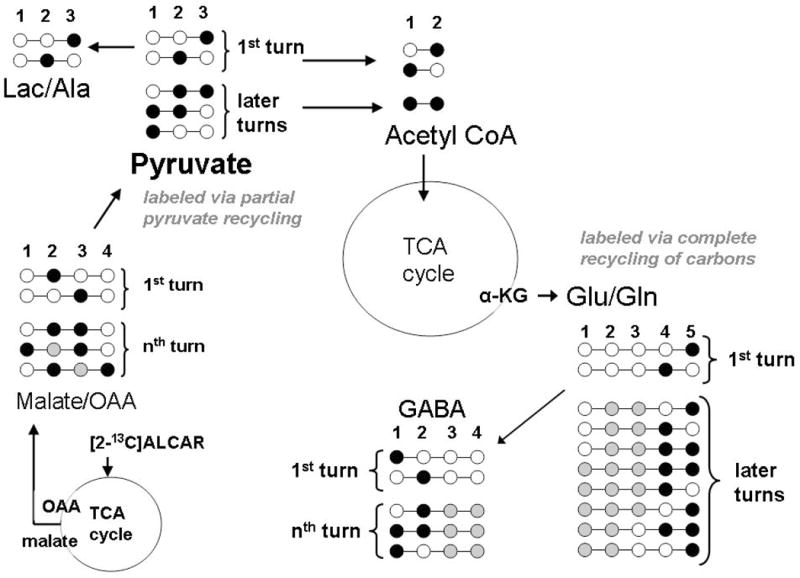
Labeling pattern obtained from the metabolism of [2-13C]ALCAR via the pyruvate recycling pathway in brain. The initial labeling of OAA and malate from metabolism of [2-13C]ALCAR in the TCA cycle is show in the bottom left section of the figure. The [3-13C]malate, [2-13C]malate and [3-13C]oxaloacetate and [2-13C]oxaloacetate formed from metabolism of labeled ALCAR in the TCA cycle are converted to pyruvate via either malic enzyme or the combined action of pyruvate kinase and PEPCK, respectively. The labeled pyruvate formed can be converted to lactate and/or alanine labeled in the C1, C2 or C3 positions (‘partial’ recycling pathway). If ‘complete’ recycling occurs the labeled pyruvate formed is converted to acetyl CoA labeled in the C1 position which condenses with citrate in the TCA cycle and gives rise to [5-13C]–α-ketoglutarate and subsequently GLU C5 and GLN C5. [1-13C]–α-ketoglutarate and GLU C1 and GLN C1 is labeled from further metabolism of the [5-13C]–α-ketoglutarate formed from recycling via subsequent turns of the TCA cycle. Although, pyruvate recycling can give rise to acetyl CoA labeled in the C2 position, it is not possible to distinguish this from the [2-13C]acetyl CoA formed directly from [2-13C]ALCAR.
Temporal course of [2-13C]acetyl-L-carnitine metabolism in brain
At 15 min post injection label was detected in [4-13C]glutamate (GLU C4), [3-13C]glutamate (GLU C3), and [2-13C]glutamate (GLU C2) which are labeled in the first turn (C4) and later turns (C3 and C2) of the TCA cycle. [3-13C]Glutamate was higher than [4-13C]glutamate indicating that metabolism had occurred rapidly and multiple turns of the TCA cycle had taken place at 15 min after injection (Table 1). Incorporation of label into GLU C4 increased over time and was significantly higher at 120 min compared to 15 min. Labeling in GLU C3 tended to increase over time from 15 to 120 min after injection of [2-13C]ALCAR, but was not significantly different from the 15 min time point. This indicates that labeled carbon from metabolism of [2-13C]ALCAR continued to enter the TCA cycle over the two hour period. The fractional enrichment of GLU C4, C3 and C2 in brain was low at 15 min after i.p. injection of [2-13C]ALCAR, but increased with time (Figure 4). The enrichment of these glutamate isotopomers labeled via the TCA cycle ranged from ~0.2–1.8% at 15, 60 and 120 min after i.p. injection of [2-13C]ALCAR (Figure 4).
TABLE 1.
Metabolites labeled via the TCA cycle in extracts of brain from 21–22 day old rats after injection of [2-13C]ALCAR
| nmol 13C incorporated/mg protein# | |||
|---|---|---|---|
| 15 min | 60 min | 120 min | |
| [4-13C]Glutamate | 0.378 ± 0.033** | 0.605 ± 0.056 | 1.045 ± 0.158 |
| [3-13C]Glutamate | 0.544 ± 0.042 | 0.665 ± 0.105 | 1.010 ± 0.141 |
| [2-13C]Glutamate | 0.389 ± 0.067** | 0.513 ± 0.075* | 0.912 ± 0.171 |
| [4-13C]Glutamine | 0.180 ± 0.021** | 0.212 ± 0.053** | 0.477 ± 0.080 |
| [3-13C]Glutamine | 0.278 ± 0.022 | 0.305 ± 0.070 | 0.685 ± 0.091 |
| [2-13C]Glutamine | 0.263 ± 0.035 | 0.535 ± 0.168 | 0.471 ± 0.090 |
| [3-13C]Aspartate | 0.222 ±0.059 | 0.288± 0.142 | 0.486 ±0.104 |
| [2-13C]Aspartate | 0.042 ±0.009** | 0.076± 0.007 | 0.134 ±0.029 |
| [2-13C]GABA | 0.110 ± 0.021 | 0.177 ± 0.085 | 0.141 ± 0.034 |
| [3-13C]GABA | 0.222 ± 0.053 | 0.231 ± 0.065 | 0.371 ± 0.083 |
| [4-13C]GABA | 0.127 ± 0.025*** | 0.230 ± 0.051*** | 0.582 ± 0.093 |
Data were obtained from peak integration of the 13C-NMR spectra as described in Methods. Percent enrichment was calculated from 13C labeling and total concentration as described in methods. Values are mean ± S.E. of data from n = 5 brains at 15 min, n=6 at 60 min, and n = 8 at 120 min. Data were analyzed using one-way ANOVA. Asterisks indicate values that are significantly different from 120 min time point,
p<0.05,
p<0.01
p<0.001.
Figure 4.
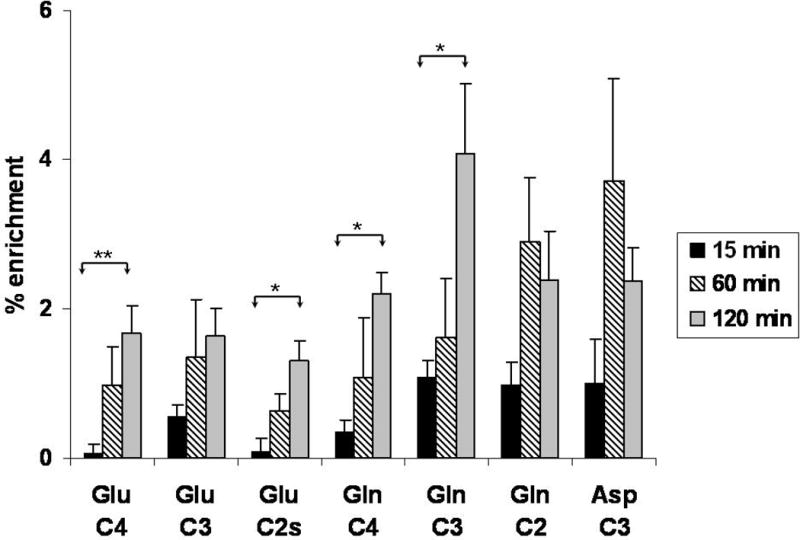
Percent enrichment of glutamate, glutamine and aspartate isotopomers labeled from the metabolism of [2-13C]ALCAR in the TCA cycle in 21 day old rat brain. [4-13C]glutamate (GLU C4), [3-13C]glutamate (GLU C3), and [2-13C]glutamate (GLU C2) are formed from metabolism in the first, second and third turns of the TCA cycle respectively. [4-13C]glutamine (GLN C4), [3-13C]glutamine (GLN C3), and [2-13C]glutamate (GLU C2) are formed from the corresponding glutamate isotopomers. [2-13C]ALCAR was injected intraperitoneally and rats were euthanized at 15, 60 or 120 min after injection. Spectra were obtained on PCA extracts of brain as described in methods. Values are mean ± S.E. of data from n = 5 brains at 15 min, n=6 at 60min, and n = 8 at 120 min. Data were analyzed using one-way ANOVA and Tukey’s post hoc test. Asterisks indicate significant difference between time points, *p<0.05, **p<0.01.
At 15 min post injection label was detected in [4-13C]glutamine (GLN C4), [3-13C]glutamine (GLN C3), and [2-13C]glutamine (GLN C2) in brain (Table 1). These isotopomers can be formed directly from metabolism in the first turn (C4) and later turns (C3 and C2) of the TCA cycle in astrocytes. Alternatively, the labeled glutamine can be synthesized from the corresponding glutamate isotopomers (GLU C4, C3 and C2) that were synthesized in neurons, released, taken up by astrocytes and metabolized via glutamine synthetase. Incorporation of label into GLN C4 and GLN C3 increased over time and was significantly higher at 120 min than at 15 and 60 min. In contrast, incorporation of label into [2-13C]glutamine was not significantly higher at 60 and 120 min. The absolute amount of label (nmol/mg protein) incorporated into C4 and C3 positions of glutamate was higher than the labeling in the C4 and C3 positions of glutamine at corresponding time intervals (15 min, 60 min, 120 min). However, enrichment of GLN C3 and C2 occurred more rapidly than enrichment in glutamate, and tended to be higher ranging from ~0.3–4% (Figure 4). Enrichment in GLN C3 was considerably higher than enrichment of the corresponding glutamate GLU C3 at 120 min. Enrichment in both GLN C4 and C3 were higher at 120 min than at 15 min after injection of [2-13C]ALCAR (Figure 4).
Label from the metabolism of [2-13C]ALCAR was incorporated into [2-13C]GABA, [3-13C]GABA and [4-13C]GABA at 15, 60 and 120 min after injection (Table 1). Labeling in the C4 position of GABA increased significantly over time compared to labeling at 15 min. Labeling in the C2 position of GABA tended to increase over the 2 hour period, but was not significantly different than the 15 and 60 min time points. Enrichment of GABA C2 and C3 ranged from 1–5% at 60 and 120 min (Figure 5). In contrast, the percent enrichment in GABA C4 (labeled from later turns of the TCA cycle when [2-13C]ALCAR is the precursor), although variable, was particularly high reaching 8% at 120 min suggesting active metabolism in GABAergic neurons (Figure 5).
Figure 5.
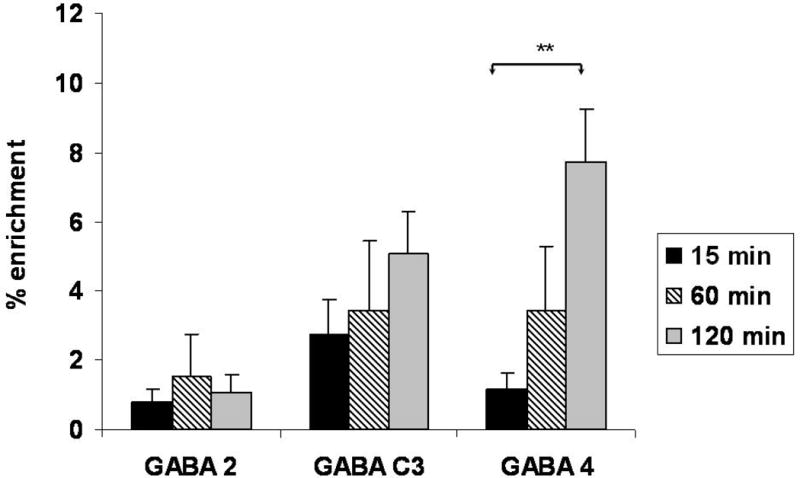
Percent enrichment of isotopomers of GABA labeled from metabolism of [2-13C]ALCAR in 21 day old rat brain at 15, 30 and 60min after i.p. injection. [2-13C]GABA (GABA C2), [3-13C]GABA (GABA C3), and [4-13C]GABA (GABA C4) are formed via the enzyme glutamic acid decarboxylase from GLU C4, GLU C3 and GLU C2, respectively. Labeled carbon from glutamine can also be readily converted to glutamate and incorporated into GABA. Spectra were obtained on PCA extracts of brain as described in methods. Values are mean ± S.E. of data from n = 5 brains at 15 min, n=6 at 60min, and n = 8 at 120 min. Data were analyzed using one-way ANOVA and Tukey’s post hoc test… Asterisks indicate significant difference between time points, **p<0.001
Cycling of 13C-labeled glutamate, glutamine and GABA in the TCA cycle
Cycling ratios, which show the relative amount of labeling from the second turn/labeling in the first turn of the TCA cycle, were calculated for glutamate, glutamine and GABA using the amount of label in GLU C3/GLU C4, GLN C3/GLN C4 and GABA C3/GABA C2 (Qu et al. 2003). The cycling ratio for glutamate tended to be higher at 15 min (1.46 ± 0.13) but was not significantly different than the ratios at 60 or 120 min (Supplemental Table 2). The cycling ratio for glutamine was ~1.5 – 1.6 at all time points, suggesting that labeled glutamine was not lost from the TCA cycle over time. The cycling ratio for GABA was more variable than the ratios for GLU and GLN. However, the ratio for GABA was ~ 1.8–2.8 at all time points, suggesting that label was not lost from GABA over 120 min.
Incorporation of label from [2-13C]ALCAR metabolism into aspartate
Label from the metabolism of [2-13C]ALCAR was incorporated into [3-13C]aspartate and [2-13C]aspartate (Table 1). The C3 and C2 isotopomers of aspartate are formed from metabolism in the first and second turn of the TCA cycle, respectively as shown in Figure 2. Incorporation of label into [3-13C]aspartate was higher than incorporation into [2-13C]aspartate at all time points. There was no significant difference in the amount of label incorporated in aspartate C3 over time; however, the amount of label incorporated into aspartate C2 was increased at 120 min compared to 15 min (p<0.05). This may be due in part to the cycling of label from glutamate metabolism in the TCA cycle as well as labeling from isomerization of labeling in the symmetrical molecule fumarate. The percent enrichment of aspartate C3 in brain ranged from ~1–4% after i.p. injection of [2-13C]ALCAR (Figure 4).
Pyruvate recycling of 13C-labeled metabolites from ALCAR metabolism
In the present study metabolism of [2-13C]ALCAR led to formation of [2-13C]lactate, [3-13C]lactate and [3-13C]alanine at 15, 60 and 120 min (Table 2). As noted above, when [2-13C]ALCAR is the precursor, 13C-lactate and 13C-alanine can only be labeled when metabolites formed in the TCA cycle are further metabolized via the pyruvate recycling pathway (Figure 3). Incorporation of label into 13C-lactate and 13C-alanine was detected at all time points, although labeling in alanine was not detectable in all samples. Labeling in [3-13C]lactate was higher at 120 min that at 15 min (p < 0.01) and at 60 min (p < 0.05). Incorporation of label into [2-13C]lactate was comparable to the labeling of lactate C3 at 15 min and 60 min. The percent enrichment of LAC C3 was ~4–5% at 15 min and 60 min, but increased to ~10% at 120 min (Figure 6). Enrichment in LAC C2 did not change with time and was considerably lower than LAC C3 at 120 min. The absolute amount of label incorporated into ALA C3 was lower than LAC C3 at all time points. Although the percent enrichment of ALA C3 was low (~2%) at 15 min, it increased significantly over time and at 60 and 120 min the enrichment in alanine was ~10–11% (Figure 6).
TABLE 2.
Metabolites labeled via the pyruvate recycling pathway in extracts of brain from 21–22 day old rats after injection of [2-13C]ALCAR
| nmol 13C incorporated/mg protein# | |||
|---|---|---|---|
| 15 min | 60 min | 120 min | |
| [2-13C]Lactate | 0.194 ± 0.019 | 0.360± 0. 119 | 0.369± 0.098 |
| [3-13C]Lactate | 0.218 ± 0.053** | 0.403 ± 0.101* | 0.997 ± 0.179 |
| [3-13C]Alanine | 0.103 ± 0.024 | 0.183± 0.060 | 0.258± 0.052 |
| [5-13C]Glutamate | 0.545 ± 0.063* | 0.581 ± 0.078* | 0.970 ± 0.182 |
| [5-13C]Glutamine | 0.507± 0.037 | 0.569 ± 0.125 | 0.983 ± 0.242 |
| [1-13C]Glutamate | 0.579 ± 0.096** | 0.781 ± 0.074* | 1.417± 0.260 |
| [1-13C]Glutamine | 0.190 ± 0.036* | 0.319 ± 0.086 | 0.490 ± 0.105 |
Data were obtained from peak integration of the 13C-NMR spectra as described in Methods. Percent enrichment was calculated from 13C labeling and total concentration as described in methods. Values are mean ± S.E. of data from n = 5 brains at 15 min, n=6 at 60 min, and n = 8 at 120 min. Data were analyzed using one-way ANOVA. Asterisks indicate values that are significantly different from 120 min time point,
p<0.05,
p<0.01.
Figure 6.

Percent enrichment of compounds labeled from the metabolism of [2-13C]acetyl-L-carnitine via the pyruvate recycling pathway in brain. Labeling in lactate C2 and C3, Alanine C3 and the C1 and C5 positions of glutamate and glutamine occurs only from pyruvate recycling as shown in Figure 3. Spectra were obtained on PCA extracts of brain as described in methods. Values are mean ± S.E. of data from n = 5 brains at 15 min, n=6 at 60min, and n = 8 at 120 min. Data were analyzed using one-way ANOVA and Tukey’s post hoc test. Asterisks indicate significant difference between time points, *p<0.05, **p<0.001.
Metabolism of [2-13C]acetyl-L-carnitine also led to formation of [1-13C]glutamate and [5-13C]glutamate and the corresponding [1-13C]glutamine and [5-13C]glutamine at 15, 60 and 120 min (Table 2). Labeling in the C1 and C5 positions of glutamate and glutamine is further evidence of metabolism via the pyruvate recycling pathway since with [2-13C]ALCAR this is the only pathway for such labeling to occur (Figure 3). Incorporation of label into the C1 position of glutamate was higher than in the C5 position at all time points. Labeling in GLU C1 and GLU C5 increased with time and was significantly higher at 120 min than at 15 min or 60 min (Table 2). Labeling in GLN C1 tended to increase with time and was higher at 120 min than at 15 min (p < 0.05). In contrast to the pattern seen with glutamate, the labeling in GLN C5 was higher than in GLN C1 at all time points. The percent enrichment in GLU C1, GLN C1 and GLU C5 was comparable; however, enrichment in GLN C5 was higher than GLN C1and GLU C1 and C5 at all time points (Figure 6).
Discussion
Rapid metabolism of ALCAR
In the present study label from [2-13C]ALCAR was incorporated into the major neurotransmitters glutamate and GABA in the brains of immature rats within 15 min after i.p. injection. This is consistent with a positron emission tomography (PET) study of 11C-acetyl-L-carnitine that demonstrated rapid clearance of ALCAR from blood and very active uptake into primate brain (Kuratsune et al. 1997). That study also showed that the peak labeling in plasma was at 3 min, and rapidly decreased by ~70 % by 10 min after infusion. Earlier reports demonstrated that following systemic injection of 14C-ALCAR, the label was rapidly removed from plasma and taken up into the liver, heart, brain, kidney and skeletal muscle (Farrell et al. 1986; Aureli et al. 1999; Rebouche 2004). In the present study, following i.p. administration, no compounds labeled from the peripheral metabolism of 13C-ALCAR were observed in plasma at any time point studied (5, 15, 30, 60 and 120 min), suggesting that the 13C-amino acids and lactate detected in the PCA extracts of forebrain were from synthesis within brain tissue.
Metabolism of [2-13C]acetyl-L-carnitine in neurons and astrocytes
Studies from the Nalecz laboratory recently demonstrated that the high affinity Na+-dependant carnitine/acetyl-L-carnitine transporter OCTN2 is abundant on astrocyte endfeet surrounding the endothelial cells of the blood brain barrier (Miecz et al. 2008; Januszewicz et al. 2009). This group also recently reported that both OCTN2 and the sodium-independent high affinity transporter OCTN3 are present on neurons in brain (Januszewicz et al.). Data from the present study demonstrate that [2-13C]ALCAR is metabolized in brain, and the label is rapidly enriched in the C4, C3 and C2 positions of glutamate, glutamine and GABA which increased over time. The higher level of OCTN2 on mitochondria in developing brain, compared to adult brain, would facilitate delivery of ALCAR for metabolism via mitochondrial pathways (Kaminska et al. 1993). The percent enrichment of glutamine isotopomers was higher than enrichment in glutamate suggesting active uptake and metabolism of ALCAR in astrocytes in developing brain.
In the present study both the incorporation of label and enrichment were considerably higher in the C3 position of aspartate compared to aspartate C2 at all times studied. This finding may suggest incomplete randomization of the carbons in the symmetrical fumarate molecule in the latter part of the TCA cycle. The possibility that some of the pyruvate C3 formed via the pyruvate recycling pathway re-entered the TCA cycle via pyruvate carboxylase leading to higher enrichment in oxaloacetate C3 and thus aspartate C3 can not be ruled out. However, electron microscopy studies of aspartate localization in brain show far more immunogold labeled aspartate particles in neuronal elements, particularly in presynaptic glutamatergic and GABAergic nerve terminals, than in astrocytes suggesting that aspartate synthesis occurs primarily in neurons in vivo (Gundersen et al. 2001). The differential labeling of aspartate isotopomers may reflect compartmentation of metabolism in brain.
A number of studies from other groups support the concept that ALCAR either provides energy or interacts with energy metabolism since administration led to increased ATP and phosphocreatine levels (Aureli et al. 1994), increased glycogen (Aureli et al. 1998), and prevented lactic acidosis after ischemia (Fiskum et al. 1992; Rosenthal et al. 1992; Aureli et al. 1994; Zanelli et al. 2005).
Metabolism of [2-13C]ALCAR in GABAergic neurons
Results from the current study show that the percent enrichment of GABA C4 and GABA C3 was considerably higher than enrichment in GLU C2 and GLU C3 at all time points studied. It is well established that the carbon skeleton of glutamine is preferentially incorporated into GABA (Sonnewald et al. 1993; Waagepetersen et al. 1999; Sonnewald and McKenna 2002). The high percent enrichment in GABA may arise from trafficking and further metabolism of the glutamine labeled from [2-13C]ALCAR in astrocytes. However, the finding that the enrichment in GABA C3 and GABA C4 was generally higher than enrichment of glutamine cannot rule out the possibility of selective uptake and direct metabolism of 13C-ALCAR in GABAergic neurons. A number of studies have reported data suggesting that carnitine and/or acetyl-L-carnitine are taken up into brain (Burlina et al. 1989), synaptosomes (Hannuniemi and Kontro 1988), or cortical neurons (Virmani et al. 1994, 1995), in part, by either the GABA transporter, or a by a mechanism that can also transport GABA because of the structural similarity of these compounds. More recent molecular studies support the concept of distinct transporters since uptake of acetyl-L-carnitine via OCTN2 was not inhibited by GABA (Januszewicz et al.; Wawrzenczyk et al. 2001; Januszewicz et al. 2009), and GABA transporters expressed in Xenopus laevis oocytes did not transport carnitine (Wawrzenczyk et al. 2001). However, it should be noted that the relative amount of the high affinity carnitine transporters OCTN2 and OCTN3 on glutamatergic and GABAergic neurons has not been reported but warrants further investigation.
The high percent enrichment of GABA from metabolism of [2-13C]ALCAR was particularly striking and demonstrates prolonged and active incorporation of label from this precursor in GABAergic neurons. GABA can be synthesized directly from glutamate via glutamic acid decarboxylase, or can be formed from astrocyte derived glutamine after extensive cycling of the carbons in the neuronal TCA cycle (Waagepetersen et al. 1999). In the present study it can not be determined if the high enrichment in GABA C4 is from neuronal or glial precursors since the metabolism of [2-13C]ALCAR via the TCA cycle would lead to the same labeling pattern in both astrocytes and neurons. Additionally, the enrichment of GLU C2 and GLN C2, which give rise to labeling in GABA C4, is comparable at both 60 and 120 min. At 120 min 13.9% of the total GABA pool was enriched with 13C from metabolism of ALCAR compared to 9.5% of the total glutamate pool and 16.5% of the total glutamine pool.
Extensive and prolonged cycling of the carbon from [2-13C]acetyl-L-carnitine in the TCA cycle
In the present study metabolism of [2-13C]ALCAR in rat brain led to labeling patterns and cycling ratios that are different from ratios reported for either glucose or acetate metabolism. Hassel et al. (Hassel et al. 1995) reported the time course of labeling from the metabolism of [1-13C]glucose and [2-13C]acetate in brain of adult NMRI mice at 5, 15 and 30 min after injection or infusion of the precursors. They determined that higher labeling was evident at 15 min than at 5 min (Hassel et al. 1995). Both Hassel and our group have reported that when [1-13C]glucose or [1,6-13C]glucose is given as a precursor labeling in glutamate C4 is highest at 15 min and declines at later time points in both rat and mouse brain (Hassel et al. 1995; Scafidi et al. 2009). The cycling ratio GLU C3/C4 reported by Hassel et al. (Hassel et al. 1995) for mouse brain was 0.38 ± 0.02 at 15 min and 0.63 ± 0.09 at 30 min after a single intravenous injection, and similar ratios for glutamine cycling, indicating a relative loss of label from the C4 position with subsequent turns of the TCA cycle. In the present study the cycling ratio for glutamate C3/C4 from ALCAR metabolism was unexpectedly high, with a ratio of 1.46 ± 0.13 at 15 min. This ratio from [2-13C]ALCAR was higher than the rates of 0.97 ± 0.11, and 0.81 ± 0.10 that we recently reported for glutamate cycling from [1,6-13C]glucose metabolism 15 and 30 min in 21 day old rat brain (Scafidi et al. 2009).
The pattern of metabolism and high cycling ratios in the present study are also different than those reported for acetate which is selectively taken up and rapidly metabolized by astrocytes in brain (Hassel et al. 1995; Taylor et al. 1996; Bachelard 1998; Waniewski and Martin 1998, 2004). Cycling ratios reported for metabolism of [2-13C]acetate at 15 and 30 min in adult mouse brain were 0.13 ± 0.02 and 0.33 ± 0.15 for GLN C3/GLN C4 and 0.27 ± 0.05 and 0.55 ± 0.01 for GLU C3/GLU C4 (Hassel et al. 1995). In the present study the cycling ratios of glutamine and GABA were higher than for glutamate and remained essentially constant from 15 to 120 min.
It is interesting to note that an earlier pharmacokinetic study in primates reported that the labeled carbon from the acetyl moiety of [2-11C]acetyl-L-carnitine remained in brain considerably longer than the label from [1-11C]acetyl-L-carnitine (Kuratsune et al. 1997). The authors speculated that the more rapid loss of label from the C1 position of the acetyl moiety reflected metabolism for energy and subsequent loss of 11CO2, whereas the prolonged retention of the label from the C2 position of the acetyl moiety reflected incorporation of the carbon into other compounds in brain including the neurotransmitters acetylcholine, glutamate and GABA. Indeed, the data from the present study clearly demonstrate that the label from the C2 position of the acetyl group from ALCAR is incorporated into neurotransmitters and other brain metabolites for a prolonged period of time (120 min). Our data are consistent with the report by Aureli et al. (Aureli et al. 1998) that a single dose of ALCAR injected 20 min prior to injection of 13C-glucose, had a significant and prolonged effect on brain glucose metabolism leading to decreased overall labeling of amino acids at 15, 30, 45 and 60 min, and increased glycogen content in brain at 60 min. Kido et al. (Kido et al. 2001) reported that that labeling from 3H-ALCAR was still detected at 4 hours following a single injection in adult mouse brain. However, we found no labeled neurotransmitters were detected at 360 min after ALCAR injection (data not shown). In contrast to the prolonged length of time that the label from ALCAR remained in brain, when a low infusion rate of labeled acetate was used (0.5 g/kg/h), brain acetate decreased to undetectable levels in the in vivo spectra within 50 min (Deelchand et al. 2009).
Ricciolini et al. (Ricciolini et al. 1998) demonstrated that 60% of [1-14C]acetyl-L-carnitine injected directly into the lateral ventricle adult rat brain was expired as CO2 and at 1 hr 1.95% was incorporated into brain lipids. Labeling in brain lipids decreased over time (at 3, 6 and 22 hr) suggesting turnover and reutilization of carbons (Ricciolini et al. 1998). Thus the continued increase in labeling of metabolites in the present study may reflect, in part, incorporation of acetate provided by the oxidation of labeled fatty acids. Indeed, it is relevant to note that Ebert et al. (Ebert et al. 2003) determined that when 13C-octanoate was infused in adult rats, oxidation of octanoate contributed ~20 % of the total brain oxidative metabolism.
Metabolism of [2-13C]acetyl-L-carnitine via the pyruvate recycling pathway
Metabolism via the pyruvate recycling pathway in brain in vivo was first reported by Cerdan and coworkers in 1990 (Cerdan et al. 1990; Kunnecke et al. 1993). This pathway uses the TCA cycle intermediates malate or oxaloacetate to form pyruvate which can be converted to lactate and alanine, or can re-enter the TCA cycle providing additional substrate for metabolism leading to formation of glutamate and glutamine. This pathway is considered to be neuroprotective since the pyruvate formed from TCA cycle intermediates can re-enter the TCA cycle condensing with oxaloacetate to form citrate thereby providing substrate for energy metabolism when the formation of pyruvate from glucose metabolism is low (Cerdan et al. 1990; Kunnecke et al. 1993). Although this pathway was first reported to be neuronal (Cerdan et al. 1990; Kunnecke et al. 1993), both the presence and cellular localization of this pathway has been elusive and controversial (Sonnewald et al. 1996; Cruz et al. 1998; Haberg et al. 1998; Pascual et al. 1998; Cruz and Cerdan 1999; McKenna et al. 2000; Waagepetersen et al. 2002). Pyruvate recycling from metabolism of [U-13C]glutamate in primary cultures of mouse astrocytes was reported by Sonnewald and co-workers (Sonnewald et al. 1996; Waagepetersen et al. 2002). More recently, evidence of pyruvate recycling from metabolism of [U-13C]glutamate was detected in cerebellar granule cells (Olstad et al. 2007). Recycling in brain was higher with 3-hydroxybutyrate and acetate as substrates compared to that observed with glucose (Cerdan et al. 1990; Kunnecke et al. 1993; Haberg et al. 1998; Cruz and Cerdan 1999). A number of groups have reported that enzymes involved in the pyruvate recycling pathway are localized in synaptic terminals (Cruz et al. 1998; McKenna et al. 2000).
In the present study the incorporation of label into the C2 and C3 positions of lactate confirms that [2-13C]ALCAR was metabolized via the pyruvate recycling pathway. Incorporation of label into the C1 and C5 positions of glutamate and glutamine demonstrates that complete recycling occurred with re-entry of the labeled pyruvate formed into the TCA cycle. Our data suggest that this pathway is active in both astrocytes and neurons. However, the high enrichment in glutamine C5 and alanine C3 (which is synthesized at a higher rate in cultured astrocytes than neurons) (Westergaard et al. 1993; Bouzier-Sore et al. 2006) could be interpreted as compartmentation of this pathway more in astrocytes than in neurons. The high percent enrichment of alanine C3 and lactate C3 labeled via the pyruvate recycling pathway reflects very active metabolism of ALCAR via this pathway in developing brain. Indeed, the metabolism of [2-13C]ALCAR via the pyruvate recycling pathway is considerably higher than that reported for any other substrate.
Relevance of ALCAR metabolism to neuroprotection
In the present study 13C-ALCAR metabolism was determined in brain of normal 21–22 day old rats. A large number of both clinical and animal studies provide evidence that acetyl-L-carnitine is neuroprotective in adult brain (Zanelli et al. 2005; Calabrese et al. 2008), however the effect of the ALCAR on developing brain has not been previously explored. The beneficial effect of carnitine and L-carnitine supplementation of children with metabolic disorders is well established and is presumably due to facilitation of free fatty acid transport and metabolism (Stanley 2004; Virmani and Binienda 2004). Although L-carnitine has been shown to protect developing brain from cell injury due to hypoxia-ischemia (Wainwright et al. 2003; Wainwright et al. 2006) and subsequent to anesthesia (Zou et al. 2008), the protective effect of ALCAR in immature brain has not been reported. We propose that ALCAR may be a more effective neuroprotective agent than L-carnitine because it provides both carnitine to facilitate fatty acid transport, and an acetyl CoA moiety that can be used for energy by mitochondria.
Our 13C-NMR studies demonstrate that, like substrates including glucose, acetate, and 3-hydroxybutyrate, the acetyl moiety of 13C-ALCAR is used for oxidative energy production and incorporated into the carbon skeleton of the neurotransmitters glutamate and GABA. In contrast to other substrates, metabolism of 13C-ALCAR led to prolonged cycling of carbon from the acetyl moiety in the TCA cycle, which was particularly evident in glutamine and GABA cycling ratios. Our study also revealed particularly active metabolism of carbon from 13C-ALCAR via the pyruvate recycling pathway. Overall, the data provide evidence of considerable compartmentation of ALCAR metabolism in developing brain which may be due in part to a differential distribution and function of the OCTN2 and OCTN3 transporters in brain cells.
Supplementary Material
Acknowledgments
We thank Jennifer Racz for obtaining the blood samples and determining the glucose concentration in plasma. This work was supported in part by NIH Grant P01 HD16596 and the Passano Foundation.
References
- Aureli T, Miccheli A, Di Cocco ME, Ghirardi O, Giuliani A, Ramacci MT, Conti F. Effect of acetyl-L-carnitine on recovery of brain phosphorus metabolites and lactic acid level during reperfusion after cerebral ischemia in the rat–study by 13P- and 1H-NMR spectroscopy. Brain Res. 1994;643:92–99. doi: 10.1016/0006-8993(94)90013-2. [DOI] [PubMed] [Google Scholar]
- Aureli T, Di Cocco ME, Puccetti C, Ricciolini R, Scalibastri M, Miccheli A, Manetti C, Conti F. Acetyl-L-carnitine modulates glucose metabolism and stimulates glycogen synthesis in rat brain. Brain Res. 1998;796:75–81. doi: 10.1016/s0006-8993(98)00319-9. [DOI] [PubMed] [Google Scholar]
- Aureli T, Puccetti C, Di Cocco ME, Arduini A, Ricciolini R, Scalibastri M, Manetti C, Conti F. Entry of [(1,2-13C2)acetyl]-L-carnitine in liver tricarboxylic acid cycle and lipogenesis: a study by 13C NMR spectroscopy in conscious, freely moving rats. Eur J Biochem. 1999;263:287–293. doi: 10.1046/j.1432-1327.1999.00524.x. [DOI] [PubMed] [Google Scholar]
- Bachelard H. Landmarks in the application of 13C-magnetic resonance spectroscopy to studies of neuronal/glial relationships. Dev Neurosci. 1998;20:277–288. doi: 10.1159/000017322. [DOI] [PubMed] [Google Scholar]
- Bouzier-Sore AK, Voisin P, Bouchaud V, Bezancon E, Franconi JM, Pellerin L. Competition between glucose and lactate as oxidative energy substrates in both neurons and astrocytes: a comparative NMR study. Eur J Neurosci. 2006;24:1687–1694. doi: 10.1111/j.1460-9568.2006.05056.x. [DOI] [PubMed] [Google Scholar]
- Burlina AP, Sershen H, Debler EA, Lajtha A. Uptake of acetyl-L-carnitine in the brain. Neurochem Res. 1989;14:489–493. doi: 10.1007/BF00964865. [DOI] [PubMed] [Google Scholar]
- Calabrese V, Ravagna A, Colombrita C, Scapagnini G, Guagliano E, Calvani M, Butterfield DA, Giuffrida Stella AM. Acetylcarnitine induces heme oxygenase in rat astrocytes and protects against oxidative stress: involvement of the transcription factor Nrf2. J Neurosci Res. 2005;79:509–521. doi: 10.1002/jnr.20386. [DOI] [PubMed] [Google Scholar]
- Calabrese V, Cornelius C, Mancuso C, Pennisi G, Calafato S, Bellia F, Bates TE, Giuffrida Stella AM, Schapira T, Dinkova Kostova AT, Rizzarelli E. Cellular stress response: a novel target for chemoprevention and nutritional neuroprotection in aging, neurodegenerative disorders and longevity. Neurochem Res. 2008;33:2444–2471. doi: 10.1007/s11064-008-9775-9. [DOI] [PubMed] [Google Scholar]
- Cerdan S, Kunnecke B, Seelig J. Cerebral metabolism of [1,2-13C2]acetate as detected by in vivo and in vitro 13C NMR. J Biol Chem. 1990;265:12916–12926. [PubMed] [Google Scholar]
- Cruz F, Cerdan S. Quantitative 13C NMR studies of metabolic compartmentation in the adult mammalian brain. NMR Biomed. 1999;12:451–462. doi: 10.1002/(sici)1099-1492(199911)12:7<451::aid-nbm571>3.0.co;2-e. [DOI] [PubMed] [Google Scholar]
- Cruz F, Scott SR, Barroso I, Santisteban P, Cerdan S. Ontogeny and cellular localization of the pyruvate recycling system in rat brain. J Neurochem. 1998;70:2613–2619. doi: 10.1046/j.1471-4159.1998.70062613.x. [DOI] [PubMed] [Google Scholar]
- Deelchand DK, Shestov AA, Koski DM, Ugurbil K, Henry PG. Acetate transport and utilization in the rat brain. J Neurochem. 2009;109(Suppl 1):46–54. doi: 10.1111/j.1471-4159.2009.05895.x. [DOI] [PMC free article] [PubMed] [Google Scholar]
- Dolezal V, Tucek S. Utilization of citrate, acetylcarnitine, acetate, pyruvate and glucose for the synthesis of acetylcholine in rat brain slices. J Neurochem. 1981;36:1323–1330. doi: 10.1111/j.1471-4159.1981.tb00569.x. [DOI] [PubMed] [Google Scholar]
- Ebert D, Haller RG, Walton ME. Energy contribution of octanoate to intact rat brain metabolism measured by 13C nuclear magnetic resonance spectroscopy. J Neurosci. 2003;23:5928–5935. doi: 10.1523/JNEUROSCI.23-13-05928.2003. [DOI] [PMC free article] [PubMed] [Google Scholar]
- Farrell S, Vogel J, Bieber LL. Entry of acetyl-L-carnitine into biosynthetic pathways. Biochim Biophys Acta. 1986;876:175–177. doi: 10.1016/0005-2760(86)90332-2. [DOI] [PubMed] [Google Scholar]
- Fiskum G, Liu Y, Bogaert YE, Rosenthal RE, Krieglstein J, Oberpichler-Schwenk H. Pharmacology of cerebral ischemia 1992. Wissenschaftliche Verlagsgesellschaft mbH; Stuttgart: 1992. Acetyl-l-carnitine stimulates cerebral oxidative metabolism and inhibits protein oxidation following cardiac arrest in dogs; pp. 487–491. [Google Scholar]
- Freo U, Dam M, Ori C. Cerebral metabolic effects of acetyl-l-carnitine in rats during aging. Brain Res. 2009;1259:32–39. doi: 10.1016/j.brainres.2008.12.025. [DOI] [PubMed] [Google Scholar]
- Gundersen V, Fonnum F, Ottersen OP, Storm-Mathisen J. Redistribution of neuroactive amino acids in hippocampus and striatum during hypoglycemia: a quantitative immunogold study. J Cereb Blood Flow Metab. 2001;21:41–51. doi: 10.1097/00004647-200101000-00006. [DOI] [PubMed] [Google Scholar]
- Haberg A, Qu H, Bakken IJ, Sande LM, White LR, Haraldseth O, Unsgard G, Aasly J, Sonnewald U. In vitro and ex vivo 13C-NMR spectroscopy studies of pyruvate recycling in brain. Dev Neurosci. 1998;20:389–398. doi: 10.1159/000017335. [DOI] [PubMed] [Google Scholar]
- Hannuniemi R, Kontro P. L-carnitine uptake by mouse brain synaptosomal preparations: competitive inhibition by GABA. Neurochem Res. 1988;13:317–323. doi: 10.1007/BF00972480. [DOI] [PubMed] [Google Scholar]
- Hassel B, Sonnewald U, Fonnum F. Glial-neuronal interactions as studied by cerebral metabolism of [2-13C]acetate and [1-13C]glucose: an ex vivo 13C NMR spectroscopic study. J Neurochem. 1995;64:2773–2782. doi: 10.1046/j.1471-4159.1995.64062773.x. [DOI] [PubMed] [Google Scholar]
- Inano A, Sai Y, Nikaido H, Hasimoto N, Asano M, Tsuji A, Tamai I. Acetyl-L-carnitine permeability across the blood-brain barrier and involvement of carnitine transporter OCTN2. Biopharm Drug Dispos. 2003;24:357–365. doi: 10.1002/bdd.371. [DOI] [PubMed] [Google Scholar]
- Ishii T, Shimpo Y, Matsuoka Y, Kinoshita K. Anti-apoptotic effect of acetyl-l-carnitine and I-carnitine in primary cultured neurons. Jpn J Pharmacol. 2000;83:119–124. doi: 10.1254/jjp.83.119. [DOI] [PubMed] [Google Scholar]
- Januszewicz E, Bekisz M, Mozrzymas JW, Nalecz KA. High Affinity Carnitine Transporters from OCTN Family in Neural Cells. Neurochem Res. doi: 10.1007/s11064-010-0131-5. [DOI] [PubMed] [Google Scholar]
- Januszewicz E, Pajak B, Gajkowska B, Samluk L, Djavadian RL, Hinton BT, Nalecz KA. Organic cation/carnitine transporter OCTN3 is present in astrocytes and is up-regulated by peroxisome proliferators-activator receptor agonist. Int J Biochem Cell Biol. 2009;41:2599–2609. doi: 10.1016/j.biocel.2009.08.020. [DOI] [PubMed] [Google Scholar]
- Jones LL, McDonald DA, Borum PR. Acylcarnitines: role in brain. Prog Lipid Res. 49:61–75. doi: 10.1016/j.plipres.2009.08.004. [DOI] [PubMed] [Google Scholar]
- Kaminska J, Nalecz KA, Azzi A, Nalecz MJ. Purification of carnitine carrier from rat brain mitochondria. Biochem Mol Biol Int. 1993;29:999–1007. [PubMed] [Google Scholar]
- Kido Y, Tamai I, Ohnari A, Sai Y, Kagami T, Nezu J, Nikaido H, Hashimoto N, Asano M, Tsuji A. Functional relevance of carnitine transporter OCTN2 to brain distribution of L-carnitine and acetyl-L-carnitine across the blood-brain barrier. J Neurochem. 2001;79:959–969. doi: 10.1046/j.1471-4159.2001.00621.x. [DOI] [PubMed] [Google Scholar]
- Kunnecke B, Cerdan S, Seelig J. Cerebral metabolism of [1,2-13C2]glucose and [U-13C4]3-hydroxybutyrate in rat brain as detected by 13C NMR spectroscopy. NMR Biomed. 1993;6:264–277. doi: 10.1002/nbm.1940060406. [DOI] [PubMed] [Google Scholar]
- Kuratsune H, Watanabe Y, Yamaguti K, Jacobsson G, Takahashi M, Machii T, Onoe H, Onoe K, Matsumura K, Valind S, Kitani T, Langstrom B. High uptake of [2-11C]acetyl-L-carnitine into the brain: a PET study. Biochem Biophys Res Commun. 1997;231:488–493. doi: 10.1006/bbrc.1996.5919. [DOI] [PubMed] [Google Scholar]
- McKenna MC, Stevenson JH, Huang X, Tildon JT, Zielke CL, Hopkins IB. Mitochondrial malic enzyme activity is much higher in mitochondria from cortical synaptic terminals compared with mitochondria from primary cultures of cortical neurons or cerebellar granule cells. Neurochem Int. 2000;36:451–459. doi: 10.1016/s0197-0186(99)00148-5. [DOI] [PubMed] [Google Scholar]
- Melo TM, Nehlig A, Sonnewald U. Metabolism is normal in astrocytes in chronically epileptic rats: a (13)C NMR study of neuronal-glial interactions in a model of temporal lobe epilepsy. J Cereb Blood Flow Metab. 2005;25:1254–1264. doi: 10.1038/sj.jcbfm.9600128. [DOI] [PubMed] [Google Scholar]
- Miecz D, Januszewicz E, Czeredys M, Hinton BT, Berezowski V, Cecchelli R, Nalecz KA. Localization of organic cation/carnitine transporter (OCTN2) in cells forming the blood-brain barrier. J Neurochem. 2008;104:113–123. doi: 10.1111/j.1471-4159.2007.05024.x. [DOI] [PubMed] [Google Scholar]
- Nalecz KA, Miecz D, Berezowski V, Cecchelli R. Carnitine: transport and physiological functions in the brain. Mol Aspects Med. 2004;25:551–567. doi: 10.1016/j.mam.2004.06.001. [DOI] [PubMed] [Google Scholar]
- Olstad E, Olsen GM, Qu H, Sonnewald U. Pyruvate recycling in cultured neurons from cerebellum. J Neurosci Res. 2007;85:3318–3325. doi: 10.1002/jnr.21208. [DOI] [PubMed] [Google Scholar]
- Ori C, Freo U, Pizzolato G, Dam M. Effects of acetyl-L-carnitine on regional cerebral glucose metabolism in awake rats. Brain Res. 2002;951:330–335. doi: 10.1016/s0006-8993(02)03290-0. [DOI] [PubMed] [Google Scholar]
- Pascual JM, Carceller F, Roda JM, Cerdan S. Glutamate, glutamine, and GABA as substrates for the neuronal and glial compartments after focal cerebral ischemia in rats. Stroke. 1998;29:1048–1056. doi: 10.1161/01.str.29.5.1048. [DOI] [PubMed] [Google Scholar]
- Qu H, Eloqayli H, Muller B, Aasly J, Sonnewald U. Glial-neuronal interactions following kainate injection in rats. Neurochem Int. 2003;42:101–106. doi: 10.1016/s0197-0186(02)00051-7. [DOI] [PubMed] [Google Scholar]
- Ramsay RR, Gandour RD, van der Leij FR. Molecular enzymology of carnitine transfer and transport. Biochim Biophys Acta. 2001;1546:21–43. doi: 10.1016/s0167-4838(01)00147-9. [DOI] [PubMed] [Google Scholar]
- Rebouche CJ. Kinetics, pharmacokinetics, and regulation of L-carnitine and acetyl-L-carnitine metabolism. Ann N Y Acad Sci. 2004;1033:30–41. doi: 10.1196/annals.1320.003. [DOI] [PubMed] [Google Scholar]
- Ricciolini R, Scalibastri M, Kelleher JK, Carminati P, Calvani M, Arduini A. Role of acetyl-L-carnitine in rat brain lipogenesis: implications for polyunsaturated fatty acid biosynthesis. J Neurochem. 1998;71:2510–2517. doi: 10.1046/j.1471-4159.1998.71062510.x. [DOI] [PubMed] [Google Scholar]
- Richards EM, Fiskum G, Rosenthal RE, Hopkins I, McKenna MC. Hyperoxic reperfusion after global ischemia decreases hippocampal energy metabolism. Stroke. 2007;38:1578–1584. doi: 10.1161/STROKEAHA.106.473967. [DOI] [PMC free article] [PubMed] [Google Scholar]
- Ricny J, Tucek S, Novakova J. Acetylcarnitine, carnitine and glucose diminish the effect of muscarinic antagonist quinuclidinyl benzilate on striatal acetylcholine content. Brain Res. 1992;576:215–219. doi: 10.1016/0006-8993(92)90683-z. [DOI] [PubMed] [Google Scholar]
- Rosenthal RE, Williams R, Bogaert YE, Getson PR, Fiskum G. Prevention of postischemic canine neurological injury through potentiation of brain energy metabolism by acetyl-L-carnitine. Stroke. 1992;23:1312–1317. doi: 10.1161/01.str.23.9.1312. [DOI] [PubMed] [Google Scholar]
- Scafidi S, O’Brien J, Hopkins I, Robertson C, Fiskum G, McKenna M. Delayed cerebral oxidative glucose metabolism after traumatic brain injury in young rats. J Neurochem. 2009;109(Suppl 1):189–197. doi: 10.1111/j.1471-4159.2009.05896.x. [DOI] [PMC free article] [PubMed] [Google Scholar]
- Smith PK, Krohn RI, Hermanson GT, Mallia AK, Gartner FH, Provenzano MD, Fujimoto EK, Goeke NM, Olson BJ, Klenk DC. Measurement of protein using bicinchoninic acid. Anal Biochem. 1985;150:76–85. doi: 10.1016/0003-2697(85)90442-7. [DOI] [PubMed] [Google Scholar]
- Sonnewald U, McKenna M. Metabolic compartmentation in cortical synaptosomes: influence of glucose and preferential incorporation of endogenous glutamate into GABA. Neurochem Res. 2002;27:43–50. doi: 10.1023/a:1014846404492. [DOI] [PubMed] [Google Scholar]
- Sonnewald U, Westergaard N, Schousboe A, Svendsen JS, Unsgard G, Petersen SB. Direct demonstration by [13C]NMR spectroscopy that glutamine from astrocytes is a precursor for GABA synthesis in neurons. Neurochem Int. 1993;22:19–29. doi: 10.1016/0197-0186(93)90064-c. [DOI] [PubMed] [Google Scholar]
- Sonnewald U, Westergaard N, Jones P, Taylor A, Bachelard HS, Schousboe A. Metabolism of [U-13C5] glutamine in cultured astrocytes studied by NMR spectroscopy: first evidence of astrocytic pyruvate recycling. J Neurochem. 1996;67:2566–2572. doi: 10.1046/j.1471-4159.1996.67062566.x. [DOI] [PubMed] [Google Scholar]
- Stanley CA. Carnitine deficiency disorders in children. Ann N Y Acad Sci. 2004;1033:42–51. doi: 10.1196/annals.1320.004. [DOI] [PubMed] [Google Scholar]
- Stephens FB, Constantin-Teodosiu D, Greenhaff PL. New insights concerning the role of carnitine in the regulation of fuel metabolism in skeletal muscle. J Physiol. 2007;581:431–444. doi: 10.1113/jphysiol.2006.125799. [DOI] [PMC free article] [PubMed] [Google Scholar]
- Taylor A, McLean M, Morris P, Bachelard H. Approaches to studies on neuronal/glial relationships by 13C-MRS analysis. Dev Neurosci. 1996;18:434–442. doi: 10.1159/000111438. [DOI] [PubMed] [Google Scholar]
- Virmani A, Binienda Z. Role of carnitine esters in brain neuropathology. Mol Aspects Med. 2004;25:533–549. doi: 10.1016/j.mam.2004.06.003. [DOI] [PubMed] [Google Scholar]
- Virmani MA, Conti R, Spadoni A, Rossi S, Arrigoni-Martelli E. L-carnitine uptake into primary rat cortical cultures: interaction with GABA. Brain Res Mol Brain Res. 1994;25:105–112. doi: 10.1016/0169-328x(94)90284-4. [DOI] [PubMed] [Google Scholar]
- Virmani MA, Conti R, Spadoni A, Rossi S, Arrigoni-Martelli E. Inhibition of L-carnitine uptake into primary rat cortical cell cultures by GABA and GABA uptake blockers. Pharmacol Res. 1995;31:211–215. doi: 10.1016/1043-6618(95)80020-4. [DOI] [PubMed] [Google Scholar]
- Virmani MA, Caso V, Spadoni A, Rossi S, Russo F, Gaetani F. The action of acetyl-L-carnitine on the neurotoxicity evoked by amyloid fragments and peroxide on primary rat cortical neurones. Ann N Y Acad Sci. 2001;939:162–178. doi: 10.1111/j.1749-6632.2001.tb03623.x. [DOI] [PubMed] [Google Scholar]
- Waagepetersen HS, Sonnewald U, Larsson OM, Schousboe A. Synthesis of vesicular GABA from glutamine involves TCA cycle metabolism in neocortical neurons. J Neurosci Res. 1999;57:342–349. [PubMed] [Google Scholar]
- Waagepetersen HS, Qu H, Hertz L, Sonnewald U, Schousboe A. Demonstration of pyruvate recycling in primary cultures of neocortical astrocytes but not in neurons. Neurochem Res. 2002;27:1431–1437. doi: 10.1023/a:1021636102735. [DOI] [PubMed] [Google Scholar]
- Wainwright MS, Mannix MK, Brown J, Stumpf DA. L-carnitine reduces brain injury after hypoxia-ischemia in newborn rats. Pediatr Res. 2003;54:688–695. doi: 10.1203/01.PDR.0000085036.07561.9C. [DOI] [PubMed] [Google Scholar]
- Wainwright MS, Kohli R, Whitington PF, Chace DH. Carnitine treatment inhibits increases in cerebral carnitine esters and glutamate detected by mass spectrometry after hypoxia-ischemia in newborn rats. Stroke. 2006;37:524–530. doi: 10.1161/01.STR.0000198892.15269.f7. [DOI] [PubMed] [Google Scholar]
- Waniewski RA, Martin DL. Preferential utilization of acetate by astrocytes is attributable to transport. J Neurosci. 1998;18:5225–5233. doi: 10.1523/JNEUROSCI.18-14-05225.1998. [DOI] [PMC free article] [PubMed] [Google Scholar]
- Waniewski RA, Martin DL. Astrocytes and synaptosomes transport and metabolize lactate and acetate differently. Neurochem Res. 2004;29:209–217. doi: 10.1023/b:nere.0000010450.21586.a6. [DOI] [PubMed] [Google Scholar]
- Wawrzenczyk A, Sacher A, Mac M, Nalecz MJ, Nalecz KA. Transport of L-carnitine in isolated cerebral cortex neurons. Eur J Biochem. 2001;268:2091–2098. doi: 10.1046/j.1432-1327.2001.02087.x. [DOI] [PubMed] [Google Scholar]
- Westergaard N, Varming T, Peng L, Sonnewald U, Hertz L, Schousboe A. Uptake, release, and metabolism of alanine in neurons and astrocytes in primary cultures. J Neurosci Res. 1993;35:540–545. doi: 10.1002/jnr.490350510. [DOI] [PubMed] [Google Scholar]
- Zanelli SA, Solenski NJ, Rosenthal RE, Fiskum G. Mechanisms of Ischemic Neuroprotection by Acetyl-l-carnitine. Ann N Y Acad Sci. 2005;1053:153–161. doi: 10.1196/annals.1344.013. [DOI] [PMC free article] [PubMed] [Google Scholar]
- Zou X, Sadovova N, Patterson TA, Divine RL, Hotchkiss CE, Ali SF, Hanig JP, Paule MG, Slikker W, Jr, Wang C. The effects of L-carnitine on the combination of, inhalation anesthetic-induced developmental, neuronal apoptosis in the rat frontal cortex. Neuroscience. 2008;151:1053–1065. doi: 10.1016/j.neuroscience.2007.12.013. [DOI] [PubMed] [Google Scholar]
Associated Data
This section collects any data citations, data availability statements, or supplementary materials included in this article.