

Abstract
A recently proposed pathway for heme b biosynthesis, common to diverse bacteria, has the conversion of two of the four propionates on coproheme III to vinyl groups as its final step. This reaction is catalyzed in a cofactor-independent, H2O2-dependent manner by the enzyme HemQ. Using the HemQ from Staphylococcus aureus (SaHemQ) the initial decarboxylation step was observed to rapidly and obligately yield the three-propionate harderoheme isomer III as the intermediate, while the slower second decarboxylation appeared to control the overall rate. Both synthetic harderoheme isomers III and IV reacted when bound to HemQ, the former more slowly than the latter. While H2O2 is the assumed biological oxidant, either H2O2 or peracetic acid yielded the same intermediates and products, though significantly greater than the expected two equivalents were required in both cases and peracetic acid reacted faster. The ability of peracetic acid to substitute for H2O2 suggests that, despite the lack of catalytic residues conventionally present in heme peroxidase active sites, reaction pathways involving high valent iron intermediates cannot be ruled out.
Keywords: heme, peroxidase, decarboxylase, chlorite dismutase, Staphylococcus aureus
Graphical abstract

Heme, the complex of protoporphyrin IX with iron, is fundamentally important for life. A diverse set of metal-chelating cofactors including F430 (Ni), vitamin B12 (Co), siroheme (Fe,S), and chlorophyll (Mg) additionally share a common tetrapyrrole scaffold and hence biosynthetic and evolutionary roots with heme. In humans and other eukaryotes, the biosynthesis of chemically unfunctionalized heme b occurs via 8 well-known enzymatic steps.1,2 A little more than a decade ago, however, a manual survey of the available prokaryotic genomes indicated that genes encoding many of these steps were absent from diverse species, suggesting the evolutionary history of the pathway may be complex.3
Sophisticated bioinformatics methods and a substantially expanded pool of genomic data in conjunction with experimental approaches have since allowed many holes in the pathways to heme and related tetrapyrrole cofactors to be filled (Scheme 1). A complete route to heme biosynthesis in Archaea and sulfate-reducing bacteria has been identified.4 Recently, a new ending for the pathway in gram-positive bacteria from the Actinobacteria and Firmicutes phyla – a large group of organisms characterized by their lack of an outer membrane – was proposed.5 This and the canonical pathway effect the same three chemical transformations on the metabolic intermediate coproporphyrinogen III. However, the reactions in the two pathways occur in a different order, yield distinct intermediates, and invoke distinct enzymes for the oxidative decarboxylation step.5
Scheme 1. Biosynthetic pathways leading to heme and other tetrapyrroles†.

†The genes encoding catalysts for the canonical steps common to eukaryotes and many gram-negative bacteria are designated in blue. The pathway used by Archaea and sulfur-reducing bacteria are in orange.4 The recently proposed terminus of the pathway, found in gram-positive members of Actinobacteria and Firmicutes, is shown in purple.5 Note that HemF or HemN can catalyze the indicated step in different organisms under aerobic and anaerobic conditions, respectively. Similarly, HemJ, G, or Y catalyze the removal of 2 H-atoms ([H]).
In the gram-positive bacteria, this step occurs at the terminus of the pathway, after a step analogous to the well-known ferrochelatase reaction.6 It is catalyzed by HemQ, an enzyme which uses coproheme III as both substrate and cofactor in the H2O2-dependent oxidative decarboxylation of the propionate side chains at β-pyrrole positions 2 and 4 (Scheme 2).6 Cofactor-independent, O2-dependent enzymes have been described, including coproporphyrinogen III oxidase (HemF).7,8 However, this is to our knowledge the first example of a cofactor-independent transformation involving H2O2. In contrast with coproporphyrinogen III, the metallosubstrate used by HemQ offers the possibility of mechanistically distinct, iron-mediated activation of H2O2 for the oxidative decarboxylation step. Interestingly, the conversion of coproheme to heme b is also catalyzed anaerobically by AhbD, a radical S-adenosyl-methionine- and iron sulfur cluster-dependent enzyme at the terminus of the biosynthetic pathway in Archaea and sulfate-reducing bacteria (Scheme 1).4,9 Homologs are also found in some gram-positive and possibly other bacteria along with hemQ genes, affording a possible anaerobic alternative for this step.
Scheme 2. Substrate, possible intermediates, and product of the HemQ-catalyzed reaction.‡.

‡Heme rings are labeled A-D and substituted pyrrole carbons 1-8. Vinyl and propionate carbons are labeled a-d.
HemQs are part of the chlorite dismutase family (Clds, Pfam 06778).10,11 This family is best known for the minority of its members that use heme b to catalytically convert ClO2− to Cl− and O2 at the terminus of perchlorate respiratory pathways.12 The reaction of HemQs, by contrast, has not been well studied. It has been previously shown that HemQ is not highly active toward H2O2 in its heme b-bound form, but instead fairly readily undergoes heme degradation.9 Further, in its ferric coproheme III bound state, the HemQ from Mycobacterium tuberculosis was shown to react with H2O2 rather than various O2/reductant combinations, fully converting coproheme III to heme b.5
Here, using the enzyme from Staphylococcus aureus (SaHemQ), we sought to identify the likely tetrapyrrole-intermediates on the reaction pathway in order to narrow down the possible reaction mechanisms. We aimed to determine whether the reactions with the propionates occur in an ordered fashion and with what time course, and whether a specific three-propionate harderoheme isomer could be identified as a reaction intermediate. Finally, in order to set limits on possible iron-intermediates, we examined whether the same intermediates and products would be generated with organic peroxides and peracids and to establish the stoichiometry of the reaction in each case.
EXPERIMENTAL METHODS
Reagents and stocks
Ferric coproporphyrin III chloride (coproheme III, Frontier Scientific) and hemin chloride (Sigma) were obtained in 10 mg ampules and used to generate 5-10 mM stock solutions in dimethylsulfoxide (DMSO). Harderohemes III and IV prepared in house were rigorously dried in tared glass ampules and weighed on an analytical balance. 5 mM stocks were prepared in DMSO in the ampules based on the measured masses.
Hydrogen peroxide (H2O2), tert-butyl-peroxide, meta-chloroperbenzoic acid (mCPBA) and peracetic acid stock solutions were prepared at 100 µM concentrations in 50 mM potassium phosphate (KPi) buffer, pH 7.4. H2O2 concentrations were ascertained by titration with freshly prepared 0.02 M KMnO4 under acidic conditions (concentrated H2SO4). Titrations were monitored for loss of the characteristic pink color of permanganate as it is reduced to the nearly colorless Mn2+ ion. Peracetic acid stocks were analyzed with MQuant Peracetic acid test strips (EMD Millipore).
Biochemicals (lysozyme, catalase, DNAse, etc.) were purchased from New England Biolabs. Reagents and media for bacterial growth, protein purification, and analysis were obtained from Fisher or GE Healthcare and used without further purification.
Synthesis and purification of harderoheme isomers III and IV
Harderoporphyrin trimethyl esters were prepared as previously described,7, 8 then metallated in a solution of acetic acid/2% pyridine under argon. The resulting harderohemes were saponified using NaOH and analyzed by high pressure liquid chromatography (HPLC) coupled to electrospray time of flight mass spectrometry (ESI-MS). See Supplementary Information and Scheme 1S for synthetic and related analytical details.
Expression and purification of SaHemQ bound to substrate and potential intermediates
SaHemQ protein expression and purification were carried out as previously described.9 (See Supplementary Information.) The protein was incubated at 4°C for 12-24h with ferric coproheme III or harderoheme [isomer III or IV] in an approximate 1:1 (protein monomer:heme) ratio, based on the protein concentration estimated by the Bradford assay and SDS-PAGE. To remove unbound substrate and further purify the protein, coproheme-bound SaHemQ was concentrated to 5 mL and loaded onto an S-200 Sephacryl gel filtration column (run at 0.4 mL/min in 50 mM KPi buffer, pH 7.4). Fractions were collected using an AKTA Purification System. Fractions with an Rz ≥ 0.5 were pooled (Rz = AbsorbanceSoret/Absorbance280), concentrated, flash frozen, and stored at -80°C. A PD-10 desalting column (GE Healthcare) was used to remove unbound harderoheme from the protein before concentration and storage.
Extinction coefficients for the coproheme III- and heme b-bound SaHemQ at the Soret absorbance band maxima (εSoret) were determined by the pyridine hemochrome assay.13 Briefly, 200 μL of heme-containing solution was mixed with 800 μL of 50 mM NaOH containing 20% pyridine by volume. 3 μL 0.1 M K3[Fe(CN)6] were added and the oxidized spectrum measured. 3-5 mg of solid Na2S2O4 were then added to obtain the spectra of the reduced pyridine-bound hemes. Difference spectra (reduced minus oxidized) are reported. Changes in absorbance at observed λmax values were plotted against [heme] and the data fit to a line from which extinction coefficients were obtained. Protein-bound hemes were released by suspension in 50 mM NaOH/20% pyridine and their pyridine hemochrome spectra obtained similarly. Beer’s law was used to estimate ε at the UV/visible absorbance maximum for the protein-associated coproheme III or heme b (Soret band λmax).
UV/visible and resonance Raman (rR) spectroscopy
UV/vis spectra were measured on a temperature-controlled Cary60 instrument in scanning mode at 20 °C. Samples contained 15-35 μM SaHemQ-coproheme (III) monomer in 50 mM KPi buffer, pH 7.4. Resonance Raman scattering was excited with 406.7-nm emission from a Kr+ laser. The laser beam was focused to a line parallel to the spectrograph entrance slit. Scattered light was collected in the 135° backscattering geometry (f/1) passed through a polarization filter, holographic notch filter and polarization scrambler. The laser image was then focused on the entrance slit of a 0.67-m, f/4.7 Czerny-Turner spectrograph fitted with 1200 and 2400 g/mm gratings and a LN2-cooled CCD detector (1340×400 array of 20×20 μm pixels, 26.8×8.0 mm2 image area). The spectrometer was calibrated against Raman shifts of toluene, dimethylformamide, acetone, and methylene bromide. Spectra were recorded at ambient temperature from samples prepared at 10-20 μM SaHemQ-coproheme III monomer in 50 mM KPi in spinning 5 mm NMR tubes. UV/vis absorbance spectra were recorded from the rR samples before and after spectral acquisition to assess whether sample integrity had been compromised by exposure to the laser beam. Laser power at the samples ranged from 5 to 10 mW; no spectral artifacts due to photoinduced chemistry were observed at these powers.
Real-time monitoring of reactions
Solutions of SaHemQ in complex with coproheme III or harderoheme III/IV (5-10 μM) in 50 mM Kpi (pH 7.4) were manually mixed with oxidant from a freshly made and titrated stock (H2O2, peracetic acid, mCPBA, t-butyl hydroperoxide). UV/vis spectra were scanned every 0.25-0.5 min. Absorbances at a given wavelength were plotted versus time, then fit by least squares regression to single exponential curves using KaleidaGraph. Rate constants are averages of 3 measurements (error = standard deviation). Resonance Raman spectra were acquired at 30 s intervals with 406.7 nm excitation. Reactions were carried out in 5-mm spinning NMR tubes at 20 ºC. Difference spectra were generated by subtraction of the starting SaHemQ-coproheme III spectrum from that at each reaction time.
For discontinuous kinetic analyses, 10 μM SaHemQ-coproheme III complex was mixed with oxidant in a 1 mL reaction mixture and aliquots removed and quenched with 10 mM aqueous KCN (1:1 v/v ratio) every 0.3 min. The quenching solution was sufficient to completely inhibit the enzymatic reaction. The heme content of quenched samples was quantitatively analyzed by HPLC (below).
Product analyses by pyridine hemochrome assay, HPLC, and MS
Pyridine-hemochrome spectra were measured as described above. HPLC analyses were carried out using an Agilent 1100 series system with diode array UV/vis detection (300-700 nm). 25-50 µL aliquots of analyte were injected into a Phenomenex Luna 3c C18 (2) column (150 x 4.6 mm) at a flow rate of 0.9 mL/min, 45° C. Solvent A was 1M ammonium acetate + 10% acetonitrile; solvent B was methanol + 10% acetonitrile. Elution followed a linear gradient from 35-95% B over 15 min. The column was washed with 95% B (2 min) and equilibrated with 35% (6 min) between runs.14
Standards in 50 mM KPi, pH 7.4, were suspended 1:1 (v/v) in a 65:35 mixture of solvents A and B. For analysis of products, the same solvent was added 1:1 (v/v) to reaction mixtures (100 µL, 10 μM protein subunit). Precipitated protein was removed by centrifugation and supernatant was loaded into the column. Integration of the resulting peaks (400 nm) was used for construction of standard curves and quantification of the respective heme. Due to limited availability of and small impurities (<15%) in the harderoheme standards, these were not explicitly quantified; rather, integrated peak intensities from HPLC traces are reported. The exact masses of intermediates and products were verified using ESI-MS carried out on an Agilent 6538 Q-TOF instrument with dual-ESI source (resolution approximately 20,000; accuracy 1 ppm). Source parameters: drying gas 12 L/min, nebulizer 60 psi, capillary voltage 3500 V, capillary exit 120 V. Spectra were collected in positive mode from 50 to 1000 m/z at a rate of 1 Hz.
RESULTS
Characterization of SaHemQ bound to substrate, product, and potential intermediates
Pure SaHemQ was obtained in yields of 15-20 mg per L of culture. Distinct UV/vis spectra for the protein reconstituted with coproheme III, harderohemes III/IV, and heme b are shown in Figure 1A. SaHemQ in complex with coproheme III has a slightly asymmetric Soret band with a maximum absorbance at 394 nm. Asymmetry may be due to partial conversion of coproheme III to harderoheme inside the protein environment even without the addition of an oxidant, as indicated by HPLC and MS of the SaHemQ-coproheme III complex (see below).
Figure 1. Characteristic spectra of SaHemQ in complex with hemes.
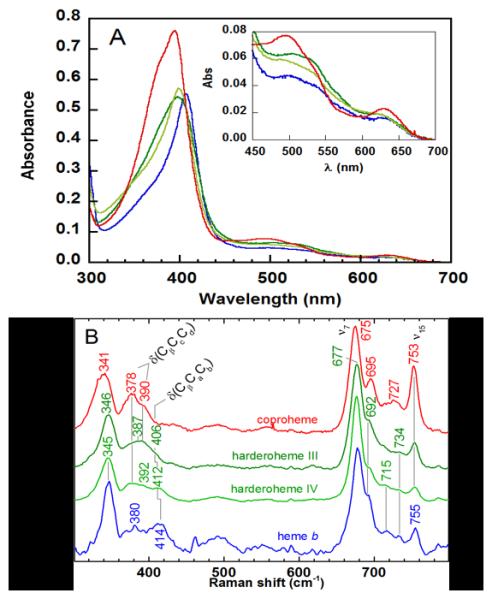
(A) UV/vis spectra of SaHemQ in complex with ferric coproheme III (red), harderohemes III and IV (dark and light green, respectively), and heme b (blue) (5 µM coproheme, 10 µM harderoheme isomers and heme, 50 mM KPi, pH 7.4). The inset shows the visible bands on an expanded scale. (B) Low frequency rR spectra of SaHemQ in complex with the various hemes are shown in the same colors as in A. Spectra were obtained with 406.7 nm excitation of 20 µM samples in 50 mM NaPi, pH 6.8; the propionate and vinyl bending modes are labeled.
Values for absorption maxima and spectral extinction coefficients have been previously reported for the pyridine hemochrome of heme b (λmax = 556 nm; ε556 = 33.3 mM−1cm−1) and coproheme III (λmax = 546 nm; ε546 = 32.2 mM−1cm−1).13 Pyridine hemochrome absorption maxima for the harderohemes III and IV were both at 549 nm (Figure S1A). Overlap in the pyridine hemochrome spectra for coproheme III and the harderohemes suggested that their separation and analysis by HPLC would be essential. Distinct HPLC retention times for all 4 hemes were obtained with the method described above (Figure S1B).
Using the pyridine hemochrome assay to quantify released coproheme III, εSoret for the SaHemQ-coproheme III complex was determined to be 139.9 ± 3.0 mM−1 cm−1. Visible α/β and charge transfer (CT) bands occurred at 497/533 and 630 nm. The spectrum for SaHemQ-heme b measured here was consistent with previously reported data.9 An extinction coefficient for the Soret band maximum at 406 nm was determined: ε = 76.6 mM−1 cm−1 Visible bands were recorded at: 510/527 nm (α/β), 630 nm (CT). Absorbance maxima for SaHemQ-harderoheme III were: 396 nm (Soret), 495/533 nm (α/β), 610 nm (CT); for SaHemQ-harderoheme (IV): 398 nm (Soret), 490/530 nm (α/β), 610 nm (CT). Notably, the increasingly red-shifted Soret peak maxima for the SaHemQ complexes with substrate, intermediate(s), and product are distinct.
The low frequency rR spectra of SaHemQ complexed with coproheme III, harderohemes III/IV, and heme b are shown in Figure 1B; modes involving motions of the propionate and vinyl substituents of the various hemes are observed in this low-wavenumber region. In addition to distortions of the propionate or vinyl groups, it has been demonstrated that movement of the methyl and core atoms of the porphyrin are also involved; thus they actually occur along with pyrrole ring deformations in these modes.15 Nevertheless, for the purposes of this discussion, they will be termed propionate (δ(CβCcCd)) and vinyl (δ(CβCaCb)) bending.
Bands due to propionate bending modes were identifiable in all four spectra between 378 and 390 cm−1. The four propionate groups on coproheme III present as a broad envelope with peaks at 378 and 390 cm−1 in the SaHemQ complex. The three propionate groups in SaHemQ-harderoheme III give rise to an even less defined feature, a broad band centered at 387 cm−1. The two broad features assigned to propionate modes for SaHemQ-harderoheme IV (378 and 392 cm−1) are similar in frequency to those of the coproheme complex. In the case of heme b, the single band at 380 cm−1 is assigned to a propionate bending mode for its two propionate groups. Bands associated with vinyl bending motions appear in the harderoheme and heme b spectra between 400 and 420 cm−1; notably, these bands are absent from the SaHemQ-coproheme III spectrum. Single δ(CβCaCb) bands are observed at 406 and 412 cm−1 for harderohemes III and IV, respectively. While two vinyl bending bands are observed for some heme proteins, such as myoglobin, only a single feature at 414 cm−1 is observed for SaHemQ-heme b.16,17
The high-frequency rR spectra of hemes comprise a rich array of bands that yield insight into both structural and electronic aspects of these macrocyclic complexes. Soret-excited rR spectra are dominated by bands arising from totally symmetric (A1g in D4h) in-plane skeletal modes (ν2, ν3, and ν4).16 Additionally, bands assigned to the non-totally symmetric B1g and B2g (D4h) modes, ν10, ν11, ν12, and ν28, commonly appear in the B-excited spectra due to the dynamic Jahn-Teller effect.18 The frequencies of all these modes are sensitive to the porphyrin core size, which is responsive to metal ion radius and the position of the metal ion with respect to the 4-Npyrrole plane. These metal ion parameters are functions of oxidation and spin state, and coordination number. Additionally, Soret-excited high-frequency spectra exhibit bands assigned to modes involving distortions along local vinyl coordinates. These include =CbH2 and –CaH= out-of-plane wags (γ=CbH2 , γCaH=) and in-plane bends (δ=CbH2, δCaH=), which appear between 900 and 1300 cm–1 (see labelling scheme in Figure 2B).17 Finally, bands arising from νCa=Cb, the vinyl C=C stretching mode, typically appear between 1615 and 1635 cm–1. In proteins, heme b can exhibit two νCa=Cb frequencies, likely due to the 2- and 4-vinyl groups having different dihedral angles with respect to the mean porphyrin plane.19 Although frequencies of the in-plane skeletal bands are only slightly sensitive to oxidative decarboxylation of the 2- and 4-propionate groups of coproheme III, their intensities and the intensities of the aforementioned 2- and 4-vinyl bands facilitate tracking the appearance of the vinyl groups during the HemQ-catalyzed oxidative decarboxylation of coproheme III.
Figure 2. Spectroscopic changes upon titration of the SaHemQ-coproheme III complex with H2O2.

Reactions were monitored by (A) UV/vis spectra following the addition of 0-10 eq H2O2 (2 eq increments) to 5 μM SaHemQ-coproheme III, 50 mM KPi, pH 7.4. The lack of clean isosbestic points through most of the spectrum is consistent with the involvement of more than two heme complexes in the reaction. (B) Low-frequency rR spectral titration of 15 mM SaHemQ-coproheme III under the same buffer conditions as A with 406.7-nm excitation. The labeling scheme used to describe the band labels in panels B and C and throughout the narrative is found in Scheme 1. (C) High-frequency range of the rR spectra shown in B. Molar equivalents of H2O2 are marked on the respective difference spectra. For A, B and C, spectra of the SaHemQ-coproheme III complexes are in red. Partially decarboxylated species are in purple with the final spectrum [λmax (Soret) = 406 nm)] in blue. The difference spectra in B and C were generated by subtracting the spectrum of SaHemQ-coproheme III from the spectrum of the equilibrium reaction mixture recorded with the indicated molar eq of H2O2.
Titrimetric reactions between SaHemQ-coproheme III and H2O2
The conversion of a propionate substituent to a vinyl group plus CO2 is a net two electron oxidation. Thus, it was expected that two molecules of H2O2 (one per reactive propionate) would be required for the complete conversion of coproheme III to heme b. It was further anticipated that addition of fewer than 2 molar equivalents of H2O2 would result in the accumulation of a singly decarboxylated intermediate. However, UV/vis and rR tracking of reactions between SaHemQ-coproheme III following titrimetric additions of H2O2 (Figure 2A-B) revealed only partial conversion of the coproheme III complex to the heme b complex with < 10 molar equivalents of H2O2. Indeed, ten eq were required to affect the complete shift of the UV/vis Soret band from 394 nm (SaHemQ-coproheme III) to 406 nm (SaHemQ-heme b). UV-visible and rR spectral changes were the same whether the 10-eq of H2O2 were added at once or in titrimetric increments.
Direct observation of H2O2-mediated vinyl group formation was possible by monitoring the SaHemQ-coproheme III titration by rR (Figure 2B). Appearance of a vinyl bending band at 416 cm−1 with diminution in the intensity of the propionate bending bands between 378 and 390 cm−1 is consistent with the expected oxidative decarboxylation reaction. Other features typically assigned to vibrations involving the porphyrin pyrrole rings also track the extent of oxidative decarboxylation, including: the increase in ν7 (pyrrole deformation mode), ν8 (Fe−Npyrrole stretch), and ν11 (pyrrole asymmetric folding mode) intensities and the loss in intensity of ν15 and ν5 (pyrrole symmetric fold).20-24 These observations are consistent with changes occurring upon oxidative decarboxylation of propionate groups to yield vinyl substituents.
As the buildup of harderoheme was not clear in the parent rR spectra recorded with intermediate H2O2 stoichiometries, rR difference spectra were examined. At each point in the rR titration with H2O2, a single, broad band at 416 cm−1 was observed, consistent with appearance of one or more modes having vinyl bending (δCβCaCb) character. Given that the vinyl bending bands in the spectra of the coproheme III, harderoheme, and heme b complexes of SaHemQ (Figure 1B) are broad and within 8 cm−1 of one another, they likely fall within the observed 416-cm−1 difference envelope. However, when difference spectra generated by subtraction of the SaHemQ-coproheme III spectrum from those of HemQ constituted with harderohemes (Figure S2) are compared to those observed during the reaction, the multiple features of both harderoheme spectra in this frequency range (Figure 1B) are absent. This suggests that either the SaHemQ-harderoheme complex generated via the enzymatic reaction differs from the reconstituted complex in its vinyl conformation, or the harderoheme complex does not build up to a concentration that is directly detectable by these rR bands during the reaction. The latter interpretation turns out to be most consistent with the data (vide infra).
The high-frequency rR spectra also proved sensitive to structural changes brought on by the oxidative decarboxylation of SaHemQ-coproheme III. Like the low-frequency spectra, the parent and difference spectra in Figure 2C can be explained largely in terms of band intensity changes, including the small apparent shifts near 1575- and 1628-cm−1, which are likely due to changes in relative intensities of overlapping bands in those regions of the spectrum. Changes in the parent and difference spectra are monotonic with sequential additions of H2O2. Changes in the ν2, ν3, and ν4 intensities are largely attributed to changes in their resonance enhancements during the reaction. The increase in resonance enhancement of rR scattering by the skeletal modes is attributed to the red-shifted Soret-band maximum as the constellation of peripheral substituents changes from all aliphatic ring-adjacent methyl and methylene groups to partially olefinic as the 2- and 4-vinyl groups are produced. The ν2 region of the difference spectra results from small changes in the frequency and substantial changes in the intensity of this mode as the heme speciation progresses through harderoheme to heme b.
Examination of the spectra in Figure 2C also reveals the appearance and growth of small bands attributable to the production of peripheral vinyl groups (γ=CbH2 , γCaH=, δ=CbH2 , δCaH= and νCa=Cb). As the heme speciation changes with sequential additions of H2O2, three difference features change intensity in the νCa=Cb range: 1621, 1630 and 1634 cm−1. Based on depolarization ratios of spectra recorded with B and Q excitation, the 1630 cm−1 band in the spectrum of the SaHemQ-coproheme III spectrum is assigned to ν10. That depolarized band shifts and changes intensity in the Q-excited spectra of the harderoheme and heme b complexes, making the overlapping difference features difficult to disentangle. Nevertheless, it is clear from the spectra in Figure 2C that, as propionate groups are oxidized to vinyl groups at the porphine periphery, bands attributable to modes involving vinyl C=C stretching appear and grow as a monotonic function of added H2O2. Moreover, the 1621 cm−1 νCa=Cb band is the first to appear in the spectrum of the equilibrium reaction mixture with 2 eq of H2O2, where harderoheme III is expected to reach its maximum concentration (vide infra). Based on this order of appearance, the 1621 cm−1 νCa=Cb band is assigned to the 2-vinyl group.
HPLC analysis (Figure 3) illustrated the progress of the reaction with increasing eq of H2O2 and allowed for isolation and identification of the intermediate. Determination of its exact mass by ESI-MS (708.16 amu) and comparison with retention times established for authentic harderoheme standards (Figure S1B) confirmed the intermediate’s identity as harderoheme isomer III (Figure 3). A plot of the integrated intensities of HPLC peaks indicated that the amount of harderoheme III maximized following addition of 2 eq of H2O2, at which point reactions initially 10 μM in overall [heme] contained 2 μM coproheme III and 5.5 μM heme b (Figure 3B) as determined by referencing to standard curves (Figure S3). The concentration of harderoheme III at this maximal point was then estimated as 10 μM – [coproheme III] – [heme b] = 2.5 μM. The remaining harderoheme peaks in Figure 3B were normalized to this value. The tendency of heme b to degrade gradually in the presence of H2O2, as well as the slow catalase activity of the SaHemQ-heme b complex, both suggest that these values for [harderoheme III] in Figure 3B may be modestly overestimated.9 Complete loss of the coproheme III HPLC peak was observed at 8 eq H2O2, consistent with UV/vis and rR data (Figure 2). This was followed by gradual diminution of the Soret band and complete loss of the heme by 110 eq H2O2 as measured spectroscopically and by HPLC, Figures 3 and S4. Titration of an independently generated SaHemQ-heme b complex with H2O2 resulted in heme destruction following addition of 100 eq, consistent with prior work (data not shown).9
Figure 3. HPLC analysis of the products of the reaction of the SaHemQ-coproheme III complex with H2O2.

(A) Representative HPLC traces showing protein-free products of the reaction with 0, 2, 8, 10, and 100 eq H2O2 (a–e) are plotted. Comparison of the retention times to standards (Figure S1B) identified harderoheme isomer III as the reactive intermediate. Note that the absorbance wavelength (400 nm) used for detection is closer to the λmax for free coproheme III, which also has a higher extinction coefficient. (B) Quantitation of heme species involved in the HemQ reaction are plotted as percent of total heme versus eq H2O2 added: harderoheme (green triangles), coproheme (red squares) and heme b (circles). Points are averages of 3 values (standard deviations all within ± 15%). Solid lines are spline curves intended to qualitatively illustrate trends in the data.
Based on the quantifications in Figure 3B, it was possible to generate the rR spectrum of SaHemQ-harderoheme III using the spectra of (1) the initial SaHemQ-coproheme III, (2) the heme b product after addition of 10 eq H2O2, and (3) the equilibrium reaction mixture following addition of 2 eq H2O2 wherein all three heme complexes are present. Using the fractions of hemes determined in Figure 3B, the spectrum of harderoheme III in Figure S5 was calculated by an appropriately weighted difference. In order to test whether that rR spectrum is an accurate representation of the partially oxidized product, the percentages of the three hemes, quantified as described above, were used to generate linear combinations of the three component spectra and simulate the rR difference spectra for 4.2 and 8.4 eq H2O2 (Figure S5). The striking similarity between the experimental and constructed difference spectra reveals that the spectrum of harderoheme III is indeed a component of all equilibrium reaction mixtures in the H2O2 titration. It therefore appears likely that, because harderoheme III does not exceed ~25% of the total heme content during the titrimetric reaction, spectral features clearly attributable to harderoheme III are not easily discerned in Figures 2B and 2C.
Real-time monitoring of reactions between SaHemQ-coproheme III and H2O2
Following addition of sufficient H2O2 to effect reaction (12 eq), UV/vis spectra measured over time showed the gradual conversion of the substrate to product complex (Figure 4A). The change in absorbance at 394 nm (Soret band maximum) versus time, likely representing a composite of sequential chemical steps, could be fit to a single-term exponential function, which yielded kSoret = 0.30 ± 0.01 min−1 (t1/2 = 2.3 min).
Figure 4. Time resolved reactions between the SaHemQ-coproheme III and 12 eq H2O2.

(A) Reaction monitored by UV/vis (8 μM enzyme, 50 mM KPi, pH 7.4). SaHemQ-coproheme III complex (red), spectra measured every 0.25 min (purple), and final spectrum (Soret band λmax = 406 nm, blue) are shown. The absorbance at 394 nm versus time and fitted to a single exponential (kSoret) is shown as an inset. (B) Reaction monitored discontinuously by HPLC following a chemical quench: red squares, coproheme III; green triangles, harderoheme III; blue circles, heme b. The data describing coproheme decay were fit to a single exponential equation (red line) to obtain a first order rate constant (kc). The harderoheme III progress of reaction was fit (green line) to a two-term exponential decay function, which was used to determine t at maximum [harderoheme III]. A first order rate constant for harderoheme conversion to heme b (kh) was computed as described in the text and SI. (C) Reaction (15 μM enzyme) monitored continuously by 406.7-nm excited rR scattering. Difference spectra recorded at the indicated times are plotted. The inset shows ΔΙt/ΔItotal versus time at 416 cm−1 where increasing rR intensity reports vinyl formation; ΔIt = change in rR intensity at time t, ΔItotal = total change in rR intensity over the course of the reaction. Red line: single-term exponential fit (first order rate constant kv); open circles: residuals.
The reaction was subsequently monitored over time via a discontinuous method in which substrate, intermediate, and product could be independently monitored as function of reaction time (chemical quench followed by HPLC, Figure 4B). Loss of coproheme III as a function of time is well modeled by a single-term exponential decay function, which yields kc = 2.1 ± 0.3 min−1. The rates at which harderoheme III is produced (−kc[coproheme III][H2O2]) and converted to heme b (kh[harderoheme III][H2O2]) must be equal when [harderoheme III] maximizes (i.e. d[harderohemeIII]/dt = 0 at 0.85 min). Equating these rates and using the concentrations of coproheme III (1.8 μM) and harderoheme III (1.3 μM) at 0.85 min (see Figure 4B) allowed estimation of kh at 2.9 min−1 (further details in Supplemental Information). Finally, Thus, consistent with the titration data in Figure 3, harderoheme III is the observed intermediate oxidative decarboxylation product. Additionally, the rates of its appearance and decay are consistent with the rate of substrate, coproheme III, decay and low maximum harderoheme III concentration during the reaction.
Formation of vinyl groups was monitored during the reaction via rR spectroscopy (Figure 4C). Assuming that the vinyl group bending modes of harderoheme III and heme b have similar resonance enhancements and frequencies, time dependence of the 416 cm−1 difference band intensity represents a composite rate constant for vinyl group appearance (harderoheme III formation and conversion to heme b). Thus, as were the UV-visible spectra (vide supra) these data are well modeled by a single-term exponential function to yield kv = 1.04 ± 0.10 min−1. Despite the scatter in the rR intensities due to short acquisition times, the values of kv and kSoret, which each describe the overall conversion of coproheme III to heme b, are within a factor of four (c.f. 1.04 ± 0.10 min−1 and 0.30 ± 0.01 min−1). Using the values of kc and kh estimated from the data in Figure 4B, the apparent rate constant for vinyl group formation, kv, was estimated to be 1.6 min−1 (details in Supplemental Information). Although larger than the experimentally determined values for kv and kSoret, this estimate is in sufficiently reasonable agreement to support the reaction model suggested by the titrimetric reactions in which coproheme III is converted sequentially to harderoheme III, then to heme b.
Reactions between SaHemQ complexes with harderohemes and H2O2
SaHemQ complexes with harderohemes III and IV were subsequently titrated with H2O2. Monitoring by both UV/vis and HPLC indicated conversion of each to heme b following addition of 8 and 2 eq of H2O2, respectively (Figure S6). The rates of each reaction were monitored via changes at the Soret band maximum (Figure S7) over time following addition of 12 eq H2O2. The harderoheme III complex reacted with a time course comparable to coproheme III. The data were fitted to a single exponential with k = 0.28 ± 0.07 min−1, a value identical to the computed value for kh. The harderoheme IV isomer reacted within the mixing time.
Reaction between SaHemQ-coproheme III and peracetic acid
Titration of the SaHemQ-coproheme III complex with peracetic acid (PAA) gave very similar spectroscopic results to those obtained with H2O2 (Figure S8). The completeness of each reaction and identity of the products were verified from the HPLC and rR spectra (Figures 5 and S5). Comparison of the integrated HPLC peaks to standard curves indicated that 2 eq of PAA resulted in decomposition of 70% ± 2% of the initially available coproheme III. Eight eq fully turned over the substrate, which was converted to heme b in 85% ± 8 % yield. Similar behavior was observed in the rR titration. The appearance of bands assigned to vinyl modes (vide supra) was consistent with the products of the reaction being the same as in the H2O2 reaction.
Figure 5. Titration of SaHemQ-coproheme III complex with peracetic acid.

(A) HPLC analyses of the products of the reaction of the SaHemQ-coproheme III complex with 2, 8, or 10 eq of peracetic acid are shown. Full conversion of coproheme III to products followed addition of 10 eq of PAA. Comparison of the retention times to pure standards (Figure S1B) identified harderoheme isomer III as the reactive intermediate and heme b as the final product. Note that the absorbance wavelength (400 nm) used for detection is closer to the λmax for free coproheme III, which also has a higher extinction coefficient. (B) Peracetic acid titration monitored by changes in the Soret (406.7 nm) excited rR spectrum. The spectrum for SaHemQ-coproheme III is red; partially decarboxylated complexes are shown in purple and the final spectrum is blue. Difference spectra were generated by subtracting the spectrum of SaHemQ-coproheme III from the spectrum obtained from the reaction mixture at equilibrium with the given molar equivalents of PAA.
The reaction of SaHemQ-coproheme III following addition 12 eq of PAA was subsequently monitored by time resolved UV/vis (Figure S9) and rR spectroscopy (data not shown). The spectral changes were similar to those shown in Figure 4 but occurred with a notably larger rate constant (k = 2.4 ± 0.04 min−1).
Reaction between SaHemQ-coproheme III and mCPBA or t-butyl-OOH
Both oxidants were tested as potential HemQ cosubstrates. However, neither resulted in conversion of the SaHemQ-bound coproheme III to an identifiable harderoheme isomer or heme b. Instead, following addition of 10 eq of either oxidant, the UV/vis spectrum of the bound coproheme III appeared to recede slightly toward the baseline, with higher numbers of equivalents producing a similar effect that was more pronounced in magnitude. HPLC analysis confirmed that heme b was not produced (Figure S10).
DISCUSSION
Nature has devised at least three routes for the biosynthesis of heme b 3, 4, 5 one of which appears to be common to a large group of bacteria.5 The terminal step of this process, catalyzed in a cofactor-independent manner by the enzyme HemQ, was studied here using equilibrium and time resolved methods, synthetically prepared intermediates, and alternate oxidants with the goal of identifying possible intermediates.
Only two eq of H2O2 are, in principle, necessary for the oxidative decarboxylation of two propionates to vinyl groups; however, 10 eq were required here to completely convert SaHemQ-coproheme III to the –heme b complex, with 2 CO2 and water as the presumptive co-products (Figure 2). This requirement for a stoichiometric excess of H2O2 suggested that some of it reacts non-productively. Consistent with that conclusion, a full eq of the product heme b was not observed with a stoichiometric addition of H2O2 (Figure 3), suggesting concurrent conversion of coproheme III, H2O2-mediated degradation of heme b, and possible catalytic disproportionation of H2O2.9,24 Heme b degradation was driven to completion with the addition of ~100 eq of H2O2 (Figure S4).
The observed inefficiency of the reaction and degradation of the product by reaction with exogenous H2O2 could point toward the upstream catalyst, HemY (Scheme 1), as an endogenous source of H2O2. This idea is consistent with the previously documented interplay of HemY, HemH, and HemQ, where the kinetics of HemH/Y are altered by the presence of HemQ.24 It could also explain how a catalase positive organism like S. aureus, which avidly detoxifies H2O2, might be able to manage and use H2O2 as an essential enzyme substrate.
With <10 eq H2O2, most of the coproheme III was converted to a species with several of the anticipated spectral properties of harderoheme (Scheme 2). These include rR bands associated with both vinyl and propionate bends (Figure 2). Mass spectrometry corroborated the identity of the product as a harderoheme, and chromatographic comparison to synthetic standards showed it to be exclusively isomer III (Figure 3, S4). This suggests that, as in heme-biosynthesis-associated coproporphrinogen and uroporphyrinogen oxidases,25,26 the reaction occurs in an obligate clockwise direction, viewing from the distal heme pocket, with the ring A propionate converting to a vinyl first, and the ring B propionate second.
This reaction sequence is consistent with our proposed model for coproheme III binding,11 which is based on published crystal structures of HemQ in the absence of bound substrate and structures for related chlorite dismutases bound to heme b.12,27 An overlay of two representative structures illustrates the conservation of hydrogen bonding contacts to the non-reactive ring D propionate. By contrast, a key tyrosine residue that forms hydrogen bonds to the ring C propionate in Clds (Y118, Figure 6) is conserved in the primary sequences of HemQs; however, in the substrate-free HemQ, this tyrosine (Y124) is part of a ~40 amino acid stretch of the HemQ monomer (residues 100-140) that is clearly out of alignment with the Cld structure. This stretch instead forms the upper part of a large opening in the subunit, which may be important for gating substrate entry/product egress. In addition to the conserved tyrosine, the putative gate contains a triad of positively charged residues (arginine or lysine, R128-130 in Figure 6) that are conserved in HemQs but not Clds. These could form hydrogen bonds or salt bridges to the ring B propionate when the gate closes. A binding geometry which places coproheme III “face up” relative to the Clds’ “face down” heme b would allow such hydrogen bonding contacts to form, while avoiding potential steric clashes between a HemQ-conserved tyrosine residue (Y144).
Figure 6. Overlay of the structures of a representative heme b-bound chlorite dismutase (carbon green, PDB ID 3Q08)12 and solvent-bound HemQ (carbon cyan, PDB ID 1T0T).27.

(A) The monomeric subunit structures are very similar with the exception of a loop-helix region, highlighted in darker shades of blue/green. This region is located on the exterior of the HemQ homopentamer. (B) Key residues surrounding the heme b/coproheme III binding sites are indicated in this view overlooking the distal pocket. The placement of tetrapyrrole rings A-D in the expected orientation of the coproheme III is shown. K151, W155, N117, and Y113 (Cld numbering) are conserved in both HemQs and Clds and form contacts to the ring C/D propionates. Y113 (HemQ) is at the same sequence position as Y118 (Cld). It is part of the loop-helix region in HemQ. (C) Conserved active site Cld/HemQ residues (side view).
The overall conversion of the coproheme III to heme b, monitored by changes in the UV/vis and rR spectra, is relatively slow (t1/2 on the order of 1-2 min based on kv or kSoret, pH 7.4, 20 °C). The time-resolved chemical-quench/HPLC experiment suggests that the decarboxylation reactions have similar rate constants, with that for the reaction at ring A (2-propionate, Scheme 1) being slightly slower than its ring B counterpart (4-propionate). This conclusion is consistent with the observed maximum accumulation of only ~25% harderoheme III in the reaction between SaHemQ-coproheme III and 10 eq of H2O2 (Figure 3).
In spite of harderoheme III being the apparent reaction intermediate, SaHemQ complexes with both harderoheme isomers III and IV were converted to heme b upon reaction with H2O2 (Figures S6, S7). The reaction with isomer III was slow, with a rate constant similar to that for the overall SaHemQ-coproheme III reaction (kSoret or kv) under similar conditions. By contrast, the reaction with isomer IV was complete within the experimental mixing time, making it considerably faster than the conversion of the harderoheme III generated as an intermediate in the oxidation of SaHemQ-coproheme III. This reactivity pattern further suggests that reactivity of the 2-propionate group is governed by non-covalent interactions between the 4-propionate group and the enzyme (vide infra), which are absent in the SaHemQ complex with harderoheme IV. For example, the ring B 4-propionate could be both stabilized and solvent-protected by salt bridges to conserved arginine residues (R128-130) when the active site closes around the coproheme III substrate. Thus, one possible explanation for the higher reactivity of harderoheme IV is that absence of the salt bridge could afford greater solvent access to the ring A propoionate, thereby accelerating the initial steps of the reaction of harderoheme IV with H2O2. This suggests a structure-based hypothesis where loss of the carboxylate group from the 4-propionate and its nonbonded contacts with the active site gate helps to trigger opening of the active site. When that happens upon formation of heme b, it facilitates release of product. When it happens for the non-natural harderoheme IV, it accelerates its oxidative decarboxylation.
Acceleration of the reaction by water suggests the involvement of proton transfer in the rate limiting step of the reaction. An active site base over the open (distal) coordination position, usually a histidine adjacent to an arginine, helps facilitate the Fe(III)/H2O2 reaction in typical heme peroxidases.28 The neutral imidazole side chain acts as a base toward H2O2, catalyzing formation of the initial FeIII−OOH (Compound 0) intermediate. In peroxidase mutants lacking an active site base, formation of Compound 0 can be slowed up to 5-orders of magnitude.29,30 The HemQ active site is remarkably hydrophobic and lacks both a conserved basic residue and an identifiable route for proton entry/departure. Hence, the formation of Compound 0, the most plausible initial reaction product for H2O2 and either the coproheme III or harderoheme complexes of HemQ, might be expected to be slow or even rate limiting, but potentially faster if water gains access to the active site.
Once formed, a Compound 0 intermediate can have at least three fates. First, with the input of a proton, the FeIIIO−OH bond can break heterolytically to form water and a high-valent iron-oxo intermediate (Scheme 3, pathway a). This intermediate (Compound I) is formally described as FeIV=O with an oxidizing equivalent on either the porphyrin or the side chain of an aromatic amino acid, such as tyrosine or tryptophan, capable of supporting a radical cation. In heme peroxidases, the protonated active site base acts as the acid in the Compound I-forming reaction. The conserved arginine polarizes the FeOOH moiety, electrostatically promoting movement of both of the electrons from the O−O bond toward the water leaving group.29 On the proximal side of the porphyrin plane, the heme’s histidine ligand is hydrogen bonded to an aspartate or glutamate side chain. The resulting anionic character of the proximal His ligand supports an additional electrostatic push toward heterolytic cleavage of the FeIIIO−OH bond.31 The HemQ active site lacks both the distal His-Arg and proximal His-Glu/Asp motifs of a typical peroxidase. Instead, it has a conserved distal glutamine surrounded by nonpolar residues and, as evinced by the 213-cm−1 νFe−His frequency in the 441.6-nm excited rR spectrum of its 5-coordinate HS ferrous form (data not shown), a neutral proximal histidine due to the lack of a hydrogen-bonding Asp or Glu. In short, the HemQ active site appears to lack the typical bonded and nonbonded interactions between the heme and enzyme that drive FeIIIO−OH heterolysis.
Scheme 3.

Possible reaction pathways following from Compound 0
However, peracetic acid, an oxygen atom donor, rapidly converted SaHemQ-coproheme III to –heme b with harderoheme III as an intermediate. Because Compound I is expected to form when these ferric species react with a peracid, these results suggest that a species isoelectronic with Compound I may be able to form and affect the transformations of coproheme III to harderoheme III and then harderoheme III to heme b. Whether a similar iron intermediate proceeds from SaHemQ’s reactions with H2O2, however, is not clear. Notably, the larger oxygen atom donor mCPBA and the organic hydroperoxide, t-butyl-OOH were both ineffective at converting coproheme III to heme b (Figure S10).
Alternatively, the FeO−OH bond of Compound 0 could break homolytically, generating FeIV=O, water, and a propionyl β-carbon radical in a stepwise (Scheme 3, pathway b) or concerted manner (pathway c). Transient generation of a propionyl β-carbon radical is an early step in some proposed mechanisms for coproporphyrinogen oxidase,32 wherein the ring A and B propionates are converted to vinyls in an O2-dependent fashion. These pathways both have the advantage of producing less-charged intermediates which are more consistent with the hydrophobic active site. A stepwise homolytic pathway is currently favored in heme oxygenases,33 another enzymatic class where a heme acts as both substrate and cofactor.
Interestingly, HemQs are evolutionarily and structurally related to IsdGs, which catalyze the heme oxygenase reaction specifically in several groups of gram-positive bacteria.34,35 The two proteins both possess hydrophobic heme binding domains characterized by a mutually conserved distal glutamine (HemQ) or asparagine (IsdG) and proximal histidine and tyrosine residues.36 Why nature evolved pathways for heme biosynthesis and degradation that are particular to gram-positives is not clear.
Supplementary Material
ACKNOWLEDGMENT
We would like to acknowledge Dr. Jonathan Hilmer for sharing his technical expertise in mass spectrometry. While this paper was under review, a relevant paper on the HemY, HemH, and HemQ proteins from Staphylococcus aureus was published in the online version of the journal Molecular Microbiology. (See reference 37 for the print citation.)
FUNDING
Support is gratefully acknowledged from the National Institutes of Health grants GM090260 (to J.L.D.), GM114787 (to G. S. L.-R.), and AI072719 (to K. R. R). The mass spectrometry facility at MSU receives funding from the Murdock Charitable Trust and NIH 5P20RR02437 of the CoBRE program.
ABBREVIATIONS
- Cld
chlorite dismutase
- DMSO
dimethylsulfoxide
- HPLC
high performance liquid chromatography
- mCPBA
meta-chloroperbenzoic acid
- LB
lysogeny broth
- KPi
potassium phosphate
- rR
resonance Raman
- Sa
Staphylococcus aureus
- SDS-PAGE
sodium dodecylsulfonate polyacrylamide gel electrophoresis
- UV/vis
ultraviolet-visible
Footnotes
Supporting Information. Includes (1) details of the metalation and deprotection of harderoporphyrins III and IV; (2) details of the purification of SaHemQ; (3) HPLC and pyridine hemochrome analyses of the various hemes; (4) titrations of the SaHemQ-coproheme III complex with H2O2 and peracetic acid; (5) titrations and kinetic data describing the reaction of the SaHemQ-harderoheme complexes with H2O2; (6) data showing the reaction of SaHemQ-coproheme III with mCPBA and t-butyl-OOH; (7) description of kinetic analysis. This material is available free of charge via the Internet at http://pubs.acs.org.
Author Contributions
The manuscript was written through contributions of all authors. / All authors have given approval to the final version of the manuscript. /
REFERENCES
- (1).Dailey HA. Enzymes of heme biosynthesis. J. Biol. Inorg. Chem. 1997;2:411–417. [Google Scholar]
- (2).Layer G, Reichelt J, Jahn D, Heinz DW. Structure and function of enzymes in heme biosynthesis. Protein Sci. 2010;19:1137–1161. doi: 10.1002/pro.405. [DOI] [PMC free article] [PubMed] [Google Scholar]
- (3).Panek H, O'Brian MR. A whole genome view of prokaryotic haem biosynthesis. Microbiology. 2002;148:2273–2282. doi: 10.1099/00221287-148-8-2273. [DOI] [PubMed] [Google Scholar]
- (4).Bali S, Lawrence AD, Lobo SA, Saraiva LM, Golding BT, Palmer DJ, Howard MJ, Ferguson SJ, Warren MJ. Molecular hijacking of siroheme for the synthesis of heme and d1 heme. Proc. Nat. Acad. Sci. USA. 2011;108:18260–18265. doi: 10.1073/pnas.1108228108. [DOI] [PMC free article] [PubMed] [Google Scholar]
- (5).Dailey H, Gerdes S, Dailey T, Burch J, Phillips J. Noncanonical coproporphyrin-dependent bacterial heme biosynthesis pathway that does not use protoporphyrin. Proc. Nat. Acad. Sci. USA. 2015;112:2210–2215. doi: 10.1073/pnas.1416285112. [DOI] [PMC free article] [PubMed] [Google Scholar]
- (6).Dailey HA. Terminal steps of haem biosynthesis. Biochem. Soc. Trans. 2002;30:590–595. doi: 10.1042/bst0300590. [DOI] [PubMed] [Google Scholar]
- (7).Lash TD, Mani UN, Drinan MA, Zhen C, Hall T, Jones MA. Normal and abnormal heme biosynthesis. 1. Synthesis and metabolism of di- and monocarboxylic porphyrinogens related to coproporphyrinogen-III and harderoporphyrinogen: A model for the active site of coproporphyrinogen oxidase. J. Org. Chem. 1999;64:464. [Google Scholar]
- (8).Lash TD, Mani UN, Keck A, Jones MA. Normal and abnormal heme biosynthesis. 6. Synthesis and metabolism of a series of monovinylporphyrinogens related to harderoporphyrinogen. Further insights into the oxidative decarboxylation of porphyrinogen substrates by coproporphyrinogen oxidase. J. Org. Chem. 2010;75:3183–3192. doi: 10.1021/jo100083t. [DOI] [PubMed] [Google Scholar]
- (9).Mayfield JA, Hammer ND, Kurker RC, Chen TK, Ojha S, Skaar EP, DuBois JL. The chlorite dismutase (HemQ) from Staphylococcus aureus has a redox-sensitive heme and is associated with the small colony variant phenotype. J. Biol. Chem. 2013;288:23488–23504. doi: 10.1074/jbc.M112.442335. [DOI] [PMC free article] [PubMed] [Google Scholar]
- (10).Kuhner M, Haufschildt K, Neumann A, Storbeck S, Streif J, Layer G. The alternative route to heme in the methanogenic archaeon. Methanosarchia barkeri, Archaea. ecollection. 2014;2014 doi: 10.1155/2014/327637. [DOI] [PMC free article] [PubMed] [Google Scholar]
- (11).Celis AI, DuBois JL. Substrate, product, and cofactor: The extraordinary flexible relationship between the CDE superfamily and heme. Arch. Biochem. Biophys. 2015;574:3–17. doi: 10.1016/j.abb.2015.03.004. [DOI] [PMC free article] [PubMed] [Google Scholar]
- (12).Goblirsch BR, Streit BR, DuBois JL, Wilmot CM. Strunctural features promoting dioxygen production by Dechloromonas aromatica chlorite dismutase. J. Biol. Inorg. Chem. 2010;15:879–889. doi: 10.1007/s00775-010-0651-0. [DOI] [PMC free article] [PubMed] [Google Scholar]
- (13).Berry EA, Trumpower BL. Simultaneous determination of hemes a, b, and c from pyridine hemochrome spectra. Anal. Biochem. 1987;161:1–15. doi: 10.1016/0003-2697(87)90643-9. [DOI] [PubMed] [Google Scholar]
- (14).Rand K, Noll C, Schiebel HM, Kemken D, Duelcks T, Kalesse M, Heinz DW, Layer G. The oxygen-independent coproporphyrinogen III oxidase HemN utilizes harderoporphyrinogen as a reaction intermediate during conversion of coproporphyrinogen III to protoporphyrinogen IX. Biol. Chem. 2010;391:55–63. doi: 10.1515/BC.2010.006. [DOI] [PubMed] [Google Scholar]
- (15).Mak P, Podstawka E, Kincaid J, Proniewicz L. Effects of systematic peripheral group deuteration on the low-frequency resonance Raman spectra of myoglobin derivatives. Biopolymers. 2004;75:217–228. doi: 10.1002/bip.20115. [DOI] [PubMed] [Google Scholar]
- (16).Hu S, Smith K, Spiro T. Assignment of protoheme resonance raman spectrum by heme labeling in myoglobin. J. Am. Chem. Soc. 1996;118:12638–12646. [Google Scholar]
- (17).Uchida K, Susai Y, Hirotani E, Kimura T, Yoneya T, Tekeuchi H, Harada I. 4-vinyl and 2,4-divinyl deuteration effects on the low frequency resonance Raman bands of myoglobin: correlation with the structure of vinyl group. J. Biol. Chem. 1988;103:979–985. doi: 10.1093/oxfordjournals.jbchem.a122397. [DOI] [PubMed] [Google Scholar]
- (18).Cheung LD, Yu N-T, Felton RH. Resonance Raman spectrum and excitation profiles of Soret-excited metalloporphyrins. Chem. Phys. Lett. 1978;55:527. [Google Scholar]
- (19).Smulevich G, Hu S, Rodgers KR, Goodin DB, Smith KM, Spiro TG. Heme-protein interactions in cytochrome c peroxidase revealed by site-directed mutagenesis and resonance Raman spectra of isotopically labeled hemes. Biospectroscopy. 1996;1996(2):365–376. [Google Scholar]
- (20).Rwere F, Mak P, Kincaid J. Resonance Raman determination of vinyl group disposition in different derivatives of native myoglobin and its heme-disoriented form. J. Raman Spec. 2014;45:97–104. [Google Scholar]
- (21).Rwere F, Mak P, Kincaid J. Resonance raman interrogation of the consequences of heme rotational disorder in myoglobin and its ligated derivatives. Biochemistry. 2008;47:12869–12877. doi: 10.1021/bi801779d. [DOI] [PMC free article] [PubMed] [Google Scholar]
- (22).Rwere F, Mak P, Kincaid J. The impact of altered protein-heme interactions on the resonance Raman spectra of heme proteins. Studies of heme rotational disorder. Biopolymers. 2008;89:179–186. doi: 10.1002/bip.20887. [DOI] [PubMed] [Google Scholar]
- (23).Podstawka E, Mak P, Kincaid J, Proniewicz L. Low frequency resonance Raman spectra of isolated alpha and beta subunits of hemoglobin and their deuterated analoges. Biopolymers. 2006;83:455–466. doi: 10.1002/bip.20573. [DOI] [PubMed] [Google Scholar]
- (24).Dailey TA, Boynton TO, Albetel A-N, Gerdes S, Johnson MK, Dailey HA. Discovery and characterization of HemQ an essential heme biosynthetic pathway component. J. Biol. Chem. 2010;285:25978–86. doi: 10.1074/jbc.M110.142604. [DOI] [PMC free article] [PubMed] [Google Scholar]
- (25).Luo J, Lim CK. Order of uroporphyrinogen III decarboxylation on incubation of prophobilinogen and uroporphyrinogen III with erythrocyte uropophyrinogen decarboxylase. Biochem. J. 1993;289:529–532. doi: 10.1042/bj2890529. [DOI] [PMC free article] [PubMed] [Google Scholar]
- (26).Stephenson JR, Stacey JA, Morgenthaler JB, Friesen JA, Lash TD, Jones MA. Role of aspartate 400, arginine 262, and arginine 401 in the catalytic mechanism of human corpoporphyrinoen oxidase. Protein Sci. 2007;16:401–410. doi: 10.1110/ps.062636907. [DOI] [PMC free article] [PubMed] [Google Scholar]
- (27).Gilski M, Borek D, Chen Y, Collart F, Joachimiak A, Otwinowski Z. Crystal structure of apc35880 protein from Bacillus stearothermophillus, to be published. 2004 [Google Scholar]
- (28).Poulos TL, Fenna RE. Metalloenzymes involving amino acid residue related radicals. Metal Ions Biol. Syst. 1994;30:25–75. [Google Scholar]
- (29).Hiner AN, Raven EL, Thorneley RN, García-Cánovas F, Rodríguez-López JN. Mechanisms of compound I formation in heme peroxidases. J. Inorg. Biochem. 2002;91:27–34. doi: 10.1016/s0162-0134(02)00390-2. [DOI] [PubMed] [Google Scholar]
- (30).Erman JE, Vitello LB, Miller MA, Shaw A, Brown KA, Kraut J. Histidine 52 is a critical residue for rapid formation of cytochrome c peroxidase compound I. Biochemistry. 1993;32:9798–9806. doi: 10.1021/bi00088a035. [DOI] [PubMed] [Google Scholar]
- (31).Choudhury K, Sundaramoorthy M, Hickman A, Yonetani T, Woehl E, Dunn MF, Poulos TL. Role of the proximal ligand in peroxidase catalysis. Crystallographic, kinetic, and spectral studies of cytochrome c peroxidase proximal ligand mutants. J. Biol. Chem. 1994;269:20239–20249. [PubMed] [Google Scholar]
- (32).Lash TD. The enigma of coproporphyrinogen oxidase: how does this unusual enzyme carry out oxidative decarboxyations to afford vinyl groups? Bioorg. Med. Chem. Lett. 2005;15:4506–4509. doi: 10.1016/j.bmcl.2005.07.010. [DOI] [PubMed] [Google Scholar]
- (33).Matsui T, Iwasaki M, Sugiyama R, Unno M, Ikeda-Saito M. Dioxygen activation for the self-degradation of heme: reaction mechanism and regulation of heme oxygenase. Inorg. Chem. 2010;49:3602–3609. doi: 10.1021/ic901869t. [DOI] [PubMed] [Google Scholar]
- (34).Wilks A, Heinzl G. Heme oxygenation and the widening paradigm of heme degradation. Arch. Biochem. Biophys. 2014;544:87–95. doi: 10.1016/j.abb.2013.10.013. [DOI] [PMC free article] [PubMed] [Google Scholar]
- (35).Skaar EP, Gaspar AH, Schneewind O. IsdG and IsdI, heme-degrading enzymes in the cytoplasm of Staphyloccocus aureus. J. Biol. Chem. 2004;279:436–443. doi: 10.1074/jbc.M307952200. [DOI] [PubMed] [Google Scholar]
- (36).Lee WC, Reniere ML, Skaar EP, Murphy MEP. Ruffling of metalloporphyrins bound to IsdG and IsdI, two heme-degrading enzymes in Staphylococcus aureus. J. Biol. Chem. 2008;283:30957–30963. doi: 10.1074/jbc.M709486200. [DOI] [PMC free article] [PubMed] [Google Scholar]
- (37).Lobo SAL, Scott A, Videira MAM, Winpenny D, Gardner M, Palmer MJ, Schroeder S, Lawrence AD, Parkinson T, Warren MJ, Saraiva LM. Staphyloccocus aureus haem biosynthesis: characterisation of the enzymes involved in final steps of the pathway. Mol. Microbiol. 2015 doi: 10.1111/mmi.13041. Epub ahead of print. [DOI] [PubMed] [Google Scholar]
Associated Data
This section collects any data citations, data availability statements, or supplementary materials included in this article.