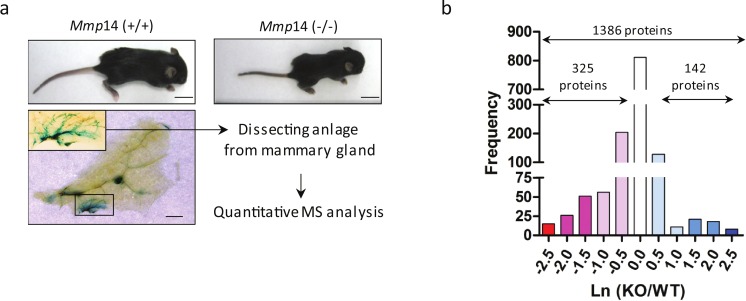
Figure 2. A scheme for the proteomic analysis of mammary gland tissues from wild type and Mmp14KO mice.
(A) A workflow representing the experimental design and results of the proteomic analysis is given here. Shown above are photographs of WT and Mmp14KO C57BL/6 mice photographed at 2 weeks, showing significant reduction in body size in the KO mice. Scale = 1 cm. Shown below is a whole mount mammary gland from Mmp14KO mouse stained with b-gal (ref). Inset indicates the anlage. Scale = 2 mm. A flow charts show that the mammary anlagen were dissected out and quantitative mass spectrometry analysis was performed. (B) Graph showing the distributions of a relative ratio between WT and KO calculated by Ln (WT/KO).

