

Abstract
Parkinson's disease (PD) and the parkinsonian variant of multiple system atrophy (MSAp) are neurodegenerative disorders that can be difficult to differentiate clinically. This study provides the first characterization of the patterns of task‐related functional magnetic resonance imaging (fMRI) changes across the whole brain in MSAp. We used fMRI during a precision grip force task and also performed voxel‐based morphometry (VBM) on T1‐weighted images in MSAp patients, PD patients, and healthy controls. All groups were matched on age, and the patient groups had comparable motor symptom durations and severities. There were three main findings. First, MSAp and PD had reduced fMRI activation in motor control areas, including the basal ganglia, thalamus, insula, primary sensorimotor and prefrontal cortices, and cerebellum compared with controls. Second, there were no activation differences among the disease groups in the basal ganglia, thalamus, insula, or primary sensorimotor cortices, but PD had more extensive activation deficits throughout the cerebrum compared with MSAp and controls. Third, VBM revealed reduced volume in the basal ganglia, middle and inferior cerebellar peduncles, pons, and throughout the cerebrum in MSAp compared with controls and PD, and additionally throughout the cerebellar cortex and vermis in MSAp compared with controls. Collectively, these results provide the first evidence that fMRI activation is abnormal in the basal ganglia, cerebellum, and cerebrum in MSAp, and that a key distinguishing feature between MSAp and PD is the extensive and widespread volume loss throughout the brain in MSAp. Hum Brain Mapp 36:1165–1179, 2015. © 2014 Wiley Periodicals, Inc.
Keywords: Parkinson's disease, atypical parkinsonism, functional magnetic resonance imaging, magnetic resonance imaging, voxel‐based morphometry, force, brain atrophy
INTRODUCTION
Multiple system atrophy (MSA) is a neurodegenerative disease of unknown etiology that is characterized clinically by a variable combination of autonomic dysfunction, parkinsonism, and cerebellar ataxia. According to the consensus statement on MSA, two subtypes can be distinguished based on whether the predominant motor feature is parkinsonism (MSAp) or cerebellar ataxia [MSAc; Gilman et al., 1999, 2008]. Due to their overlapping motor features (i.e., bradykinesia, rest tremor, rigidity, and postural instability), MSAp and Parkinson's disease (PD) are difficult to distinguish, particularly in the early stages [Litvan et al., 1997]. Although they have similar clinical presentations, MSAp progresses more rapidly, responds poorly to dopaminergic therapy, and involves more profound disability and a reduced lifespan compared with PD [Stefanova et al., 2009]. At present, a definite diagnosis of MSAp or PD relies on the presence of distinct neuropathological signs [Gelb et al., 1999; Gilman et al., 1999, 2008; Trojanowski et al., 2007]. However, it is critical to understand the functional and structural brain changes that occur in these diseases during life so that objective diagnostic tests can be developed, and disease progression and therapeutic strategies can be monitored and evaluated.
Functional magnetic resonance imaging (fMRI) has been used extensively to study brain activation in PD. A recent meta‐analysis of 21 motor task‐based fMRI (and 3 H2O positron emission tomography, PET) publications in PD found that that activation was consistently reduced in the putamen and increased in the superior parietal lobule (SPL) of PD patients, but the direction of activation differences was heterogeneous in the primary motor cortex (M1), presupplementary motor area (SMA), and inferior parietal cortex (IPC) [Herz et al., 2013]. This mixed pattern of results was found to be related in part to aspects of the tasks, suggesting that it is important to use the same task when comparing results between studies and groups. In MSA, only one study, which used PET, has investigated task‐related functional brain changes [Payoux et al., 2010]. It was shown that during joystick hand movements MSA patients had reduced activation in the cerebellum and increased activation in the SPL compared with controls and PD, and reduced activation in the putamen and increased activation in SMA compared with PD patients. In contrast, PD patients had reduced activation in SMA and superior parietal cortex and increased activation in the cerebellum compared with controls. However, the impact of MSAp on task‐based fMRI is not clear, particularly in comparison with PD patients.
Conversely, voxel‐based morphometry (VBM) of T1‐weighted images has been used to assess macrostructural changes in both MSAp and PD. VBM has revealed reduced volume in the striatum, prefrontal cortex, and cortical motor areas of early‐stage MSAp compared with controls and PD [Brenneis et al., 2003], and additionally in the cerebellum, pons, thalamus, and parietal, occipital, and temporal areas of later‐stage MSAp compared with controls [Minnerop et al., 2007; Tzarouchi et al., 2010]. In contrast, most VBM studies in cognitively intact PD have reported no significant volumetric changes [Beyer et al., 2007; Brenneis et al., 2003; Dalaker et al., 2010; Melzer et al., 2012; Menke et al., 2014; Price et al., 2004; Prodoehl et al., 2013; Tessitore et al., 2012] or reduced volume in only a few areas that vary across studies [Camicioli et al., 2009; Cordato et al., 2005; Martin et al., 2009; Nagano‐Saito et al., 2005; Pereira et al., 2012; Summerfield et al., 2005; Tir et al., 2009]. To date, no studies in MSAp and only one in PD have normalized VBM data to a cerebellum‐specific template [Camicioli et al., 2009], thus making it unclear how the macrostructure of this important motor control area is affected in these diseases.
The patterns of motor task‐based fMRI changes across the whole brain, and their relationship to macrostructural changes, are unknown in MSAp and PD, but may reveal important differences between the diseases. In this study, multimodal MRI was used to test the hypothesis that MSAp involves both functional and macrostructural changes, whereas PD involves primarily functional changes. To this end, we used fMRI to examine the blood oxygen level‐dependent (BOLD) signal in MSAp, PD, and healthy controls during a precision grip force experiment that has been shown to activate the motor circuitry of healthy individuals [Spraker et al., 2007; Vaillancourt et al., 2007] and reveal reduced activation in the same areas of early‐stage de novo PD patients [Prodoehl et al., 2010; Spraker et al., 2010]. Next, we performed VBM on T1‐weighted MR images to assess differences in local gray matter (GM) and white matter (WM) volumes between the groups. Importantly, both the fMRI and VBM data from the cerebellum were normalized using the spatially unbiased infratentorial template [SUIT; Diedrichsen, 2006], thus providing improved intersubject coregistration than the standard normalization procedures.
MATERIALS AND METHODS
Participants and Assessments
A total of 42 individuals participated in this study between 2007 and 2011: 14 patients with PD, 14 patients with MSAp, and 14 healthy age‐matched controls. The patients were diagnosed by a movement disorders specialist using established criteria: PD based on United Kingdom PD Society Brain Bank criteria [Hughes et al., 2001] and probable MSAp based on the American Academy of Neurology and American Autonomic Society criteria [Gilman et al., 1999, 2008). The control participants were recruited via advertisements and reported no history of neuropsychiatric or neurological problems. All testing occurred between the hours of 7:30 am and 12:30 pm, with patients having withdrawn from anti‐parkinsonian medications the night before the research evaluation. Supporting Information Table 1 lists the anti‐parkinsonian medications each patient was taking at the time of the study. The mini‐mental state examination [MMSE; Folstein et al., 1975] was administered to all participants to screen for general cognitive impairment, and the motor subsection of the unified Parkinson's disease rating scale (UPDRS‐III) was administered to the patients to assess disease severity. Each participant provided written informed consent for the procedures in this study, which were approved by the local Institutional Review Board.
Force Control Apparatus
Participants produced force by pinching a custom‐built fiber optic transducer (Neuroimaging Solutions, Gainesville, FL) with their hand (Fig. 1A). The force data were digitized at 125 Hz by a si425 Fiber Optic Interrogator (Micron Optics, Atlanta, GA) and recorded in newtons by a program written in LabVIEW (National Instruments, Austin, TX). The visual displays were presented to the participants via a biofeedback system that was mounted on the head coil. The screen had a resolution of 640 × 480 pixels and a refresh rate of 60 Hz.
Figure 1.
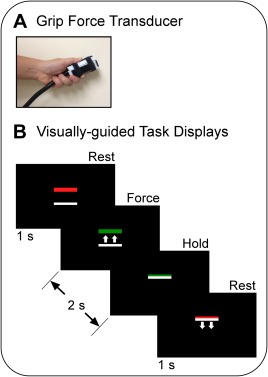
Experimental fMRI paradigm showing the (A) force‐sensitive fiber optic transducer and (B) visual displays that cued the participants when to apply force to the transducer (green bar) and when to rest (red bar). In the visually guided blocks, the green target bar was in a different vertical position from trial to trial and the white cursor bar moved upward in proportion to the force amplitude (as shown). Note that the small white arrows were not presented to the participants, but are shown here to illustrate the movement of the white bar with applied force. The task of the participant was to overlay the green bar on the white bar. In the memory‐guided blocks, the locations of the target and cursor bars were fixed, but the color of the target bar still provided task cues. The participants were instructed to press with a different amount of force on each trial. [Color figure can be viewed in the online issue, which is available at http://wileyonlinelibrary.com.]
Experimental Design and Procedure
Before scanning, all participants completed training in which they practiced the force tasks described below. At the beginning of the training period, each participant's maximum voluntary contraction (MVC) was measured using a Jamar hydraulic pinch gauge. The participants produced a contraction of maximum force using a pinch grip (thumb, index, and middle finger) on three consecutive trials. Each trial was separated by approximately 30 s. The mean MVC of the three trials was then calculated for use in the experiment.
The block design fMRI experiment proceeded as follows: 30 s rest, 30 s visually guided force task, 12 s rest, and 30 s memory‐guided force task. This sequence was repeated four times and there was an additional 30‐s rest period following the final memory‐guided block. Thus, the scan lasted 7 min and 18 s. Throughout the scan, the participants viewed a black screen with two horizontal bars: a colored target bar positioned above a white cursor bar (Fig. 1B). The color of the target bar served as the task cue; it turned green to cue the participant to begin the force pulse, and it turned red to cue the participant to release the force pulse and rest. Patients performed the task using their most affected hand, if applicable. For MSAp patients who had symmetrical motor symptoms, the experimenter selected randomly which hand was tested.
In each type of force block, the task was to produce 10, 2‐s pulse‐hold contractions of different amplitudes using a pinch grip. Each pulse was followed by 1‐s of rest. The participants were instructed to reach the target quickly, maintain force at the target amplitude while it remained green, and then quickly decrease force when the target became red. In the visually guided blocks, the white cursor provided feedback by moving vertically on the screen according to the level of force applied to the transducer. The target bar was in a different vertical position from trial‐to‐trial and the participants were instructed to press the transducer so that the white cursor bar was directly on top of the green target bar. Target force levels varied between 5 and 25% MVC, with the average across the 10 trials per block equal to 15% MVC. In the memory‐guided blocks, the color of the target bar continued to serve as a task cue. However, the locations of the target and cursor bars were fixed; they did not vary across trials or with the application of force, respectively. The task was to self‐select and produce a series of force pulses that varied in amplitude from trial‐to‐trial. The participants were trained to vary their force levels randomly across trials such that the average MVC per block was approximately 15%. In the rest blocks, the target bar was red and the participants were instructed to fixate it without producing force.
MRI Data Acquisition
All images were collected with a 3.0‐T MR scanner (3T94 Excite 2.0, General Electric Healthcare, Waukesha, WI) using a quadrature volume head coil. Head movement was minimized by foam padding within the coil and scanner noise was attenuated using a combination of earplugs and circumaural headphones. BOLD images were acquired using a T2*‐weighted single‐shot gradient echo echo‐planar pulse sequence (TR = 2,500 ms, TE = 25 ms, flip angle = 90°, matrix = 64 × 64, FOV = 200 mm2, 42 contiguous axial slices, and slice thickness = 3 mm). The size of the functional voxels was 3.125 × 3.125 × 3 mm. The most superior functional slice was aligned to the most superior point in the brain. As such, the most inferior cerebellum was not captured in subjects with larger brains. Following the functional scans, T1‐weighted images of the whole brain were acquired using a fast spoiled gradient echo pulse sequence (TR = 9 ms, TE = 1.98 ms, flip angle = 25°, matrix = 256 × 256, FOV = 240 mm2, 120 contiguous axial slices, and slice thickness = 1.5 mm).
Clinical and Demographic Data Analyses
Demographic data were compared between all three groups using separate one‐way ANOVAs, and clinical data were compared between the two patient groups using independent samples t‐tests. All results were considered significant at P < 0.05.
Force Data Analyses
Prior to analyses, a low pass Butterworth filter at 30 Hz (fourth‐order dual pass) was applied to the force data. The data from each participant were then inspected visually and four time‐points were marked on each pulse [Spraker et al., 2010]: Point 1 marked the onset of force; Points 2 and 3 marked the beginning and end of steady‐state force, respectively; and Point 4 marked the offset of force. Based on these points, four dependent variables were calculated for each pulse. Mean steady‐state force amplitude was calculated as the mean force output between points 2 and 3. Force duration was calculated by subtracting the time value of Point 1 from Point 4. The rate of change of force during the rise and relaxation phases was calculated by averaging the first derivative of force between Points 1 and 2 and Points 3 and 4, respectively. Next, these variables were averaged across the 40 pulses for each task and participant. The standard deviation of the mean steady‐state force amplitudes was calculated across the 10 pulses in each block, and then averaged across all four blocks for each task. Each of the above calculations was performed by custom algorithms in MATLAB (MathWorks, Natick, MA). We counted the number of pulses produced for each block and then calculated the mean number of pulses produced per block for each task and participant. Each dependent variable was analyzed using a repeated measures ANOVA with task (visually guided, memory‐guided) as the within‐subjects factor and group (MSAp, PD, control) as the between‐subjects factor. Pairwise Bonferroni post hoc tests were performed where significant differences were found between groups. Alpha was set at 0.05.
fMRI Preprocessing and Analyses
All fMRI data preprocessing and analyses were performed using analysis of functional neuroimages (AFNI, http://afni.nimh.nih.gov/afni/) except for the normalization of the cerebellum, which was performed using SUIT [Diedrichsen, 2006] within statistical parametric mapping (SPM8, Wellcome Department of Cognitive Neurology, London, UK; http://www.fil.ion.ucl.ac.uk/spm/).
The methodology described below to analyze the fMRI data was consistent with previous research [Coombes et al., 2012; Spraker et al., 2010, 2012]. Four functional volumes were collected prior to the start of the experiment to allow for magnetization to stabilize. The datasets of participants who used their left hand during the force tasks were flipped in the left–right plane prior to processing. Thus, we refer to the left side of the brain images as contralateral to the hand producing force and the right side as ipsilateral to the hand producing force. Slice timing and motion‐corrected individual datasets were normalized by dividing the instantaneous signal in each voxel at each point in the time series by the mean signal in that voxel across each scan. Next, a Gaussian filter (full‐width at half‐maximum, FWHM, of 4 mm) was applied to the data to account for intersubject variability in brain anatomy in the group‐level analyses. The functional data were regressed to a simulated hemodynamic response function for the task sequence (3Ddeconvolve). The dependent variable at this level of the analysis was the estimated β‐coefficient of the regressed time series and its associated t‐statistic. The six head motion parameters (three rotations and three translations) calculated during preprocessing were included in the general linear model as regressors of no interest.
Before the group analyses of the whole‐brain data, each participant's anatomical and functional data were coregistered and transformed to the ICBM‐152 Montreal Neurological Institute (MNI) template using the automated function in AFNI. Because intersubject registration of the cerebellum is suboptimal using this function [Diedrichsen, 2006], we used a separate normalization process for these data. Specifically, we used the SUIT toolbox [Diedrichsen, 2006] within SPM8 to normalize each participant's anatomical scan to the infratentorial template, and then used the resultant deformation maps to normalize the corresponding functional scans. The cerebellar data were then transferred to AFNI for statistical analysis.
On both the normalized whole‐brain and cerebellar datasets, we performed three separate voxel‐wise mixed‐effects ANOVAs with group as the between‐subjects factor and task (visually guided, memory‐guided) as a repeated factor. The group factor compared the BOLD signal between the MSAp and PD groups, control and MSAp groups, and control and PD groups. Given that there were no significant interactions between task and group, the reported data were collapsed across task. All functional data were corrected for Type I error using a Monte Carlo simulation (3dClustSim). Regions displaying activation had to meet a threshold of P < 0.005 and cluster size of 324 µL (P < 0.05, corrected). Voxels were considered clustered if their faces, edges, or corners touched (i.e., third‐nearest neighbor method). Anatomical guidelines from previously published literature were used to help label each activation cluster in the cerebrum [Mayka et al., 2006], basal ganglia [Prodoehl et al., 2008], and cerebellum and brainstem [Diedrichsen et al., 2009; Naidich et al., 2009].
VBM Preprocessing and Analyses
Whole‐brain VBM preprocessing and analyses were implemented in a series of six steps. In general, we followed the new segment procedure with enhanced preprocessing methods and modeling parameters [Pereira et al., 2010]. All steps were performed in SPM8 unless otherwise noted. First, in Freesurfer (http://surfer.nmr.mgh.harvard.edu/) the T1‐weighted images of each participant were skull‐stripped using the hybrid watershed algorithm and bias‐corrected using nonparametric nonuniform intensity normalization. Second, a mask was generated using AFNI to remove cerebral spinal fluid from the T1‐weighted images to minimize tissue misclassification during segmentation. Third, the preprocessed images were coregistered to the WM template provided in SPM8 to ensure that the brain origins were set to the anterior commissure prior to tissue segmentation. Fourth, new segment was used to segment the T1‐weighted images with the following modified parameters: bias regularization = 10, FWHM = 150 mm cutoff, and nonuniformity correction = OFF. Fifth, Dartel was used to normalize the images. Specifically, GM and WM were segmented and aligned to each other via rigid body transformation. A study‐specific template based on the GM and WM images of all the participants was calculated and then each participant's images were warped to the corresponding tissue type in the template using nonlinear transformation. The study‐specific template was normalized to MNI space using affine transformation, and the resultant transformation parameters were applied to the nonlinearly warped individual participant data. The normalized GM and WM images were modulated (Jacobian‐scaled) to preserve the initial volumes and then smoothed using an isotropic 8‐mm FWHM Gaussian kernel. Finally, the local GM and WM volumes were compared separately between the MSAp and PD groups, MSAp and control groups, and PD and control groups using a two‐sample t‐test in AFNI. Total GM and WM volumes for each participant were included as covariates in their respective analyses.
Cerebellar VBM preprocessing was performed in SPM8 and statistical analyses were performed in AFNI. First, the T1‐weighted image from each subject was coregistered with the SPM8 WM template to set the origin to the anterior commissure. Second, whole‐brain GM and WM segmentation maps were generated for each participant and the cerebellum was isolated from the whole brain. Third, each individual's cerebellum was warped to the SUIT template and a deformation map was created. The GM and WM segmentation maps were resampled to SUIT space using the deformation map. The normalized GM and WM images were modulated (Jacobian‐scaled) to preserve the initial volumes. The resultant GM and WM maps were analyzed between the MSAp and PD groups, control and MSAp groups, and controls and PD groups using two‐sample t‐tests in AFNI. Total cerebellar GM and WM volumes were included in their respective analyses as covariates. For both the whole‐brain and cerebellum analyses, areas of volumetric variation had to meet a statistical threshold of P < 0.005 and a minimum cluster size of 1,611 voxels for GM and 1,358 voxels for WM (P < 0.05, corrected).
RESULTS
Clinical and Demographic Data
Table 1 summarizes the clinical and demographic characteristics of each group. MMSE scores were not available for one PD patient and two controls who were tested before this measure was included in the study. Of the remaining 39 participants, all scored 24 or above on the MMSE (no cognitive impairment), except one MSAp patient who scored 22 (mild cognitive impairment) [Tombaugh and McIntyre, 1992]. Across all three groups, there were no significant differences in age (F 2,39 = 0.37, P = 0.690) or MVC (F 2,39 = 2.11, P = 0.135), and the MSAp and PD groups did not differ significantly in motor symptom duration (t 18.68 = 0.39, P = 0.699) or total UPDRS‐III scores (t 17.14 = 1.81, P = 0.089).
Table 1.
Group demographic and clinical characteristics
| Variable | MSAp | PD | Control |
|---|---|---|---|
| Sex (male/female) | 8/6 | 10/4 | 9/5 |
| Age (years) | 64.6 ± 9.0 | 64.0 ± 8.7 | 61.9 ± 8.4 |
| Handedness (right/left) | 12/2 | 13/1 | 13/1 |
| Dominant hand tested (yes/no) | 8/5 | 6/8 | 10/4 |
| MVC (N) | 56.2 ± 24.3 | 69.7 ± 16.9 | 70.2 ± 19.5 |
| MMSE | 27.4± 2.3 | 29.3 ± 1.0 | 28.7 ± 1.7 |
| Symptom duration (years) | 6.5 ± 2.7 | 5.9 ± 5.5 | N/A |
| UPDRS‐III ‐ total | 36.4 ± 13.0 | 29.6 ± 5.3 | N/A |
| UPDRS‐III ‐ axial | 13.7 ± 6.3 | 6.1 ± 2.4 | N/A |
MMSE, mini‐mental state examination; MSAp, parkinsonian variant of multiple system atrophy; MVC, maximum voluntary contraction; PD, Parkinson's disease; UPDRS‐III, motor subsection of the unified Parkinson's disease rating scale.
Data shown are sums or mean ± SD.
Force Data
Figure 2 shows the force output from a representative control, MSAp, and PD participant on one block of the visually and memory‐guided tasks. The group means and standard deviations for each of the force variables averaged across task are presented in Supporting Information Table 2. There were no significant interactions between task and group for any of the force variables (all Ps ≥ 0.439). The mean number of pulses per block did not differ significantly between the tasks (F 1,39 = 0.19, P = 0.668) or groups (F 2,39 = 1.03, P = 0.368). The effect of group on mean steady‐state force amplitude was not significant between the groups (F 2,39 = 2.03, P = 0.145), but was significant between the tasks (F 1,39 = 7.25, P = 0.010), with higher mean force amplitude in the memory‐guided task than the visually guided task. There was a between‐group difference in mean rate of force increase (F 2,39 = 4.95, P = 0.012) and decrease (F 2,39 = 12.72, P < 0.001). Post hoc tests showed that MSAp was slower than controls in reaching steady‐state force amplitude (P = 0.010) and MSAp and PD were both slower than controls in releasing force from the steady‐state amplitude back to baseline (P ≤ 0.010). Mean force duration differed between the groups (F 2,39 = 7.49, P = 0.002), with MSAp and PD producing longer pulses than controls (P ≤ 0.044). There was also an effect of task on mean force duration (F 1,39 = 4.39, P = 0.043); participants produced longer pulses during the visually guided task than the memory‐guided task. The standard deviation of the mean steady‐state force amplitudes differed between the groups (F 2,39 = 3.69, P = 0.034), such that MSAp was less variable than controls (P = 0.040). There was also an effect of task on standard deviation of the mean steady‐state force amplitude (F 1,39 = 16.65, P < 0.001); participants were more variable on the memory‐guided task than the visually guided task.
Figure 2.
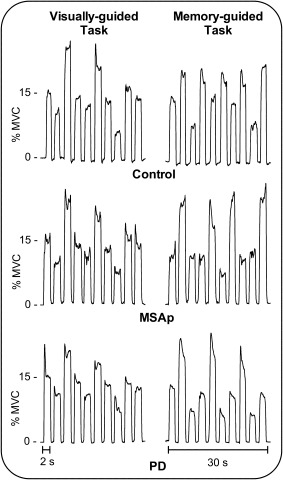
Force output from a representative control, MSAp, and PD participant on one block of the visually and memory‐guided tasks.
fMRI
Figure 3 displays the between‐group results from the whole‐brain fMRI analyses. MSAp and PD had reduced BOLD activation bilaterally in the basal ganglia, thalamus, and insula, as well as in the ipsilateral orbitofrontal cortex and contralateral M1, S1, and dorsal premotor area (PMd) compared with controls (Table 2 and Supporting Information Table 3). In addition, PD was hypoactive in bilateral pre‐SMA, ventral premotor area (PMv), hippocampus, and occipital, cingulate, temporal, and prefrontal cortices, contralateral inferior and SPLs, and ipsilateral M1, S1, and PMd (Supporting Information Table 3). When MSAp and PD were compared directly, PD had decreased activation in bilateral prefrontal, occipital, and parietal cortices, contralateral hippocampus and temporal cortex, and ipsilateral pre‐SMA, PMd, and PMv (Table 3).
Figure 3.
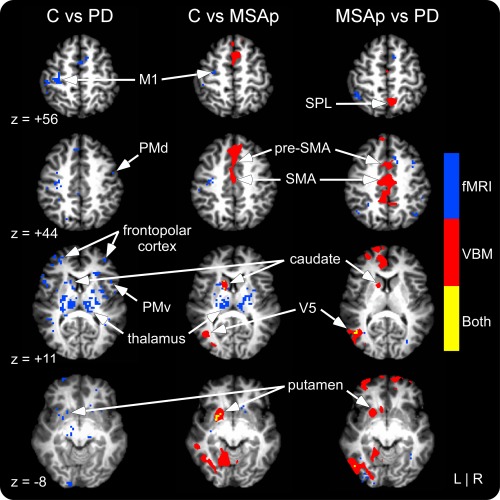
Whole‐brain fMRI and VBM gray matter results for controls versus PD, controls versus MSAp, and MSAp versus PD. fMRI differences are shown in blue, VBM in red, and areas of overlap in yellow. VBM differences shown reflect gray matter volume decreases in MSAp compared with controls and PD. fMRI differences reflect decreased activation in MSAp and PD compared with controls and PD compared with MSAp. Significant at P < 0.05, corrected. See Supporting Information Table 5 and text for information about group differences in cortical white matter volume. [Color figure can be viewed in the online issue, which is available at http://wileyonlinelibrary.com.]
Table 2.
Group fMRI activation differences in controls versus MSAp
| Cluster No. | Side | Region(s) | Size (mm3) | Peak MNI coordinate | Direction | |||
|---|---|---|---|---|---|---|---|---|
| x | y | z | F‐value | |||||
| Cortex | ||||||||
| Cluster 1 | Con | Caudate* | 459 | −14 | 20 | 2 | 35.86 | MSAp < C |
| Cluster 2 | Ipsi | Putamen*, thalamus, GPe, GPi | 1,890 | 28 | −6 | 8 | 30.79 | MSAp < C |
| Cluster 3 | Con | Thalamus*, putamen, GPe, GPi, STN, amygdala, insula | 3,618 | −14 | −10 | 8 | 28.85 | MSAp < C |
| Cluster 4 | Ipsi | Caudate* | 810 | 12 | 14 | −12 | 24.95 | MSAp < C |
| Cluster 5 | Con | Putamen* | 513 | −18 | 12 | −10 | 21.74 | MSAp < C |
| Cluster 6 | Ipsi | Orbitofrontal cortex* | 540 | 18 | 36 | −12 | 21.54 | MSAp < C |
| Cluster 7 | Ipsi | Thalamus*, STN | 567 | 10 | −24 | 0 | 18.95 | MSAp < C |
| Cluster 8 | Con | Caudate*, putamen, GPe | 756 | −20 | 12 | 12 | 18.23 | MSAp < C |
| Cluster 9 | Con | PMd*, Ml | 567 | −32 | −10 | 48 | 18.02 | MSAp < C |
| Cluster 10 | Con | S1* | 432 | −48 | −36 | 54 | 17.71 | MSAp < C |
| Cluster 11 | Ipsi | Insula*, putamen | 405 | 34 | 2 | 6 | 17.10 | MSAp < C |
| Cerebellum | ||||||||
| Cluster 1 | Con | Lobules I‐IV*, V | 360 | −20 | −36 | −19 | 34.66 | C < MSAp |
| Cluster 2 | Ipsi | Lobule VI*, crus I | 1,600 | 32 | −60 | −31 | 25.93 | MSAp < C |
| Cluster 3 | Ipsi/Median | Crus II*, lobule VIIb/Vermis crus II | 3,320 | 6 | −78 | −43 | 24.20 | MSAp < C |
| Cluster 4 | Ipsi | Lobules I‐IV*, V | 336 | 10 | −50 | −21 | 19.40 | MSAp < C |
| Cluster 5 | Ipsi | Lobule VI*, crus I | 336 | 16 | −74 | −21 | 19.16 | MSAp < C |
| Cluster 6 | Median | Vermis VI* | 400 | 4 | −68 | −17 | 16.21 | MSAp < C |
| Cluster 7 | Con | Lobule VI*, crus I | 528 | −34 | −70 | −23 | 15.82 | MSAp < C |
Con, contralateral; GPe, external globus pallidus; GPi, internal globus pallidus; Ipsi, ipsilateral; M1, primary motor cortex; MSAp, parkinsonian variant of multiple system atrophy; PD, Parkinson's disease; PMd, dorsal premotor area; S1, primary somatosensory cortex; STN, subthalamic nucleus. All clusters signficant at P < 0.05, corrected.
Region at peak coordinate is noted with an asterisk.
Table 3.
Group fMRI activation differences in MSAp versus PD
| Cluster No. | Side | Region(s) | Size (mm3) | Peak MNI coodinate | Direction | |||
|---|---|---|---|---|---|---|---|---|
| x | y | z | F‐value | |||||
| Cortex | ||||||||
| Cluster 1 | Ipsi | PMd* | 351 | 36 | 6 | 42 | 28.78 | PD < MSAp |
| Cluster 2 | Ipsi | Inferior parietal lobule* | 540 | 54 | −40 | 42 | 28.72 | PD < MSAp |
| Cluster 3 | Con | Supramarginal gyrus*, angular gyrus | 432 | −56 | −48 | 32 | 28.12 | PD < MSAp |
| Cluster 4 | Ipsi | Pre‐SMA* | 864 | 12 | 14 | 48 | 27.18 | PD < MSAp |
| Cluster 5 | Con | Middle temporal gyrus*, V5 | 567 | −48 | −60 | 12 | 24.37 | PD < MSAp |
| Cluster 6 | Con | Hippocampus* | 351 | −18 | −34 | 6 | 23.35 | PD < MSAp |
| Cluster 7 | Con | Middle occipital gyrus*, inferior occipital gyrus (V3v/V4) | 918 | −36 | −88 | 2 | 22.86 | PD < MSAp |
| Cluster 8 | Con | Angular gyrus* | 459 | −48 | −58 | 32 | 22.44 | PD < MSAp |
| Cluster 10 | Con | Dorsolateral prefrontal cortex* | 405 | −32 | 30 | 30 | 21.40 | PD < MSAp |
| Cluster 11 | Ipsi | Angular gyrus*, inferior parietal lobule | 378 | 46 | −66 | 36 | 21.11 | PD < MSAp |
| Cluster 12 | Con | Angular gyrus*, inferior parietal lobule, superior parietal lobule | 324 | −32 | −48 | 36 | 20.93 | PD < MSAp |
| Cluster 13 | Ipsi | Middle occipital gyrus* | 486 | 34 | −82 | 6 | 19.27 | PD < MSAp |
| Cluster 14 | Con | Calcarine gyrus (V1/V2)* | 324 | −26 | −96 | 0 | 18.99 | PD < MSAp |
| Cluster 15 | Ipsi | PMv* | 486 | 46 | 0 | 18 | 18.46 | PD < MSAp |
| Cluster 16 | Ipsi | Dorsolateral prefrontal cortex* | 324 | 36 | 32 | 24 | 17.44 | PD < MSAp |
| Cluster 17 | Ipsi | Fusiform gyrus* | 351 | 34 | −54 | −6 | 15.69 | PD < MSAp |
| Cluster 18 | Ipsi | Frontopolar cortex* | 378 | 36 | 50 | 2 | 14.47 | PD < MSAp |
| Cluster 19 | Ipsi | Middle occipital gyrus*, V5 | 324 | 52 | −72 | 2 | 14.21 | PD < MSAp |
| Cluster 20 | Con | Inferior parietal lobule* | 324 | −50 | −42 | 56 | 14.18 | PD < MSAp |
| Cluster 21 | Con | Inferior temporal gyrus* | 324 | −44 | −58 | −12 | 14.15 | PD < MSAp |
| Cerebellum | ||||||||
| Cluster 1 | Con | Lobules I‐IV* | 984 | −16 | −36 | −20 | 26.06 | PD < MSAp |
| Cluster 2 | Con | Lobule VI* | 456 | −34 | −54 | −30 | 15.15 | PD < MSAp |
| Cluster 3 | Ipsi | Crus II* | 480 | 22 | −86 | −42 | 14.72 | MSAp < PD |
Con, contralateral; Ipsi, ipsilateral; M1, primary motor cortex; MSAp, parkinsonian variant of multiple system atrophy; PD, Parkinson's disease; PMd, dorsal premotor area; PMv, ventral premotor area; S1, primary somatosensory cortex, SMA, supplementary motor area. All clusters signficant at P < 0.05, corrected.
Region at peak coordinate is noted with an asterisk.
The between‐group differences from the cerebellar fMRI analyses are shown in Figure 4. Compared with controls, MSAp was hypoactive in the vermis, bilateral lobule VI/crus I, and ipsilateral lobules I–IV/V and crus II/lobule VIIb, and hyperactive in contralateral lobules I–IV (Table 2). PD had reduced activation in the vermis, lobules I–IV, VI, crus I, crus II/lobule VIIb, and ipsilateral lobule V and dentate region compared with controls (Supporting Information Table 3). When the disease groups were compared directly, MSAp had reduced activation in ipsilateral crus II and increased activation in contralateral lobules I–IV and VI (Table 3).
Figure 4.
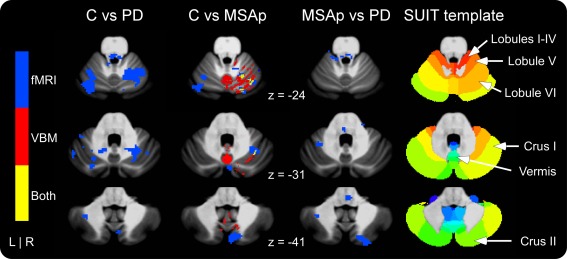
Cerebellar fMRI and VBM gray matter differences in controls versus PD, controls versus MSAp, and MSAp versus PD. fMRI differences are shown in blue, VBM in red, and areas of overlap in yellow. Note that the only VBM differences were decreases in MSAp compared with controls. fMRI differences reflect decreased activation in PD and MSAp compared with controls. See Table 3 for the directions of activation differences between MSAp and PD. Significant at P < 0.05, corrected. [Color figure can be viewed in the online issue, which is available at http://wileyonlinelibrary.com.]
VBM
The between‐group whole‐brain GM results are shown in Figure 3 and reported in Supporting Information Table 4. MSAp had reduced GM volume in the contralateral caudate, putamen, and occipital cortex, ipsilateral dorsomedial prefrontal cortex, and bilateral pre‐SMA, SMA, middle cingulate cortex, and temporal cortex compared with controls. There were no significant differences in GM volume between PD and controls. Compared with PD, MSAp had reduced GM volume in bilateral pre‐SMA, SMA, and cingulate, frontopolar, occipital, and temporal cortices, contralateral caudate and putamen, and ipsilateral SPL.
The cerebellar GM areas that differed significantly between the groups are shown in Figure 4 and listed in Supporting Information Table 4. Compared with controls, MSAp had reduced GM volume in bilateral lobules V and VIIb, vermis, and ipsilateral lobules I–IV, VI, VIIIa, IX, and crus I and II. There were no group differences in cerebellar GM volume between controls and PD or MSAp and PD.
Supporting Information Table 5 lists the WM areas that differed significantly between the groups. In the cerebrum, MSAp had reduced WM volume in contralateral dorsomedial/frontopolar prefrontal cortex, ipsilateral temporal pole, and bilateral occipital cortex, and increased WM volume in contralateral motor cortex (i.e., PMv, M1, PMd) compared with controls. There were no significant differences in cortical WM between PD and controls or MSAp and PD. In the cerebellum analyses, MSAp had reduced WM volume bilaterally in the vicinity of the dentate, middle cerebellar peduncle, inferior cerebellar peduncle, and pons compared with controls and in the vicinity of the dentate, middle cerebellar peduncle, pons, and contralateral inferior cerebellar peduncle compared with PD (Fig. 5). There were no significant differences in cerebellar WM volume between PD and controls.
Figure 5.
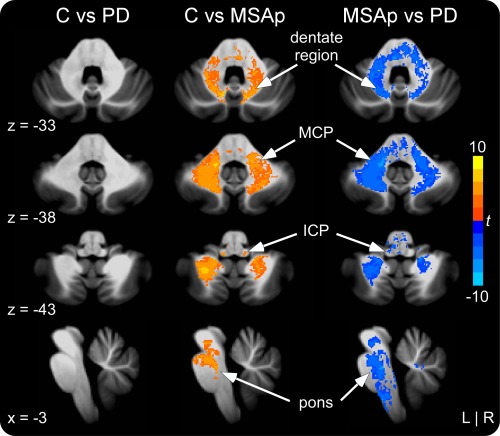
Cerebellar and brainstem VBM white matter differences in controls versus PD, controls versus MSAp, and MSAp versus PD. MSAp had reduced volume in the vicinity of the dentate nucleus, middle cerebellar peduncle (MCP), inferior cerebellar peduncle (ICP), and pons compared with controls and PD. There were no volumetric differences in the cerebellar white matter between PD and controls. Significant at P < 0.05, corrected. [Color figure can be viewed in the online issue, which is available at http://wileyonlinelibrary.com.]
Overlap Between fMRI and VBM
The whole‐brain analyses revealed overlapping GM volume and fMRI activation reductions in the contralateral caudate and putamen of MSAp compared with controls (Fig. 3). In the cerebellum analyses, MSAp had reduced GM and activation primarily in ipsilateral lobule VI, but also in lobules I–V, VIIb, vermis VI, and crus II compared with controls (Fig. 4). When compared with PD, MSAp had reduced GM and increased activation in an area of the contralateral middle temporal gyrus (V5; Fig. 3).
DISCUSSION
This study provided three main findings to support our hypothesis that MSAp involves both functional and macrostructural brain changes, whereas PD involves primarily functional changes. First, MSAp and PD had reduced BOLD fMRI activation in the basal ganglia, thalamus, insula, primary sensorimotor and prefrontal cortices, and cerebellum compared with controls. Second, there were no fMRI differences between MSAp and PD in the basal ganglia, thalamus, insula, or primary sensorimotor cortices, but PD had more activation deficits throughout associative motor, prefrontal, parietal, occipital, and temporal areas compared with MSAp and controls. Third, MSAp had extensive volume loss in areas including the basal ganglia, cerebrum, middle and inferior cerebellar peduncles, and pons compared with controls and PD, and additionally in the cerebellar cortex and vermis compared with controls. There were no significant volumetric reductions in PD compared with controls. Collectively, these results provide the first evidence that fMRI activation is abnormal in the basal ganglia, cerebellum, and cerebrum in MSAp, and that a key distinguishing feature between MSAp and PD is the widespread volume loss throughout the brain in MSAp.
Given the established pattern of pathology in the basal ganglia of PD and MSAp, it was important to assess functional differences in these nuclei. Previous research using PET has revealed reduced striatal presynaptic uptake and binding, glucose metabolism, and postsynaptic binding in both MSAp and PD [Bohnen et al., 2006; Ghaemi et al., 2002], but greater metabolic and postsynaptic binding reductions in MSAp compared with PD [Ghaemi et al., 2002]. A recent PET study also revealed reduced putaminal metabolism in MSAp compared with PD, but not controls, during a joystick hand movement task [Payoux et al., 2010]. Given that the joystick task did not activate the putamen in MSAp, PD, or controls, it may not be optimal for investigating between‐group differences in this region. In this study, we used a precision grip force task that has revealed reduced fMRI activation in the basal ganglia of PD across multiple previous studies [Prodoehl et al., 2010; Spraker et al., 2010]. Here we showed that MSAp and PD had reduced activation bilaterally in the caudate, putamen, external globus pallidus, and internal globus pallidus, and additionally in the subthalamic nucleus of PD. There were no significant differences between MSAp and PD in the basal ganglia, providing the first evidence using fMRI that these nuclei are similarly underactivated in both diseases during a precision grip force task.
In the cerebrum, we observed reduced activation in contralateral M1 of PD compared with controls, which is consistent with previous fMRI research [Buhmann et al., 2003; Herz et al., 2013; Prodoehl et al., 2010; Spraker et al., 2010]. We extended these findings by showing that the same effect occurs for MSAp compared with controls, and that there was no difference between MSAp and PD in M1. However, PD did differ significantly from controls and MSAp in several areas of the association cortex. In particular, there was reduced activation in bilateral IPC, dorsolateral prefrontal cortex, occipital cortex, temporal cortex, SPL, and ipsilateral pre‐SMA, PMd, and PMv of PD compared with MSAp. The reduced activation in occipital area V5 of PD may reflect deficits in processing the dynamic feedback in the visually guided task. Previous research in healthy individuals has shown that V5 is activated during motor tasks involving visual feedback [Coombes et al., 2011; Debaere et al., 2004]. Moreover, PD patients exhibit deficits in visual motion processing [Trick et al., 1994] and reduced V5 activation in response to visual motion, such as optic flow [Putcha et al., 2014]. Despite the greater cortical atrophy in MSAp compared with PD, which is discussed later, the current results suggest that MSAp patients are able to activate the remaining cortical tissue to a greater extent than PD, perhaps due to compensation, to complete the precision grip force task successfully. An important next step will be to determine whether there comes a point when atrophy is so prominent in MSAp that activation deficits emerge.
Another study that examined task‐related functional changes in MSAp using PET during joystick movements only found two cortical areas that differed between MSAp and PD, namely increased activation in the superior parietal cortex and SMA of MSAp [Payoux et al., 2010]. It is important to note that a recent meta‐analysis of motor task‐based fMRI and PET studies found that, while activation differed consistently in the pre‐SMA, SPL, and IPC between PD and controls, the direction of these differences did not [Herz et al., 2013]. As such, relative increases and decreases in the cerebrum may depend on the task used, which may explain the more extensive differences observed in this study. Although there are no prior task‐based fMRI studies in MSAp, resting‐state fMRI in MSA has shown reduced regional homogeneity of the spontaneous BOLD fluctuations in areas including left M1, posterior cingulate cortex, prefrontal cortex, and right inferior parietal lobule compared with controls [You et al., 2011].
PET research has shown that the cerebellum is a node in the abnormal metabolic patterns of both MSAp and PD [Poston et al., 2012], with cerebellar FDG metabolism decreased in MSAp and increased in PD. Consistent with these findings, PET during a joystick hand movement task revealed reduced activation in the bilateral cerebellum of MSA compared with controls and PD, and increased activation in the ipsilateral cerebellum of PD compared with controls [Payoux et al., 2010]. Previous motor task‐based fMRI studies have also reported increased cerebellar activation in PD patients chronically treated with levodopa [Yu et al., 2007], but no significant increases or reductions in early‐stage de novo patients [Spraker et al., 2010]. Increased cerebellar activation in more severely affected PD is commonly considered to be a compensatory mechanism in response to the dysfunctional basal ganglia [Lewis et al., 2013; Wu and Hallett, 2013]. In this study, we observed reduced activation in the bilateral cerebellum of moderate PD patients compared with controls. Several of the areas we found to be reduced in PD (i.e., lobules V, VI, VIIb, vermis VI, crus I/II) have been shown previously to scale with the rate and amplitude of force production in healthy individuals [Spraker et al., 2012]. In MSAp, there was reduced activation primarily ipsilateral to the hand producing force compared with controls, as well as an area of increased activation in contralateral lobules I–IV/V. When compared with PD, MSAp had increased activation in contralateral lobules I–IV and VI and decreased activation in ipsilateral crus II. If cerebellar activation in PD is compensatory for basal ganglia dysfunction, then it is possible that compensation has yet to occur in the cohort studied here. To gain a better understanding of cerebellar function in MSAp and PD, it will be necessary to study the same cohorts of patients longitudinally using the same task and cerebellar‐specific normalization procedures.
The widespread atrophy in MSAp and preserved brain volume in PD are largely consistent with the literature. In the basal ganglia, we found reduced GM volume in the putamen and caudate of MSAp compared with controls and PD. Pathologically, the putamen is one of the most severely affected structures in MSAp, with the caudate exhibiting mild to moderate cell loss and/or gliosis [Ozawa et al., 2004; Wenning et al., 1997]. Volume‐based MRI studies have also found atrophy in these areas [Baudrexel et al., 2013; Brenneis et al., 2003; Ghaemi et al., 2002; Messina et al., 2011; Minnerop et al., 2007; Schulz et al., 1999; Shigemoto et al., 2013; Tir et al., 2009; Tzarouchi et al., 2010]. In PD, we did not find significant volume loss in the striatum, which is consistent with pathology [Dickson, 2012] and previous volumetric MRI studies [Cordato et al., 2005; Ghaemi et al., 2002; Melzer et al., 2012; Messina et al., 2011; Paviour et al., 2006; Schulz et al., 1999; Tir et al., 2009].
Pathological changes in the cerebrum of MSAp are most consistent and severe in motor areas such as M1 and SMA [Dickson, 2012; Mochizuki et al., 2008; Papp and Lantos, 1994; Spargo et al., 1996; Su et al., 2001]. VBM has revealed reduced volume in cortical motor areas of MSAp [Brenneis et al., 2003; Minnerop et al., 2007; Tir et al., 2009; Tzarouchi et al., 2010], and suggests that cortical atrophy is more prominent in the later stages of disease [Brenneis et al., 2007]. Consistent with these findings, we found volume loss throughout the cerebrum, including motor areas, in MSAp patients who had probable disease diagnoses and mean symptom onset durations of over 6 years. There was also increased WM volume in contralateral M1 of MSAp compared with controls, which may reflect a reduction in adjacent GM. In PD, pathological changes in the cerebrum are not evident until the later stages of disease, starting in temporal and paralimbic areas and eventually reaching primary sensory and premotor areas [Braak et al., 2004]. In general, VBM has shown either no significant cortical differences between cognitively intact PD patients and controls [Beyer et al., 2007; Brenneis et al., 2003; Camicioli et al., 2009; Dalaker et al., 2010; Melzer et al., 2012; Menke et al., 2014; Price et al., 2004; Prodoehl et al., 2013; Tessitore et al., 2012], or reduced volume in a few areas that differ across studies [Cordato et al., 2005; Martin et al., 2009; Nagano‐Saito et al., 2005; Pereira et al., 2012; Summerfield et al., 2005; Tir et al., 2009]. Moreover, the studies that reported cortical atrophy in PD tended to have older participants (70s) than those that found no differences, including this study.
In MSAp, there are pathological changes in the pons, cerebellar vermis and hemispheres, and middle cerebellar peduncle [Ozawa et al., 2004; Papp et al., 1989; Wenning et al., 1996, 1997], which have been corroborated by VBM [Minnerop et al., 2007; Shigemoto et al., 2013; Tzarouchi et al., 2010]. In addition to observing volumetric reductions in these areas, this study found reduced WM volume in the dentate nucleus region and inferior cerebellar peduncle, which is not supported by postmortem or previous VBM research. Nevertheless, atrophy has been reported in the dentate using conventional MRI [Schrag et al., 2000], and myelin pallor has been described in the inferior cerebellar peduncle [Konagaya et al., 1999]. The current results suggest that both sources of afferent input to the cerebellum, namely the middle and inferior cerebellar peduncles, undergo degenerative changes in MSAp. In PD, we showed that the pons and cerebellum were preserved, which is consistent with previous VBM studies [Beyer et al., 2007; Brenneis et al., 2003; Cordato et al., 2005; Dalaker et al., 2010; Martin et al., 2009; Messina et al., 2011; Nagano‐Saito et al., 2005; Price et al., 2004; Prodoehl et al., 2013; Summerfield et al., 2005; Tessitore et al., 2012; Tir et al., 2009]. However, there is some evidence that cerebellar GM volume is reduced in pharmacologically treated tremor‐dominant compared with nontremor‐dominant PD patients [Benninger et al., 2009], as well as in older PD patients (70s) when the data are normalized to a cerebellum‐specific template [Camicioli et al., 2009]. Interestingly, we found reduced cerebellar GM volume in MSAp compared with controls, but not in MSAp compared with PD, or PD compared with controls. This pattern suggests that there may be reduced cerebellar GM volume in PD that did not reach significance. Further research is needed to determine whether macrostructural changes in the cerebellum of PD are related to subtype and/or age.
Previous behavioral work using precision grip force tasks have found that MSAp and moderate PD patients produce longer pulses and are slower to increase to and decrease from the target amplitude than controls, but do not differ from controls in mean MVC, force amplitude, or number of pulses [Neely et al., 2012]. Early‐stage de novo PD patients also have been shown to produce longer pulses and take longer to reach the target force amplitude and release back to baseline than controls [Spraker et al., 2010]. Our results are consistent with these findings, with the exception that the PD patients were not significantly slower reaching the target force amplitude than controls. It is possible that releasing force is a more robust measure than increasing force when examining bradykinesia in PD [Corcos et al., 1996]. Although mean force duration differed between the patient and control groups, this is unlikely to account for the fMRI results. Previous research has shown that force duration is correlated positively with BOLD signal volume in the lateral cerebellum and several regions of the basal ganglia and motor cortex in healthy individuals [Vaillancourt et al., 2004]. However, the patients groups in this study produced longer pulses and generally had reduced fMRI activation in these regions compared with the control group.
There are a few limitations of this study that are important to highlight. First, patients were diagnosed using probabilistic criteria by a specialist in movement disorders. Although this provides the highest level of diagnostic accuracy during life [Hughes et al., 2002], it is possible that our results may differ if diagnoses were based retroactively on definite criteria (i.e., neuropathological confirmation). Second, patients were tested following an overnight withdrawal from anti‐parkinsonian medications. Given the long half‐life of certain medications (e.g., amantadine), some patients may not have been completely in the off medication state during the session. Nevertheless, it is unlikely that this affected the group results since comparable numbers of MSAp and PD patients were taking these medications (see Supporting Information Table 1). Moreover, the moderate PD patients in this study showed similar behavioral and fMRI deficits as early‐stage de novo PD patients [Spraker et al., 2010]. Third, group differences in local brain volume were assessed across the whole brain using VBM. In terms of subcortical areas, research has shown that current VBM procedures are suitable for detecting volumetric differences in the caudate and putamen, but not the globus pallidus [Focke et al., 2014]. This may explain, in part, why we did not observe reduced pallidal volume in MSAp, despite the fact that this area exhibits mild to severe pathology in most MSAp patients [Ozawa et al., 2004; Wenning et al., 1997].
In summary, this study provided the first characterization of task‐based fMRI changes across the whole brain in MSAp. We showed that MSAp and PD had similar fMRI changes compared with controls in the bilateral basal ganglia, thalamus, and insula, ipsilateral cerebellum, and contralateral M1/S1 and PMd during a precision grip force task, but that PD had additional activation reductions in the contralateral cerebellum and throughout the cerebrum. We also confirmed using VBM that there is widespread atrophy in the basal ganglia, thalamus, cerebrum, cerebellum, and pons in MSAp, and relatively preserved local brain volume in PD, which is a key distinguishing feature between the diseases. Collectively, fMRI and VBM revealed that the caudate, putamen, and cerebellar and occipital cortices have overlapping functional and macrostructural changes in MSAp. Future research using a multimodal neuroimaging approach is needed to further elucidate the complex patterns of functional and structural changes in MSAp and PD, as well as their evolutions.
Supporting information
Supplementary Information
ACKNOWLEDGMENTS
The authors would like to thank the participants and their families for their time and commitment to this research.
REFERENCES
- Baudrexel S, Seifried C, Penndorf B, Klein JC, Middendorp M, Steinmetz H, Grünwald F, Hilker R (2013): The value of putaminal diffusion imaging versus 18‐fluorodeoxyglucose positron emission tomography for the differential diagnosis of the Parkinson variant of multiple system atrophy. Mov Disord 29:380–387. [DOI] [PubMed] [Google Scholar]
- Benninger DH, Thees S, Kollias SS, Bassetti CL, Waldvogel D (2009): Morphological differences in Parkinson's disease with and without rest tremor. J Neurol, 256:256–263. [DOI] [PubMed] [Google Scholar]
- Beyer MK, Janvin CC, Larsen JP, Aarsland D (2007): A magnetic resonance imaging study of patients with Parkinson's disease with mild cognitive impairment and dementia using voxel‐based morphometry. J Neurol Neurosurg Psychiatry 78:254–259. [DOI] [PMC free article] [PubMed] [Google Scholar]
- Bohnen NI, Albin RL, Koeppe RA, Wernette KA, Kilbourn MR, Minoshima S, Frey KA (2006): Positron emission tomography of monoaminergic vesicular binding in aging and Parkinson disease. J Cereb Blood Flow Metab 26:1198–1212. [DOI] [PubMed] [Google Scholar]
- Braak H, Ghebremedhin E, Rüb U, Bratzke H, Del Tredici K (2004): Stages in the development of Parkinson's disease‐related pathology. Cell Tissue Res 318:121–134. [DOI] [PubMed] [Google Scholar]
- Brenneis C, Seppi K, Schocke MF, Müller J, Luginger E, Bösch S, Löscher WN, Büchel C, Poewe W, Wenning GK (2003): Voxel‐based morphometry detects cortical atrophy in the Parkinson variant of multiple system atrophy. Mov Disord 18:1132–1138. [DOI] [PubMed] [Google Scholar]
- Brenneis C, Egger K, Scherfler C, Seppi K, Schocke M, Poewe W, Wenning GK (2007): Progression of brain atrophy in multiple system atrophy. A longitudinal VBM study. J Neurol 254:191–196. [DOI] [PubMed] [Google Scholar]
- Buhmann C, Glauche V, Stürenburg HJ, Oechsner M, Weiller C, Büchel C (2003): Pharmacologically modulated fMRI–cortical responsiveness to levodopa in drug‐naive hemiparkinsonian patients. Brain 126:451–461. [DOI] [PubMed] [Google Scholar]
- Camicioli R, Gee M, Bouchard TP, Fisher NJ, Hanstock CC, Emery DJ, Martin WR (2009): Voxel‐based morphometry reveals extra‐nigral atrophy patterns associated with dopamine refractory cognitive and motor impairment in parkinsonism. Parkinsonism Relat Disord 15:187–195. [DOI] [PubMed] [Google Scholar]
- Coombes SA, Corcos DM, Vaillancourt DE (2011): Spatiotemporal tuning of brain activity and force performance. Neuroimage 54:2226–2236. [DOI] [PMC free article] [PubMed] [Google Scholar]
- Coombes SA, Corcos DM, Pavuluri MN, Vaillancourt DE (2012): Maintaining force control despite changes in emotional context engages dorsomedial prefrontal and premotor cortex. Cereb Cortex 22:616–627. [DOI] [PMC free article] [PubMed] [Google Scholar]
- Corcos DM, Chen CM, Quinn NP, McAuley J, Rothwell JC (1996): Strength in Parkinson's disease: Relationship to rate of force generation and clinical status. Ann Neurol 39:79–88. [DOI] [PubMed] [Google Scholar]
- Cordato NJ, Duggins AJ, Halliday GM, Morris JG, Pantelis C (2005): Clinical deficits correlate with regional cerebral atrophy in progressive supranuclear palsy. Brain 128:1259–1266. [DOI] [PubMed] [Google Scholar]
- Dalaker TO, Zivadinov R, Larsen JP, Beyer MK, Cox JL, Alves G, Bronnick K, Tysnes OB, Antulov R, Dwyer MG, Aarsland D (2010): Gray matter correlations of cognition in incident Parkinson's disease. Mov Disord 25:629–633. [DOI] [PubMed] [Google Scholar]
- Debaere F, Wenderoth N, Sunaert S, Van Hecke P, Swinnen SP (2004): Changes in brain activation during the acquisition of a new bimanual coordination task. Neuropsychologia 42:855–867. [DOI] [PubMed] [Google Scholar]
- Dickson DW (2012): Parkinson's disease and parkinsonism: Neuropathology. Cold Spring Harb Perspect Med, 2. [DOI] [PMC free article] [PubMed]
- Diedrichsen J (2006): A spatially unbiased atlas template of the human cerebellum. Neuroimage 33:127–138. [DOI] [PubMed] [Google Scholar]
- Diedrichsen J, Balsters JH, Flavell J, Cussans E, Ramnani N (2009): A probabilistic MR atlas of the human cerebellum. Neuroimage 46:39–46. [DOI] [PubMed] [Google Scholar]
- Focke NK, Trost S, Paulus W, Falkai P, Gruber O (2014): Do manual and voxel‐based morphometry measure the same? A proof of concept study. Front Psychiatry 5:39. doi: 10.3389/fpsyt.2014.00039. [DOI] [PMC free article] [PubMed] [Google Scholar]
- Folstein MF, Folstein SE, McHugh PR (1975): “Mini‐mental state”. A practical method for grading the cognitive state of patients for the clinician. J Psychiatr Res 12:189–198. [DOI] [PubMed] [Google Scholar]
- Gelb DJ, Oliver E, Gilman S (1999): Diagnostic criteria for Parkinson disease. Arch Neurol 56:33–39. [DOI] [PubMed] [Google Scholar]
- Ghaemi M, Hilker R, Rudolf J, Sobesky J, Heiss WD (2002): Differentiating multiple system atrophy from Parkinson's disease: Contribution of striatal and midbrain MRI volumetry and multi‐tracer PET imaging. J Neurol Neurosurg Psychiatry 73:517–523. [DOI] [PMC free article] [PubMed] [Google Scholar]
- Gilman S, Low PA, Quinn N, Albanese A, Ben‐Shlomo Y, Fowler CJ, Kaufmann H, Klockgether T, Lang AE, Lantos PL, Litvan I, Mathias CJ, Oliver E, Robertson D, Schatz I, Wenning GK (1999): Consensus statement on the diagnosis of multiple system atrophy. J Neurol Sci 163:94–98. [DOI] [PubMed] [Google Scholar]
- Gilman S, Wenning GK, Low PA, Brooks DJ, Mathias CJ, Trojanowski JQ, Wood NW, Colosimo C, Dürr A, Fowler CJ, Kaufmann H, Klockgether T, Lees A, Poewe W, Quinn N, Revesz T, Robertson D, Sandroni P, Seppi K, Vidailhet M, (2008): Second consensus statement on the diagnosis of multiple system atrophy. Neurology 71:670–676. [DOI] [PMC free article] [PubMed] [Google Scholar]
- Herz DM, Eickhoff SB, Løkkegaard A, Siebner HR (2013): Functional neuroimaging of motor control in Parkinson's disease: A meta‐analysis. Hum Brain Mapp 35:3227–3237. [DOI] [PMC free article] [PubMed] [Google Scholar]
- Hughes AJ, Ben‐Shlomo Y, Daniel SE, Lees AJ (2001): What features improve the accuracy of clinical diagnosis in Parkinson's disease: A clinicopathologic study. 1992. Neurology 57:S34–S38. [PubMed] [Google Scholar]
- Hughes AJ, Daniel SE, Ben‐Shlomo Y, Lees AJ (2002): The accuracy of diagnosis of parkinsonian syndromes in a specialist movement disorder service. Brain 125:861–870. [DOI] [PubMed] [Google Scholar]
- Konagaya M, Sakai M, Matsuoka Y, Konagaya Y, Hashizume Y (1999): Multiple system atrophy with remarkable frontal lobe atrophy. Acta Neuropathol 97:423–428. [DOI] [PubMed] [Google Scholar]
- Lewis MM, Galley S, Johnson S, Stevenson J, Huang X, McKeown MJ (2013): The role of the cerebellum in the pathophysiology of Parkinson's disease. Can J Neurol Sci 40:299–306. [DOI] [PMC free article] [PubMed] [Google Scholar]
- Litvan I, Goetz CG, Jankovic J, Wenning GK, Booth V, Bartko JJ, McKee A, Jellinger K, Lai EC, Brandel JP, Verny M, Chaudhuri KR, Pearce RK, Agid Y (1997): What is the accuracy of the clinical diagnosis of multiple system atrophy? A clinicopathologic study. Arch Neurol 54:937–944. [DOI] [PubMed] [Google Scholar]
- Martin WR, Wieler M, Gee M, Camicioli R (2009): Temporal lobe changes in early, untreated Parkinson's disease. Mov Disord 24:1949–1954. [DOI] [PubMed] [Google Scholar]
- Mayka MA, Corcos DM, Leurgans SE, Vaillancourt DE (2006): Three‐dimensional locations and boundaries of motor and premotor cortices as defined by functional brain imaging: A meta‐analysis. Neuroimage 31:1453–1474. [DOI] [PMC free article] [PubMed] [Google Scholar]
- Melzer TR, Watts R, MacAskill MR, Pitcher TL, Livingston L, Keenan RJ, Dalrymple‐Alford JC, Anderson TJ (2012): Grey matter atrophy in cognitively impaired Parkinson's disease. J Neurol Neurosurg Psychiatry 83:188–194. [DOI] [PubMed] [Google Scholar]
- Menke RAL, Szewczyk‐Krolikowski K, Jbabdi S, Jenkinson M, Talbot K, Mackay CE, Hu M (2014): Comprehensive morphometry of subcortical grey matter structures in early‐stage Parkinson's disease. Hum Brain Mapp 35:1681–1690. [DOI] [PMC free article] [PubMed] [Google Scholar]
- Messina D, Cerasa A, Condino F, Arabia G, Novellino F, Nicoletti G, Salsone M, Morelli M, Lanza PL, Quattrone A (2011): Patterns of brain atrophy in Parkinson's disease, progressive supranuclear palsy and multiple system atrophy. Parkinsonism Relat Disord 17:172–176. [DOI] [PubMed] [Google Scholar]
- Minnerop M, Specht K, Ruhlmann J, Schimke N, Abele M, Weyer A, Wüllner U, Klockgether T (2007): Voxel‐based morphometry and voxel‐based relaxometry in multiple system atrophy‐a comparison between clinical subtypes and correlations with clinical parameters. Neuroimage 36:1086–1095. [DOI] [PubMed] [Google Scholar]
- Mochizuki Y, Mizutani T, Warabi Y, Shimizu T, Isozaki E (2008): The somatosensory cortex in multiple system atrophy. J Neurol Sci 271:174–179. [DOI] [PubMed] [Google Scholar]
- Nagano‐Saito A, Washimi Y, Arahata Y, Kachi T, Lerch JP, Evans AC, Dagher A, Ito K (2005): Cerebral atrophy and its relation to cognitive impairment in Parkinson disease. Neurology 64:224–229. [DOI] [PubMed] [Google Scholar]
- Naidich TP, Duvernoy HM, Delman BN, Sorensen AG, Kollias SS, Haacke EM (2009): Duvernoy's Atlas of the Human Brain Stem and Cerebellum: High‐Field MRI, Surface Anatomy, Internal Structure, Vascularization and 3D Sectional Anatomy. Wien: Springer‐Verlag. [Google Scholar]
- Neely KA, Planetta PJ, Prodoehl J, Corcos DM, Comella CL, Goetz CG, Shannon KL, Vaillancourt DE (2012): Force control deficits in individuals with Parkinson's disease, multiple systems atrophy, and progressive supranuclear palsy. PLoS One 8:e58403. [DOI] [PMC free article] [PubMed] [Google Scholar]
- Ozawa T, Paviour D, Quinn NP, Josephs KA, Sangha H, Kilford L, Healy DG, Wood NW, Lees AJ, Holton JL, Revesz T (2004): The spectrum of pathological involvement of the striatonigral and olivopontocerebellar systems in multiple system atrophy: Clinicopathological correlations. Brain 127:2657–2671. [DOI] [PubMed] [Google Scholar]
- Papp MI, Lantos PL (1994): The distribution of oligodendroglial inclusions in multiple system atrophy and its relevance to clinical symptomatology. Brain 117 (Pt 2):235–243. [DOI] [PubMed] [Google Scholar]
- Papp MI, Kahn JE, Lantos PL (1989): Glial cytoplasmic inclusions in the CNS of patients with multiple system atrophy (striatonigral degeneration, olivopontocerebellar atrophy and Shy‐Drager syndrome). J Neurol Sci 94:79–100. [DOI] [PubMed] [Google Scholar]
- Paviour DC, Price SL, Jahanshahi M, Lees AJ, Fox NC (2006): Regional brain volumes distinguish PSP, MSA‐P, and PD: MRI‐based clinico‐radiological correlations. Mov Disord 21:989–996. [DOI] [PubMed] [Google Scholar]
- Payoux P, Brefel‐Courbon C, Ory‐Magne F, Regragui W, Thalamas C, Balduyck S, Durif F, Azulay JP, Tison F, Blin O, Esquerre JP, Rascol O (2010): Motor activation in multiple system atrophy and Parkinson disease: A PET study. Neurology 75:1174–1180. [DOI] [PubMed] [Google Scholar]
- Pereira JB, Ibarretxe‐Bilbao N, Marti MJ, Compta Y, Junqué C, Bargallo N, Tolosa E (2012): Assessment of cortical degeneration in patients with Parkinson's disease by voxel‐based morphometry, cortical folding, and cortical thickness. Hum Brain Mapp 33:2521–2534. [DOI] [PMC free article] [PubMed] [Google Scholar]
- Pereira JM, Xiong L, Acosta‐Cabronero J, Pengas G, Williams GB, Nestor PJ (2010): Registration accuracy for VBM studies varies according to region and degenerative disease grouping. Neuroimage 49:2205–2215. [DOI] [PubMed] [Google Scholar]
- Poston KL, Tang CC, Eckert T, Dhawan V, Frucht S, Vonsattel JP, Fahn S, Eidelberg D (2012): Network correlates of disease severity in multiple system atrophy. Neurology 78:1237–1244. [DOI] [PMC free article] [PubMed] [Google Scholar]
- Price S, Paviour D, Scahill R, Stevens J, Rossor M, Lees A, Fox N (2004): Voxel‐based morphometry detects patterns of atrophy that help differentiate progressive supranuclear palsy and Parkinson's disease. Neuroimage 23:663–669. [DOI] [PubMed] [Google Scholar]
- Prodoehl J, Yu H, Little DM, Abraham I, Vaillancourt DE (2008): Region of interest template for the human basal ganglia: Comparing EPI and standardized space approaches. Neuroimage 39:956–965. [DOI] [PMC free article] [PubMed] [Google Scholar]
- Prodoehl J, Spraker M, Corcos D, Comella C, Vaillancourt D (2010): Blood oxygenation level‐dependent activation in basal ganglia nuclei relates to specific symptoms in de novo Parkinson's disease. Mov Disord 25:2035–2043. [DOI] [PMC free article] [PubMed] [Google Scholar]
- Prodoehl J, Planetta PJ, Kurani AS, Comella CL, Corcos DM, Vaillancourt DE (2013): Differences in brain activation between tremor‐ and nontremor‐dominant Parkinson disease. JAMA Neurol 70:100–106. [DOI] [PMC free article] [PubMed] [Google Scholar]
- Putcha D, Ross RS, Rosen ML, Norton DJ, Cronin‐Golomb A, Somers DC, Stern CE (2014): Functional correlates of optic flow motion processing in Parkinson's disease. Front Integr Neurosci 8:57. doi: 10.3389/fnint.2014.00057. [DOI] [PMC free article] [PubMed] [Google Scholar]
- Schrag A, Good CD, Miszkiel K, Morris HR, Mathias CJ, Lees AJ, Quinn NP (2000): Differentiation of atypical parkinsonian syndromes with routine MRI. Neurology 54:697–702. [DOI] [PubMed] [Google Scholar]
- Schulz JB, Skalej M, Wedekind D, Luft AR, Abele M, Voigt K, Dichgans J, Klockgether T (1999): Magnetic resonance imaging‐based volumetry differentiates idiopathic Parkinson's syndrome from multiple system atrophy and progressive supranuclear palsy. Ann Neurol 45:65–74. [PubMed] [Google Scholar]
- Shigemoto Y, Matsuda H, Kamiya K, Maikusa N, Nakata Y, Ito K, Ota M, Matsunaga N, Sato N (2013): In vivo evaluation of gray and white matter volume loss in the parkinsonian variant of multiple system atrophy using SPM8 plus DARTEL for VBM. Neuroimage Clin 2:491–496. [DOI] [PMC free article] [PubMed] [Google Scholar]
- Spargo E, Papp MI, Lantos PL (1996): Decrease in neuronal density in the cerebral cortex in multiple system atrophy. Eur J Neurol 3:450–456. [Google Scholar]
- Spraker MB, Yu H, Corcos DM, Vaillancourt DE (2007): Role of individual basal ganglia nuclei in force amplitude generation. J Neurophysiol 98:821–834. [DOI] [PMC free article] [PubMed] [Google Scholar]
- Spraker MB, Prodoehl J, Corcos DM, Comella CL, Vaillancourt DE (2010): Basal ganglia hypoactivity during grip force in drug naïve Parkinson's disease. Hum Brain Mapp 31:1928–1941. [DOI] [PMC free article] [PubMed] [Google Scholar]
- Spraker MB, Corcos DM, Kurani AS, Prodoehl J, Swinnen SP, Vaillancourt DE (2012): Specific cerebellar regions are related to force amplitude and rate of force development. Neuroimage 59:1647–1656. [DOI] [PMC free article] [PubMed] [Google Scholar]
- Stefanova N, Bücke P, Duerr S, Wenning GK (2009): Multiple system atrophy: An update. Lancet Neurol 8:1172–1178. [DOI] [PubMed] [Google Scholar]
- Su M, Yoshida Y, Hirata Y, Watahiki Y, Nagata K (2001): Primary involvement of the motor area in association with the nigrostriatal pathway in multiple system atrophy: Neuropathological and morphometric evaluations. Acta Neuropathol 101:57–64. [DOI] [PubMed] [Google Scholar]
- Summerfield C, Junqué C, Tolosa E, Salgado‐Pineda P, Gómez‐Ansón B, Martí MJ, Pastor P, Ramírez‐Ruíz B, Mercader J (2005): Structural brain changes in Parkinson disease with dementia: A voxel‐based morphometry study. Arch Neurol 62:281–285. [DOI] [PubMed] [Google Scholar]
- Tessitore A, Esposito F, Vitale C, Santangelo G, Amboni M, Russo A, Corbo D, Cirillo G, Barone P, Tedeschi G (2012): Default‐mode network connectivity in cognitively unimpaired patients with Parkinson disease. Neurology 79:2226–2232. [DOI] [PubMed] [Google Scholar]
- Tir M, Delmaire C, le Thuc V, Duhamel A, Destée A, Pruvo JP, Defebvre L (2009): Motor‐related circuit dysfunction in MSA‐P: Usefulness of combined whole‐brain imaging analysis. Mov Disord 24:863–870. [DOI] [PubMed] [Google Scholar]
- Tombaugh TN, McIntyre NJ (1992): The mini‐mental state examination: A comprehensive review. J Am Geriatr Soc 40:922–935. [DOI] [PubMed] [Google Scholar]
- Trick GL, Kaskie B, Steinman SB (1994): Visual impairment in Parkinson's disease: Deficits in orientation and motion discrimination. Optom Vis Sci 71:242–245. [DOI] [PubMed] [Google Scholar]
- Trojanowski JQ, Revesz T, Msa NWGo. (2007): Proposed neuropathological criteria for the post mortem diagnosis of multiple system atrophy. Neuropathol Appl Neurobiol 33:615–620. [DOI] [PubMed] [Google Scholar]
- Tzarouchi LC, Astrakas LG, Konitsiotis S, Tsouli S, Margariti P, Zikou A, Argyropoulou MI (2010): Voxel‐based morphometry and Voxel‐based relaxometry in parkinsonian variant of multiple system atrophy. J Neuroimaging 20:260–266. [DOI] [PubMed] [Google Scholar]
- Vaillancourt DE, Mayka MA, Thulborn KR, Corcos DM (2004): Subthalamic nucleus and internal globus pallidus scale with the rate of change of force production in humans. Neuroimage 23:175–186. [DOI] [PubMed] [Google Scholar]
- Vaillancourt DE, Yu H, Mayka MA, Corcos DM (2007): Role of the basal ganglia and frontal cortex in selecting and producing internally guided force pulses. Neuroimage 36:793–803. [DOI] [PMC free article] [PubMed] [Google Scholar]
- Wenning GK, Tison F, Elliott L, Quinn NP, Daniel SE (1996): Olivopontocerebellar pathology in multiple system atrophy. Mov Disord 11:157–162. [DOI] [PubMed] [Google Scholar]
- Wenning GK, Tison F, Ben Shlomo Y, Daniel SE, Quinn NP (1997): Multiple system atrophy: A review of 203 pathologically proven cases. Mov Disord 12:133–147. [DOI] [PubMed] [Google Scholar]
- Wu T, Hallett M (2013): The cerebellum in Parkinson's disease. Brain 136:696–709. [DOI] [PMC free article] [PubMed] [Google Scholar]
- You H, Wang J, Wang H, Zang YF, Zheng FL, Meng CL, Feng F (2011): Altered regional homogeneity in motor cortices in patients with multiple system atrophy. Neurosci Lett 502:18–23. [DOI] [PubMed] [Google Scholar]
- Yu H, Sternad D, Corcos DM, Vaillancourt DE (2007): Role of hyperactive cerebellum and motor cortex in Parkinson's disease. Neuroimage 35:222–233. [DOI] [PMC free article] [PubMed] [Google Scholar]
Associated Data
This section collects any data citations, data availability statements, or supplementary materials included in this article.
Supplementary Materials
Supplementary Information