

Abstract
Purpose
The expression of pyruvate kinase M2 (PKM2) has been linked to tumor formation and invasion. Specifically, the relationship between high PKM2 expression and prognosis has been evaluated in solid tumors of digestive system. However, the prognostic value of PKM2 remains controversial.
Methods
A literature search of PubMed, Embase, and Cochrane databases was conducted until October 2015. The end point focused on overall survival (OS). The pooled hazard ratio (HR) or odds ratio and the 95% confidence intervals were calculated to correlate PKM2 overexpression with OS and clinicopathological characteristics by employing fixed- or random-effects models, depending on the heterogeneity of the included studies.
Results
We identified 18 cohorts in 16 studies involving 2,812 patients for this meta-analysis. Overall, the combined HR for OS in all tumor types was 1.74 (1.44–2.11; P<0.001). When stratified by tumor type, the influence of PKM2 expression on poor prognosis was also found in gastric cancer (HR =1.54 [1.08–2.21], P=0.018), esophageal squamous cell carcinoma (HR =1.71 [1.38–2.12], P<0.001), hepatocellular cancer (HR =1.92 [1.52–2.42], P<0.001), biliary cancer (HR =2.11 [1.50–2.95], P<0.001), and oral cancer (HR =3.49 [1.97–6.18], P<0.001), but not in pancreatic ductal adenocarcinoma (HR =1.03 [0.28–3.76], P=0.968). Furthermore, PKM2 overexpression had a negative effect on the late clinical stage of all tumor types except for pancreatic ductal adenocarcinoma. The high density of PKM2 overexpression was significantly associated with some clinical characteristics in different cancer types, such as tumor stage, modal metastasis, and tumor size.
Conclusion
Our findings revealed significant association of PKM2 overexpression with OS and certain clinicopathological features in solid tumors of digestive system, thereby suggesting that PKM2 might be an indicator of poor prognosis in digestive system cancers.
Keywords: pyruvate kinase M2, solid tumors, digestive system, prognostic value, meta-analysis
Introduction
Digestive system neoplasm (DSN) is a generic term of various cancers, including oral, esophageal, gastric, liver, and colon cancer. According the data published by the International Agency for Research on Cancer in 2013, approximately 14 million new cancer cases were diagnosed and 8.2 million people died of tumors worldwide in 2012, with DSN contributing to at least 30% of the total morbidity and 40% of the total mortality.1 On the basis of the latest report of the Global Burden of Disease Cancer Collaboration, given its increasing incidence rate worldwide, DSN has posed a major threat to public health since 1990, especially in developing countries where the health systems that are ill-equipped to deal with complex and expensive cancer treatments.2
Energy metabolism reprogramming, including glucose consumption, is one of the important features of solid tumors.3 Irrespective of oxygen availability, the energy production in cancer cells is predominantly via an increased rate of glycolysis and lactic acid fermentation in the cytosol rather than a comparatively low rate of oxidative phosphorylation (OXPHOS) in the mitochondria. OXPHOS is used by most normal cells and is defined as the Warburg effect or aerobic glycolysis.4,5 The increased glycolysis offers a growth advantage to cancer cells by efficiently transforming glucose into the required intermediates for tumor growth.6 A series of studies have found that oncogenic hyperactivation or antioncogenic inactivation drives the metabolic switch by activating the key enzymes of glycolysis, including pyruvate kinase (PK), in tumor tissues.7 As a rate-limiting enzyme in glycolysis, PK catalyzes the formation of pyruvate and ATP from phosphoenolpyruvic acid (PEP) and ADP. Among the four different PK subtypes in mammalian tissue (L, R, M1, and M2), the M2 isoform (PKM2) has received the most attention for its strong overexpression in cancer cells and its switch from the tetrameric state to the dimeric state, which can be detected by a specific monoclonal antibody.8
A large number of studies have shown the correlation between PKM2 expression and solid tumors of digestive system. Depending on the metabolic function of the tissues, different PK isoenzymes are expressed. During tumor formation, PKM2 will gradually replace other tissue-specific isoenzymes until it finally becomes the dominant subtype.9 The high expression of PKM2 in various tumor tissues, blood, and stool makes it a potential biomarker for tumorigenesis and tumor invasion.10 Furthermore, several publications have reported the prognostic value of PKM2 in DSN, but the results of these studies are controversial or inconclusive. For example, in a series of 115 patients with pancreatic ductal adenocarcinoma (PDAC), Lockney et al11 found that positive PKM2 expression was associated with an improved overall survival (OS). However, Ogawa et al12 revealed that the expression of PKM2 predicted an unfavorable clinical outcome in patients with PDAC. Therefore, we conducted this meta-analysis to investigate the relationship of PKM2 overexpression and its clinical outcome in solid tumors of digestive system by reviewing all available studies.
Methods
Search strategy
This meta-analysis was conducted according to the guidelines of the Preferred Reporting Items for Systematic Reviews and Meta-analyses.13 A comprehensive electronic searching of PubMed, Embase, and Web of Science databases, as well as the People’s Republic of China National Knowledge Infrastructure was performed with the following search expression: (“PKM2” or “M2-PK” or “Pyruvate kinase M2” or “Thyroid hormone-binding protein 1” or “Cytosolic thyroid hormone-binding protein”) and (“Tumor” or “Cancer” or “Carcinoma” or “Malignancy”) and (“Digestive system” or “Alimentary system” or “Gastrointestinal system”) and (“Prognosis” or “Survival” or “Outcome”). No language restrictions were imposed, and the last search was updated on October 15, 2015. Lists of references of retrieved articles and reviews were also manually checked to identify additional relevant studies.
Inclusion and exclusion criteria
Studies were eligible if 1) they reported the relationship between PKM2 expression and OS, which was defined as the time from surgery to the date of all-cause death or last follow-up; 2) they used a cohort design; 3) they used immunohistochemical (IHC) method to detect PKM2 protein expression; and 4) hazard ratios (HRs) and 95% confidence intervals (CIs) could be directly obtained or indirectly calculated from the original data. Studies were ineligible if they were reviews, conference abstracts, editorials or case reports, or were conducted on nonhumans and if the articles had insufficient data to estimate HRs and 95% CIs. We also examined all authors’ names and the medical centers involved to avoid duplication of data. If more than one publication with the same study population was identified, only the most recent data were included in the final analysis.
Data extraction and quality assessment
Information was carefully and independently extracted by two investigators (WJY and HLR) based on the aforementioned inclusion and exclusion criteria stipulated. Any disagreement was resolved through consensus. The following data were collected from each study: first author’s name, year of publication, original country, sample size, tumor type, follow-up time, testing method of PKM2, cut-off value, numbers and percentage of high PKM2 expression, and the HRs and 95% CIs for survival outcomes as applicable. Stratification into subgroups was conducted if at least two studies reported the same outcome for the same tumor type. Otherwise, the cases were assigned to a subgroup of cancer types in the same physiological position. HRs and 95% CIs were preferentially obtained from the outcomes of multivariable analysis followed by univariate analysis. If no direct data were available, the HRs and 95% CIs were calculated in each study from the numbers of patients at risk and events, as well as the P-values of log-rank statistics, or from the survival plots of Kaplan–Meier curves.14
The quality of each study included in this meta-analysis was assessed using the Newcastle Ottawa Scale recommended by the Cochrane Nonrandomized Studies Methods Working Group.15 The total score of the Newcastle Ottawa Scale ranged from 0 to 9. We considered studies of high quality if they received six scores or more.16
Statistical analysis
All statistical analyses were performed using STATA software version 11.0 (STATA Corporation, College Station, TX, USA). All statistical tests were two-sided. For the pooled analyses of the correlation between PKM2 overexpression and clinicopathological parameters, such as the clinical stage, tumor size, tumor differentiation, tumor stage, and nodal metastasis, the odds ratios (ORs) with their corresponding 95% CIs were combined to estimate the effects. Combined HRs and 95% CIs were used to assess the strength of the association between PKM2 expression and OS. HR >1 indicated poor prognosis for patients with PKM2 high expression when the 95% CI >1. The statistical significance of the pooled HR was determined by the Z-test, and the values with P<0.05 were considered statistically significant.
Heterogeneity assumption was examined by chi-square test based on Q statistic and I2 metric.17 Heterogeneity was considered statistically significant when P<0.10, which promoted the use of a random-effects model. Otherwise, a fixed-effects model was used.18 The degree of heterogeneity was quantified by the I2 metric (I2<25%, no heterogeneity; 25%<I2<50%, moderate heterogeneity; and I2>50%, extreme heterogeneity).
Sensitivity analysis was performed to validate the credibility of the meta-analysis outcomes by sequentially omitting each individual cohort. If the results did not significantly change when one cohort was removed, the sensitivity is low, and the results are robust. Potential publication bias was statistically evaluated by Begg’s and Egger’s asymmetry tests19 and visually assessed with funnel plots. The statistical significance level for Egger’s test results was defined at P<0.10.
Results
Eligible studies and characteristics
The processes of identifying and selecting studies are presented in Figure 1. Sixteen studies met the inclusion criteria of our meta-analysis.11,12,20–33 Two of these studies included four cohorts.26,28 Therefore, a total of 18 cohorts with 2,812 patients were eligible; the sample sizes ranged from 36 to 368. These studies were all published in 2012 or later and principally originated from Eastern Asia (13 from People’s Republic of China,20,22,23–30,32 two from Japan,12,21 and one from Korea33), whereas the other publications were from Western countries (one from the United States11 and one from the United Kingdom31). Fifteen studies were published in English, whereas one was in Chinese.25 Various cancer types of the alimentary system were included in our meta-analysis, including gastric cancer (GC), hepatocellular carcinoma (HCC), esophageal squamous cell carcinoma (ESCC), PDAC, and others. The HR estimates in 15 cohorts were directly extracted from the outcomes of multivariate analysis; the estimates from one cohort were obtained from univariate analysis,33 and those of two other cohorts were calculated from the Kaplan–Meier survival curve.31,32 The main characteristics of the 18 cohorts in 16 studies are listed in Table 1.
Figure 1.

Flow diagram of study selection process and specific reasons for exclusion in this meta-analysis.
Abbreviations: HR, hazard ratio; CI, confidence interval; OS, overall survival.
Table 1.
Main characteristics of the 16 included studies in the meta-analysis
| Study | Country | Sample | Histology | Follow-up time (month) | Technology | Positive (%) | Cut-off value | Analysis of variance | HR (95% CI) | Language | QS |
|---|---|---|---|---|---|---|---|---|---|---|---|
| Wang et al20 | People’s Republic of China | 111 | OSCC | NR | IHC | 63 (56.8) | Score ≥4 | Multivariate | 3.12 (1.45–5.08) | English | 6 |
| Fukuda et al21 | Japan | 205 | ESCC | Mean 47.9 (4.5–91.3) | IHC | 104 (50.7) | Score ≥6 | Multivariate | 1.85 (1.20–2.78) | English | 7 |
| Gao et al22 | People’s Republic of China | 124 | GAC | NR | IHC | 46 (37.9) | Score ≥1 | Multivariate | 1.23 (0.67–2.25) | English | 6 |
| Lockney et al11 | America | 115 | PDAC | NR | IHC | 61 (53.0) | Score ≥3 | Multivariate | 0.57 (0.36–0.91) | English | 6 |
| Ogawa et al12 | Japan | 36 | PDAC | NR | IHC | 16 (44.4) | Score ≥5 | Multivariate | 2.16 (0.82–6.10) | English | 7 |
| Yuan et al23 | People’s Republic of China | 63 | TSCC | Mean 46.8 (8–80) | IHC | 42 (66.7) | Score ≥4 | Multivariate | 6.02 (1.51–23.93) | English | 7 |
| Li et al24 | People’s Republic of China | 141 | ESCC | NR | IHC | 59 (41.8) | Score ≥0.75 | Multivariate | 1.21 (0.73–2.03) | English | 7 |
| Guo et al25 | People’s Republic of China | 202 | GAC | Median 30.5 (1–110) | IHC | 126 (62.4) | Score ≥1 | Multivariate | 1.89 (1.21–2.97) | Chinese | 6 |
| Chen et al26,a | People’s Republic of China | 236 | HCC | Median 60.0 (3–74) | IHC | 77 (32.6) | Score ≥1 | Multivariate | 2.22 (1.41–3.50) | English | 6 |
| Chen et al26,b | People’s Republic of China | 205 | HCC | Median 60.0 (3–74) | IHC | 138 (67.3) | Score ≥1 | Multivariate | 1.72 (1.14–2.59) | English | 7 |
| Liu et al27 | People’s Republic of China | 367 | HCC | NR | IHC | 89 (24.3) | Score ≥2 | Multivariate | 1.90 (1.32–2.74) | English | 7 |
| Li et al28,a | People’s Republic of China | 80 | GBAC | Overall 24.0 | IHC | 45 (56.3) | Stained cells ≥25% | Multivariate | 2.21 (1.30–3.76) | English | 6 |
| Li et al28,b | People’s Republic of China | 46 | GBSC/ASC | Overall 24.0 | IHC | 26 (56.5) | Stained cells ≥25% | Multivariate | 2.68 (1.09–6.59) | English | 6 |
| Zhang et al29 | People’s Republic of China | 86 | ESCC | NR | IHC | 61 (70.9) | Score ≥4 | Multivariate | 2.36 (1.16–4.81) | English | 7 |
| Zhan et al30 | People’s Republic of China | 210 | ESCC | Overall 72.0 | IHC | 167 (79.5) | Score ≥4 | Multivariate | 1.75 (1.28–2.40) | English | 7 |
| Dhar et al31 | British | 75 | BTC | NR | IHC | 54 (72.0) | Plasma >24.4 U/mL or Bile >31.7 U/mL | Univariate | 1.87 (1.13–3.09)c | English | 6 |
| Yin et al32 | People’s Republic of China | 142 | GC | Median 32.0 (1–66) | IHC | 111 (78.2) | Score ≥2 | Univariate | 2.20 (1.45–3.28)c | English | 6 |
| Lim et al33 | Korea | 368 | GC | Median 70.6 | IHC | 144 (39.1) | Stained cells ≥25% | Univariate | 1.09 (0.77–1.54) | English | 6 |
Notes:
First of two cohorts in this study;
second of two cohorts in this study;
extrapolated from Kaplan–Meier survival curve.
Abbreviations: HR, hazard ratio; CI, confidence interval; QS, quality score; NR, non reported; IHC, immunohistochemisty; K–M, Kaplan–Meier; OSCC, oral squamous cell carcinoma; ESCC, esophageal squamous cell carcinoma; GAC, gastric adenocarcinoma; PDAC, pancreatic ductal adenocarcinoma; TSCC, tongue squamous cell carcinoma; HCC, hepatocellular carcinoma; GBAC, gallbladder adenocarcinoma; GBSC/ASC, gallbladder squamous cell/adenosquamous carcinoma; BTC, biliary tract cancer; GC, gastric cancer.
Correlation of PKM2 expression with clinicopathological features
The effect of PKM2 expression on the clinicopathological features in different digestive tumors was further analyzed and listed in Table 2. When focusing on GC and biliary cancer, a similar phenomenon was seen: the significant correlation of PKM2 overexpression with some characteristics of tumor progression, such as clinical stage, nodal metastasis, and tumor size. However, the obvious influence of high PKM2 density was also correlated with tumor stage in GC, and with differentiation in biliary cancer, but not in GC. In the ESCC group, the negative effects of high PKM2 expression were found associated with the clinical stage, tumor stage, nodal metastasis, and differentiation. Additionally, three studies on HCC described that high PKM2 expression had a significant relationship with the clinical stage, tumor differentiation, tumor size, and α-fetoprotein level. Nevertheless, the PKM2 density and liver cirrhosis were not correlated. Moreover, when targeted on oral cancer, high-density PKM2 had a negative effect on the clinical stage and nodal metastasis, but showed a positive influence on the tumor stage. However, two studies demonstrated that the PKM2 expression, clinical stage, and differentiation were not relevant in PDAC cases.
Table 2.
Meta-analysis of the subgroups based on clinicopathological factors related to PKM2 expression
| Categories | Cohorts (sample) | OR (95% CI) | I2 (%) | Ph-value | Z | P-value |
|---|---|---|---|---|---|---|
| GC | ||||||
| Clinical stage (I + II/III + IV) | 4 (836) | 1.71 (1.29–2.26) | 87.7 | <0.001 | 3.75 | <0.001 |
| Tumor stage (T1 + T2/T3 + T4) | 4 (836) | 2.04 (1.51–2.75) | 79.7 | 0.002 | 4.67 | <0.001 |
| Differentiation (well + moderate/poor) | 4 (836) | 0.75 (0.55–1.03) | 76.4 | 0.005 | 1.77 | 0.077 |
| Nodal metastasis (negative/positive) | 4 (836) | 1.53 (1.13–2.08) | 66.6 | 0.030 | 2.75 | 0.006 |
| Tumor size (≤6 cm/.6 cm) | 3 (468) | 2.29 (1.34–3.92) | 0.0 | 0.628 | 3.01 | 0.003 |
| Esophageal squamous cell carcinoma | ||||||
| Clinical stage (I + II/III + IV) | 4 (642) | 3.37 (2.33–4.90) | 0.0 | 0.469 | 6.40 | <0.001 |
| Tumor stage (T1 + T2/T3 + T4) | 3 (556) | 3.20 (2.18–4.72) | 48.8 | 0.142 | 5.89 | <0.001 |
| Differentiation (well + moderate/poor) | 4 (642) | 1.72 (1.19–2.49) | 65.9 | 0.032 | 2.86 | 0.004 |
| Nodal metastasis (negative/positive) | 3 (432) | 2.16 (1.41–3.29) | 0.0 | 0.401 | 3.57 | <0.001 |
| Hepatocellular cancer | ||||||
| Clinical stage (I + II/III + IV) | 3 (808) | 1.95 (1.38–2.76) | 73.0 | 0.025 | 3.78 | <0.001 |
| Tumor differentiation (I + II/III + IV) | 3 (808) | 2.77 (1.97–3.88) | 0.0 | 0.406 | 5.89 | <0.001 |
| Tumor size (≤5 cm/>5 cm) | 3 (808) | 1.49 (1.09–2.04) | 24.0 | 0.268 | 2.51 | 0.012 |
| Live cirrhosis (no/yes) | 3 (808) | 0.88 (0.56–1.38) | 0.0 | 0.830 | 0.56 | 0.577 |
| α-Fetoprotein (≤20 ng/mL/>20 ng/mL) | 3 (808) | 1.52 (1.10–2.09) | 0.0 | 0.724 | 2.56 | 0.011 |
| PDAC | ||||||
| Clinical stage (I + II/III + IV) | 2 (151) | 1.16 (0.56–2.40) | 78.0 | 0.033 | 0.39 | 0.696 |
| Differentiation (well + moderate/poor) | 2 (151) | 0.66 (0.31–1.39) | 21.4 | 0.259 | 1.10 | 0.272 |
| Biliary cancer | ||||||
| Clinical stage (I + II/III + IV) | 3 (201) | 2.42 (1.31–4.45) | 29.5 | 0.242 | 2.83 | 0.005 |
| Differentiation (well + moderate/poor) | 2 (126) | 3.68 (1.46–9.27) | 0.0 | 0.837 | 2.77 | 0.006 |
| Nodal metastasis (negative/positive) | 2 (126) | 3.28 (1.55–6.95) | 0.0 | 0.676 | 3.09 | 0.002 |
| Tumor size (≤3 cm/>3 cm) | 2 (126) | 3.83 (1.76–8.34) | 13.1 | 0.283 | 3.37 | 0.001 |
| Oral cancer | ||||||
| Clinical stage (I + II/III + IV) | 2 (174) | 2.23 (1.21–4.12) | 81.7 | 0.019 | 2.57 | 0.010 |
| Tumor stage (T1 + T2/T3 + T4) | 2 (174) | 0.49 (0.24–0.99) | 0.0 | 0.824 | 1.98 | 0.048 |
| Pathological grade (I/II + III) | 2 (174) | 0.70 (0.38–1.29) | 0.0 | 0.539 | 1.15 | 0.251 |
| Nodal metastasis (negative/positive) | 2 (174) | 3.35 (1.74–6.47) | 0.0 | 0.989 | 3.61 | <0.001 |
Notes: Ph denotes P-value for heterogeneity based on Q-test; P denotes P-value for statistical significance based on Z-test.
Abbreviations: PKM2, pyruvate kinase M2; GC, gastric cancer; OR, odds ratio; CI, confidence intervals; PDAC, pancreatic ductal adenocarcinoma.
Correlation of PKM2 expression with OS
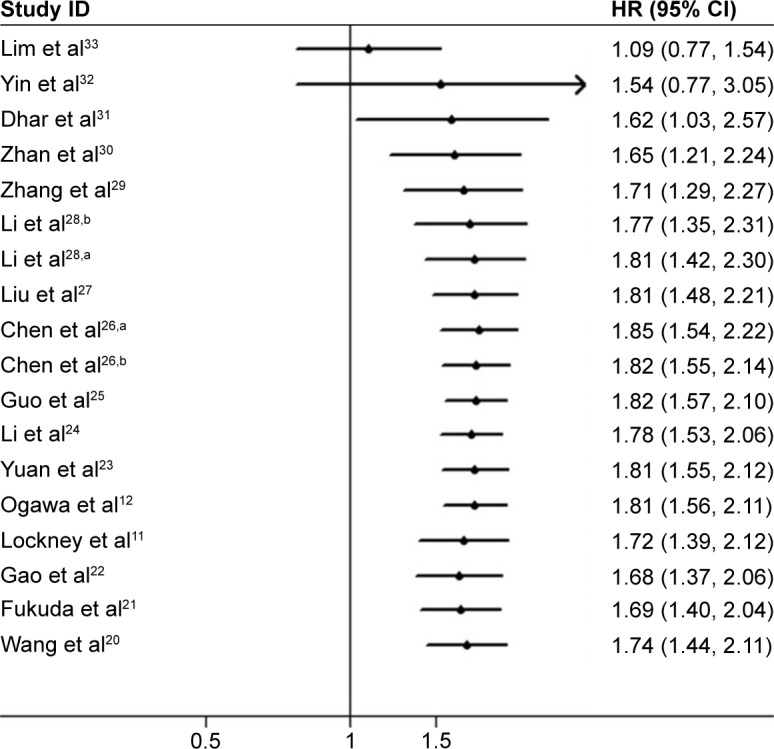
The main results of the meta-analysis regarding the correlation between PKM2 overexpression and OS are summarized in Table 3 and Figure 2. The combined HR for 18 cohorts in 16 studies evaluating PKM2 expression and OS suggested that the high PKM2 expression indicated a poor prognosis for OS (HR =1.74; 95% CI, 1.44–2.11; P<0.001; random effects). When the included cohorts were stratified into subgroup analyses in terms of different cancer types, a significant correlation was observed in GC (HR =1.54; 95% CI, 1.08–2.21; P=0.018; random effects), ESCC (HR =1.71; 95% CI, 1.38–2.12; P<0.001; fixed effects), HCC (HR =1.92; 95% CI, 1.52–2.42; P<0.001; fixed effects), biliary cancer (HR =2.11; 95% CI, 1.50–2.95; P<0.001; fixed effects), and oral cancer (HR =3.49; 95% CI, 1.97–6.18; P<0.001; fixed effects), but not in PDAC (HR =1.03; 95% CI, 0.28–3.76; P=0.968; random effects). When the eligible cohorts were stratified according to their sample size, the results did not show any obvious changes. The trend was also observed with the stratification of variable analysis, such as multivariate analysis (HR =1.78; 95% CI, 1.43–2.21; P<0.001; random effects) and univariate analysis (HR =1.62; 95% CI, 1.03–2.57; P=0.039; random effects). However, when grouped based on regions and variable analysis, the negative role of PKM2 in predicting cancer prognosis was obvious in Asian populations (HR =1.79; 95% CI, 1.59–2.02; P<0.001; fixed effects), but not in Western population (HR =1.03; 95% CI, 0.32–3.29; P=0.963; random effects).
Table 3.
Overall and subgroup meta-analysis of OS and PKM2 expression in digestive tumors
| Categories | Cohorts (n) | HR (95% CI) | I2 (%) | Ph-value | Z | P-value |
|---|---|---|---|---|---|---|
| Overall | 18 (2,812) | 1.74 (1.44–2.11) | 61.3 | <0.001 | 5.72 | <0.001 |
| Cancer type | ||||||
| GC | 4 (836) | 1.54 (1.08–2.21) | 62.8 | 0.045 | 2.36 | 0.018 |
| Esophageal squamous cell cancer | 4 (642) | 1.71 (1.38–2.12)F | 0.0 | 0.440 | 4.88 | <0.001 |
| Hepatocellular cancer | 3 (808) | 1.92 (1.52–2.42)F | 0.0 | 0.715 | 5.45 | <0.001 |
| PDAC | 2 (151) | 1.03 (0.28–3.76) | 82.1 | 0.018 | 0.04 | 0.968 |
| Biliary cancer | 3 (201) | 2.11 (1.50–2.95)F | 0.0 | 0.770 | 4.31 | <0.001 |
| Oral cancer | 2 (174) | 3.49 (1.97–6.18)F | 0.0 | 0.396 | 4.29 | <0.001 |
| Population | ||||||
| Asian | 16 (2,622) | 1.79 (1.59–2.02)F | 31.0 | 0.115 | 9.62 | <0.001 |
| Western | 2 (190) | 1.03 (0.32–3.29) | 91.4 | 0.001 | 0.05 | 0.963 |
| Sample size | ||||||
| ≥100 | 12 (2,426) | 1.59 (1.27–2.00) | 69.9 | <0.001 | 4.02 | <0.001 |
| <100 | 6 (386) | 2.25 (1.69–2.99)F | 0.0 | 0.755 | 5.55 | <0.001 |
| Analysis of variable | ||||||
| Multivariate | 15 (2,227) | 1.78 (1.43–2.21) | 61.1 | 0.001 | 5.18 | <0.001 |
| Univariate | 3 (585) | 1.62 (1.03–2.57) | 72.7 | 0.026 | 2.07 | 0.039 |
Notes: All pooled HRs were derived from random-effects model except for cells marked with (fixedF). Ph denotes P-value for heterogeneity based on Q-test; P denotes P-value for statistical significance based on Z-test.
Abbreviations: PKM2, pyruvate kinase M2; GC, gastric cancer; OS, overall survival; CI, confidence intervals; PDAC, pancreatic ductal adenocarcinoma; HR, hazard ratio.
Figure 2.

Forest plots of overall association between PKM2 overexpression and overall survival in solid tumors of digestive system.
Notes: aFirst of two cohorts in this study; bsecond of two cohorts in this study. Weights are from random-effects analysis. The diamond indicates the pooled HR of each individual study.
Abbreviations: PKM2, pyruvate kinase M2; HR, hazard ratios; CI, confidence interval.
We also analyzed the heterogeneity of the selected cohorts according to the P-value for heterogeneity. From the results in Table 3, we noted that extreme heterogeneity was present in all of the included cohorts (I2=61.3%, Ph<0.001). Therefore, a random-effects model was applied to calculate the overall HR. After assessing the source of heterogeneity by subgroup analyses based on the cancer types, study population, sample size, and variable analysis, the heterogeneity was partially reduced or removed.
Sensitivity analysis and cumulative meta-analysis
The sensitivity analysis of pooled OS is shown in Figure 3. Notably, the corresponding pooled HR did not significantly change for any study factor after the sequential omission of each cohort, thereby indicating that no individual cohort affected the pooled results. The results of our meta-analysis are stable and reliable.
Figure 3.

Effects of individual studies on pooled HRs for PKM2 overexpression and OS in solid tumors of digestive system.
Notes: aFirst of two cohorts in this study; bsecond of two cohorts in this study.
Abbreviations: PKM2, pyruvate kinase M2; HR, hazard ratio; OS, overall survival.
A cumulative meta-analysis of 18 cohorts in 16 studies was performed to evaluate the cumulative HR estimate over time. The results of cumulative meta-analysis are shown in Figure 4. The following can be summarized: 1) the pooled HRs and 95% CI estimates tend to be stable, with a relatively good variation in chronological order; 2) from 2013 to 2014, the pooled HRs gradually increased to become statistically significant; the 95% CIs were correspondingly narrowed; and 3) after including some studies published in 2015, the pooled HRs slightly decreased, whereas the 95% CIs were correspondingly broadened.
Figure 4.
Cumulative meta-analysis of PKM2 expression and OS in solid tumors of digestive system.
Notes: aFirst of two cohorts in this study; bsecond of two cohorts in this study.
Abbreviations: PKM2, pyruvate kinase M2; OS, overall survival; HR, hazard ratio; CI, confidence interval.
Publication bias
In our meta-analysis, the statistical results of both Egger’s test and Begg’s test did not show any significant publication bias for the pooled HR estimation of OS (Egger’s test, t=1.40, P=0.181; Begg’s test, Z=1.36, P=0.173). Similarly, on the basis of the subgroup analysis of tumor types, neither Egger’s test nor Begg’s test provided any obvious evidence of publication bias (Table 4). The funnel plot that was used to investigate the correlation between PKM2 expression and pooled OS is shown in Figure 5.
Table 4.
Results of Egger’s and Begg’s tests
| Comparison | Egger’s test
|
Begg’s test
|
|||
|---|---|---|---|---|---|
| t | P-value | 95% CI | Z | P-value | |
| OS | 1.40 | 0.181 | −0.87 to 4.23 | 1.36 | 0.173 |
| Cancer type | |||||
| GC | 0.26 | 0.816 | −21.01 to 23.77 | -0.34 | 1.000 |
| Esophageal cancer | 0.12 | 0.915 | −8.67 to 9.18 | 0.34 | 0.734 |
| Hepatocellular cancer | 0.63 | 0.642 | −54.11 to 59.75 | 0.52 | 0.602 |
| Biliary tract cancer | 1.55 | 0.364 | −10.98 to 14.04 | 1.04 | 0.296 |
| Others | 1.55 | 0.262 | −8.81 to 18.71 | 0.34 | 0.734 |
Abbreviations: CI, confidence interval; GC, gastric cancer; OS, overall survival.
Figure 5.
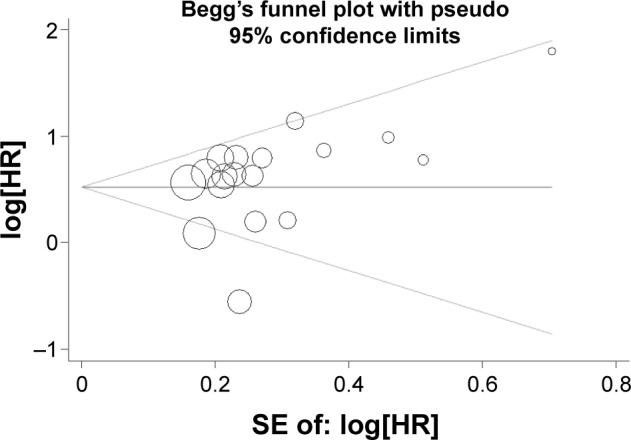
Begg’s funnel plots of overall relationship between PKM2 overexpression and OS in solid tumors of digestive system.
Abbreviations: PKM2, pyruvate kinase M2; OS, overall survival; HR, hazard ratio.
Discussion
Cancer cells require a large amount of energy, mostly in the form of ATP, to maintain their proliferation, motility, and other biological events. Given that cancer cells outgrow their over oxygen supply, these cells can adapt to the hypoxic microenvironment via the less efficient aerobic glycolysis rather than the more productive OXPHOS for glucose metabolism.34 In addition to providing the energy supply, the dynamic process of aerobic glycolysis can provide glycolytic intermediates for the biosynthesis of cellular building blocks, including nucleotides, amino acids, and lipids.35 Moreover, oncogenic alternations and the hyperactivation of glycolytic enzymes or metabolic transporters may be responsible for the induction of aerobic glycolysis.20 PKM2 plays a key role by controlling the rate-limiting step of glycolysis and promoting the Warburg effect; thus, PKM2 has been demonstrated to be upregulated in some tumor tissues. The silencing of PKM2 impaired the tumor growth in several animal models of cancer. Both observations support the hypothesis that PKM2 may be exploited as a cancer biomarker and therapeutic target.36,37
In tumor cells where PKM2 plays a predominant role, the ratio of high and low density of PKM2 expression determines whether glucose is used to produce energy or synthesize metabolic precursors in vivo.38 Different from a tetramer with the activity of PK in normal cells, PKM2 is seen in the form of dimmer with the protein kinase activity in tumor cells and plays a promoting role in tumor progression.39 According to the requirements of cell growth, tumor cells have multiple signaling pathways to precisely regulate PKM2, including PKM transcription, alternative splicing of pre-mRNA, nuclear localization, posttranslational modification, and allosteric regulation. Simultaneously, PKM2 can regulate the activity of signaling pathways and gene expression in a feedback loop,40 including c-Myc,41 H3 T11,42 NF-κB,43 and β-catenin.44 On the basis of the current findings, PKM2 acts as a gatekeeper between metabolic and the nonmetabolic functions in cancer cells, thereby making it an attractive target for cancer treatment.45 The knockdown of PKM2 could significantly enhance gemcitabine-induced cell apoptosis; the application of PKM2 inhibitors can help pancreatic cancer patients overcome the chemoresistance of gemcitabine.46 Also, PKM2 splicing and expression are responsible for the resistance of PDAC cells to gemcitabine and cisplatin. This resistance can be reversed by switching the splicing toward PKM1.47 A lot more evidence has clarified the function and regulation of PKM2 in tumor cells at various levels, showing significant progress over the past 10 years. However, several problems still have to be solved because of the highly intricate mechanism of PKM2 in tumor development.
The prediction of the prognosis of cancer patients is beneficial for the selection of a therapeutic strategy and for the reasonable allocation of medical resources.25 A meta-analysis is useful to integrate results from independent studies to arrive at a specific outcome, the pooled results of which have statistical power. Thus, we conducted this meta-analysis to evaluate PKM2 as a prognostic marker in solid tumors of digestive system. A total of 16 studies with 18 cohorts that previously compared the survival of cancer patients according to PKM2 density level in the primary tumor were selected in the present meta-analysis. The combined results indicated that high PKM2 density was associated with a poor OS in solid tumor of digestive cancers with a random-effects model. The clinical trials on a certain topic constitute an increasing, an open, and a continuous entirety with the passage of time. Instead of traditional meta-analysis only at a certain point of time, the variation trend of the overall effect can be understood by cumulative meta-analysis at each time point. The cumulative meta-analysis revealed that the pooled HRs and 95% CI became stable as the number of studies and patients increased, which supports the reliability of our findings. In addition, publication bias and sensitivity analysis further suggested the robustness and reliability of the meta-analysis outcomes.
Given the extreme interstudy heterogeneity on the overall outcome, we performed a subgroup analyses in accordance with the tumor type, sample population, sample size, and variable analysis. When focused on the cancer type, the preferred expression of PKM2 is associated with worsened OS in GC, ESCC, HCC, biliary cancer, and oral cancer, but not with PDAC, which indicated that PKM2 function may be tissue specific, although its functional regulation within various solid tumors is not yet confirmed. However, because of the small sample size (151 patients), the prognostic value of PKM2 in PDAC is not powerfully evidenced based. Thus, more well-designed studies are warranted to explore the realistic prognostic effect of PKM2 on these cancers. Moreover, when focused on the original countries, we can note that most of the eligible studies with 2,622 patients were from East Asian population, while only two with 190 patients from Western people. This phenomenon could be due to the higher incidence of DSNs in East Asian countries compared to Western countries,1 which is probably caused by the significant difference of the eating styles or habits between Eastern and Western people; so, studies of the association between PKM2 and digestive system tumors have received greater attention in East Asian countries. When the pooled outcomes were stratified by patient population, no statistical significance was found in Western populations. These results might be attributed to the absence of sufficient samples. In addition, sensitivity analysis suggested that the results were stable when individual studies with few cases or results from a different calculation method were excluded. Therefore, PKM2 is a significant potential prognostic factor for solid tumors of digestive system.
To further investigate the prognostic role of PKM2 in different cancer types, we analyzed the relationship between PKM2 expression and the clinicopathological factors that were also related to prognosis of oncological patients. High PKM2 expression has a significant effect on poor survival in patients with GC, ESCC, HCC, biliary cancer, and oral cancer; a homodromous effect is also seen in several clinicopathological features, such as the clinical stage (GC, ESCC, HCC, biliary cancer, and oral cancer), tumor stage (GC and ESCC), differentiation (ESCC, HCC, and biliary cancer), nodal metastasis (GC, ESCC, and oral cancer), and tumor size (GC, HCC, and biliary cancer), all of which contribute to tumor progression and patient prognosis. However, PKM2 overexpression has a positive association with the tumor stage in oral cancer. Therefore, PKM2 might have different effects in different tumors, and further research is warranted to clarify the actual mechanism. Moreover, PKM2 expression was not related with survival and the clinicopathological parameters of PDAC. This phenomenon may be attributed to the inherent features of PDAC, such as strong inflammatory and extensive fibrotic changes, which are different from other gastrointestinal malignancies.11 Considering that prognosis is a comprehensive final result reflected by multiple factors, including the individual variation, therapeutic regimen, and drug dosage, among others, the results should be interpreted with caution, and more studies on large, homogeneous patient populations are required.
Because PKM2 protein detection by IHC was the most common method to evaluate PKM2 expression, we only focused on the relationship between PKM2 protein expression and prognosis of digestive system cancers in this meta-analysis. Besides PKM2 protein detection by IHC, the expression of PKM2 was also measured in serum and feces. Some articles reported the diagnostic value of PKM2 in liquid serum for non-small-cell lung cancer10 and in feces for colorectal cancer.9 However, the detection of PKM2 in liquid biopsies (serum or feces) was not recommended for use alone as a screening tool for non-small-cell lung cancer and colorectal cancer because of its moderate sensitivity and specificity. Compared to the qualitative evaluation of PKM2 expression in cells or tissues, the measurement of PKM2 in liquid biopsies is quantitative, rapid, simple, and samples can be collected without using invasive techniques, which makes it easier for repeated testing and also makes it convenient for clinical application. Unfortunately, there was no related report about the association between PKM2 expression in liquid biopsies and prognosis of solid tumors. Thus, the clinical significance of PKM2 expression in liquid biopsies remains unclear, and more studies are needed to explore its actual value.
A few limitations in our meta-analysis should be acknowledged. First, this meta-analysis was based on published literatures with predominantly positive results. Thus, a potential publication bias may inflate our overall estimation. Second, the statistical heterogeneities of some pooled outcomes were moderate or even extreme, and the subgroup analyses could not explore the source. Third, the cut-off values and experimental designs were inconsistent in the included studies, which may be a source of heterogeneity. Regrettably, we were unable to conduct subgroup analyses to explore these influences because few studies offered concrete data. Fourth, the HR values in some studies were calculated from the survival curves or univariate analysis, which may lead to some minor differences from the actual HRs.15 Finally, although the individual results of the included studies were based on the same PKM2 detection approach (IHC), the difference between studies with the same protocols (experimental design, specimen preparation, choice of antibody, dilution of antibodies, and other relevant information) may have confounded the pooler outcomes.
Conclusion
In conclusion, the upregulation of PKM2 is significantly associated with poor survival and some clinicopathological features in solid tumor of digestive system. Therefore, the development of therapies against PKM2 might be a reasonable approach to restrain cancer progression and improve patient prognosis. However, given the limitations of our work, the results should be interpreted by caution. Further high-quality and large-sample studies are required to confirm these results.
Acknowledgments
This study was funded by the Scientific and Technological Planning Project of Zhanjiang City (grant number 2014B10157).
Footnotes
Disclosure
The authors report no conflicts of interests in this work.
References
- 1.WHO GLOBOCAN: Estimated cancer incidence, mortality and prevalence worldwide in 2012–2015. Available from: http://globocan.iarc.fr/Pages/fact_sheets_population.aspx.
- 2.Global Burden of Disease Cancer Collaboration The global burden of cancer 2013. JAMA Oncol. 2015;1:505–527. doi: 10.1001/jamaoncol.2015.0735. [DOI] [PMC free article] [PubMed] [Google Scholar]
- 3.Hanahan D, Weinberg RA. Hallmarks of cancer: the next generation. Cell. 2011;144:646–674. doi: 10.1016/j.cell.2011.02.013. [DOI] [PubMed] [Google Scholar]
- 4.Koppenol WH, Bounds PL, Dang CV. Otto Warburg’s contributions to current concepts of cancer metabolism. Nat Rev Cancer. 2011;11:325–337. doi: 10.1038/nrc3038. [DOI] [PubMed] [Google Scholar]
- 5.Lee KM, Nam K, Oh S, Lim J, Lee T, Shin I. ECM1 promotes the Warburg effect through EGF-mediated activation of PKM2. Cell Signal. 2015;27:228–235. doi: 10.1016/j.cellsig.2014.11.004. [DOI] [PubMed] [Google Scholar]
- 6.Ward PS, Thompson CB. Metabolic reprogramming: a cancer hallmark even Warburg did not anticipate. Cancer Cell. 2012;21:297–308. doi: 10.1016/j.ccr.2012.02.014. [DOI] [PMC free article] [PubMed] [Google Scholar]
- 7.Vander Heiden MG, Cantley LC, Thompson CB. Understanding the Warburg effect: the metabolic requirements of cell proliferation. Science. 2009;324:1029–1033. doi: 10.1126/science.1160809. [DOI] [PMC free article] [PubMed] [Google Scholar]
- 8.Goonetilleke KS, Mason JM, Siriwardana P, King NK, France MW, Siriwardena AK. Diagnostic and prognostic value of plasma tumor M2 pyruvate kinase in periampullary cancer: evidence for a novel biological marker of adverse prognosis. Pancreas. 2007;34:318–324. doi: 10.1097/MPA.0b013e31802ee9c7. [DOI] [PubMed] [Google Scholar]
- 9.Uppara M, Adaba F, Askari A, et al. A systematic review and meta-analysis of the diagnostic accuracy of pyruvate kinase M2 isoenzymatic assay in diagnosing colorectal cancer. World J Surg Oncol. 2015;13:48. doi: 10.1186/s12957-015-0446-4. [DOI] [PMC free article] [PubMed] [Google Scholar]
- 10.Liu JC, Zhu HJ, Jiang HJ, et al. Tumor M2 pyruvate kinase in diagnosis of nonsmall cell lung cancer: a meta-analysis based on Chinese population. J Cancer Res Ther. 2015;11:C104–C106. doi: 10.4103/0973-1482.163857. [DOI] [PubMed] [Google Scholar]
- 11.Lockney NA, Zhang MC, Lu YZ, et al. Pyruvate kinase muscle isoenzyme (PKM2) expression is associated with overall survival in pancreatic ductal adenocarcinoma. J Gastrointest Cancer. 2015;46:390–398. doi: 10.1007/s12029-015-9764-6. [DOI] [PMC free article] [PubMed] [Google Scholar]
- 12.Ogawa H, Nagano H, Konno M, et al. The combination of the expression of hexokinase 2 and pyruvate kinase M2 is a prognostic marker in patients with pancreatic cancer. Mol Clin Oncol. 2015;3:563–571. doi: 10.3892/mco.2015.490. [DOI] [PMC free article] [PubMed] [Google Scholar]
- 13.Liberati AAD, Altman DG, Tetzlaff J, et al. The PRISMA statement for reporting systematic reviews and meta-analyses of studies that evaluate health care interventions: explanation and elaboration. PLoS Med. 2009;6:e1000100. doi: 10.1371/journal.pmed.1000100. [DOI] [PMC free article] [PubMed] [Google Scholar]
- 14.Tierney JF, Stewart LA, Ghersi D, Burdett S, Sydes MR. Practical methods for incorporating summary time-to-event data into meta-analysis. Trials. 2007;8:16. doi: 10.1186/1745-6215-8-16. [DOI] [PMC free article] [PubMed] [Google Scholar]
- 15.Wells GA, Shea B, O’Connell D, et al. The Newcastle-Ottawa Scale (NOS) for assessing the quality of nonrandomised studies in meta-analyses. Ottawa Health Research Institute Web site. 2012 [Google Scholar]
- 16.Wu JY, Hu LR, Wu FP, He T. Prognostic value of rsf-1/hbxap in human solid tumors: a meta-analysis of cohort studies. Int J Clin Exp Med. 2015;8:1944–1955. [PMC free article] [PubMed] [Google Scholar]
- 17.Higgins JP, Thompson SG, Deeks JJ, Altman DG. Measuring inconsistency in meta-analyses. BMJ. 2003;327:557–560. doi: 10.1136/bmj.327.7414.557. [DOI] [PMC free article] [PubMed] [Google Scholar]
- 18.Mantel N, Haenszel W. Statistical aspects of the analysis of data from retrospective studies of disease. J Natl Cancer Inst. 1959;22:719–748. [PubMed] [Google Scholar]
- 19.Egger M, Davey SG, Schneider M, Minder C. Bias in meta-analysis detected by a simple, graphical test. BMJ. 1997;315:629–634. doi: 10.1136/bmj.315.7109.629. [DOI] [PMC free article] [PubMed] [Google Scholar]
- 20.Wang YL, Zhang XM, Zhang YC, et al. Overexpression of pyruvate kinase M2 associates with aggressive clinicopathological features and unfavorable prognosis in oral squamous cell carcinoma. Cancer Biol Ther. 2015;16:839–845. doi: 10.1080/15384047.2015.1030551. [DOI] [PMC free article] [PubMed] [Google Scholar]
- 21.Fukuda S, Miyata H, Miyazaki Y, et al. Pyruvate kinase M2 modulates esophageal squamous cell carcinoma chemotherapy response by regulating the pentose phosphate pathway. Ann Surg Oncol. 2015;22(Suppl 3):S1461–S1468. doi: 10.1245/s10434-015-4522-3. [DOI] [PubMed] [Google Scholar]
- 22.Gao YS, Xu DY, Yu GZ, Liang J. Overexpression of metabolic markers HK1 and PKM2 contributes to lymphatic metastasis and adverse prognosis in Chinese gastric cancer. Int J Clin Exp Pathol. 2015;8:9264–9271. [PMC free article] [PubMed] [Google Scholar]
- 23.Yuan CP, Li ZW, Wang YL, et al. Overexpression of metabolic markers PKM2 and LDH5 correlates with aggressive clinicopathological features and adverse patient prognosis in tongue cancer. Histopathology. 2014;65:595–605. doi: 10.1111/his.12441. [DOI] [PubMed] [Google Scholar]
- 24.Li WF, Xu ZY, Hong JF, Xu Y. Expression patterns of three regulation enzymes in glycolysis in esophageal squamous cell carcinoma: association with survival. Med Oncol. 2014;31:118. doi: 10.1007/s12032-014-0118-1. [DOI] [PubMed] [Google Scholar]
- 25.Guo F, Chen Y. Expression of PKM2 and its prognostic significance in gastric cancer. Chin Clin Oncol. 2014;19:599–602. [Google Scholar]
- 26.Chen ZA, Lu XY, Wang ZC, et al. Co-expression of PKM2 and TRIM35 predicts survival and recurrence in hepatocellular carcinoma. Oncotarget. 2015;6:2538–2548. doi: 10.18632/oncotarget.2991. [DOI] [PMC free article] [PubMed] [Google Scholar]
- 27.Liu WR, Tian MX, Yang LX, et al. PKM2 promotes metastasis by recruiting myeloid-derived suppressor cells and indicates poor prognosis for hepatocellular carcinoma. Oncotarget. 2015;6:846–861. doi: 10.18632/oncotarget.2749. [DOI] [PMC free article] [PubMed] [Google Scholar]
- 28.Li J, Yang Z, Zou Q, et al. PKM2 and ACVR 1C are prognostic markers for poor prognosis of gallbladder cancer. Clin Transl Oncol. 2014;16:200–207. doi: 10.1007/s12094-013-1063-8. [DOI] [PubMed] [Google Scholar]
- 29.Zhang XL, He CZ, He CY, et al. Nuclear PKM2 expression predicts poor prognosis in patients with esophageal squamous cell carcinoma. Pathol Res Pract. 2013;209:510–515. doi: 10.1016/j.prp.2013.06.005. [DOI] [PubMed] [Google Scholar]
- 30.Zhan C, Shi Y, Lu C, Wang Q. Pyruvate kinase M2 is highly correlated with the differentiation and the prognosis of esophageal squamous cell cancer. Dis Esophagus. 2013;26:746–753. doi: 10.1111/dote.12023. [DOI] [PubMed] [Google Scholar]
- 31.Dhar DK, Olde Damink SW, Brindley JH, et al. Pyruvate kinase M2 is a novel diagnostic marker and predicts tumor progression in human biliary tract cancer. Cancer. 2013;119:575–585. doi: 10.1002/cncr.27611. [DOI] [PMC free article] [PubMed] [Google Scholar]
- 32.Yin LN, Wang X, Luo CJ, et al. The value of expression of M2-PK and VEGF in patients with advanced gastric cancer. Cell Biochem Biophys. 2013;67:1033–1039. doi: 10.1007/s12013-013-9601-0. [DOI] [PMC free article] [PubMed] [Google Scholar]
- 33.Lim JY, Yoon SO, Seol SY, et al. Overexpression of the M2 isoform of pyruvate kinase is an adverse prognostic factor for signet ring cell gastric cancer. World J Gastroenterol. 2012;18:4037–4043. doi: 10.3748/wjg.v18.i30.4037. [DOI] [PMC free article] [PubMed] [Google Scholar]
- 34.Gatenby RA, Gillies RJ. Glycolysis in cancer: a potential target for therapy. Int J Biochem Cell Biol. 2007;39:1358–1366. doi: 10.1016/j.biocel.2007.03.021. [DOI] [PubMed] [Google Scholar]
- 35.Wong N, Yan J, Ojo D, De Melo J, Cutz JC, Tang D. Changes in PKM2 associate with prostate cancer progression. Cancer Invest. 2014;32:330–338. doi: 10.3109/07357907.2014.919306. [DOI] [PubMed] [Google Scholar]
- 36.Parnell KM, Foulks JM, Nix RN, et al. Pharmacologic activation of PKM2 slows lung tumor xenograft growth. Mol Cancer Ther. 2013;12:1453–1460. doi: 10.1158/1535-7163.MCT-13-0026. [DOI] [PubMed] [Google Scholar]
- 37.Goldberg MS, Sharp PA. Pyruvate kinase M2-specific siRNA induces apoptosis and tumor regression. J Exp Med. 2012;209:217–224. doi: 10.1084/jem.20111487. [DOI] [PMC free article] [PubMed] [Google Scholar]
- 38.Dombrauckas JD, Santarsienro BD, Mesecar AD. Structural basis for tumor pyruvate kinase M2 allosteric regulation and catalysis. Biochemistry. 2005;44:9417–9429. doi: 10.1021/bi0474923. [DOI] [PubMed] [Google Scholar]
- 39.Li ZW, Yang P, Li ZY. The multifaceted regulation and function of PKM2 in tumor progression. Biochim Biophys Acta. 2014;1846:285–296. doi: 10.1016/j.bbcan.2014.07.008. [DOI] [PubMed] [Google Scholar]
- 40.Yuan WW, Lu ZM. Regulation and function of pyruvate kinase M2 in cancer. Cancer Lett. 2013;339:153–158. doi: 10.1016/j.canlet.2013.06.008. [DOI] [PMC free article] [PubMed] [Google Scholar]
- 41.David CJ, Chen M, Assanah M, Canoll P, Manley JL. HnRNP proteins controlled by c-Myc deregulate pyruvate kinase mRNA splicing in cancer. Nature. 2010;463:364–369. doi: 10.1038/nature08697. [DOI] [PMC free article] [PubMed] [Google Scholar]
- 42.Yang WW, Xia Y, Hawke D, et al. PKM2 phosphorylates histone H3 and promotes gene transcription and tumorigenesis. Cell. 2012;150:685–696. doi: 10.1016/j.cell.2012.07.018. [DOI] [PMC free article] [PubMed] [Google Scholar]
- 43.Yang WW, Xia Y, Cao Y, et al. EGFR-induced and PKCε monoubiquitylation-dependent NF-κB activation upregulates PKM2 expression and promotes tumorigenesis. Mol Cell. 2012;48:771–784. doi: 10.1016/j.molcel.2012.09.028. [DOI] [PMC free article] [PubMed] [Google Scholar]
- 44.Yang WW, Xia Y, Ji HT, et al. Nuclear PKM2 regulates β-catenin transactivation upon EGFR activation. Nature. 2011;480:118–122. doi: 10.1038/nature10598. [DOI] [PMC free article] [PubMed] [Google Scholar]
- 45.Harris I, McCracken S, Wah Mak T. PKM2: a gatekeeper between growth and survival. Cell Res. 2012;22:447–449. doi: 10.1038/cr.2011.203. [DOI] [PMC free article] [PubMed] [Google Scholar]
- 46.Kim DJ, Park YS, Kang MG, et al. Pyruvate kinase isoenzyme M2 is a therapeutic target of gemcitabine-resistant pancreatic cancer cells. Exp Cell Res. 2015;336:119–129. doi: 10.1016/j.yexcr.2015.05.017. [DOI] [PubMed] [Google Scholar]
- 47.Calabretta S, Bielli P, Passacantilli I, et al. Modulation of PKM alternative splicing by PTBP1 promotes gemcitabine resistance in pancreatic cancer cells. Oncogene. 2016;35:2031–2039. doi: 10.1038/onc.2015.270. [DOI] [PMC free article] [PubMed] [Google Scholar]