Abstract
Purpose
R2* (1/T2*) and single echo R2 (1/T2) have been calibrated to liver iron concentration (LIC) in patients with thalassemia and transfusion-dependent sickle cell disease at 1.5T. The R2*-LIC relationship is linear, whereas that of R2 is curvilinear. However, the increasing popularity of high-field scanners requires generalizing these relationships to higher field strengths. In this study, we tested the hypothesis that numerical simulation can accurately determine the field dependence of iron-mediated transverse relaxation rates.
Methods
We previously replicated the calibration curves between R2 and R2* and iron at 1.5T using Monte Carlo models incorporating realistic liver structure, iron deposit susceptibility, and proton mobility. In this paper, we extend our model to predict relaxivity-iron calibrations at higher field strengths. Predictions were validated by measuring R2 and R2* at 1.5T and 3T in six β-thalassemia major patients.
Results
Predicted R2* increased twofold at 3T from 1.5T, whereas R2 increased by a factor of 1.47. Patient data exhibited a coefficient of variation of 3.6% and 7.2%, respectively, to the best-fit simulated data. Simulations over the range 0.25T–7T showed R2* increasing linearly with field strength, whereas R2 exhibited a concave-downward relationship.
Conclusion
A model-based approach predicts alterations in relaxivity-iron calibrations with field strength without repeating imaging studies. The model may generalize to alternative pulse sequences and tissue iron distribution.
Keywords: iron, liver, Monte Carlo, relaxation, relaxivity, 3T, high field
INTRODUCTION
MRI has gained clinical acceptance as a non-invasive tool to monitor tissue iron stores in patients with iron overload syndromes. Relaxation rates R2 (1/T2) and R2* (1/T2*) have been calibrated to liver biopsy on 1.5T scanners to quantify liver iron concentration (LIC) with clinical accuracy (1,2). R2* increases linearly with LIC while R2 has a curvilinear relationship. However, these relationships have not been extensively characterized for higher field strengths.
Although imaging techniques can be physically calibrated across field strengths, this is a tedious and expensive process. An alternative approach is to use numerical modeling by generating realistic (iron-overloaded) liver geometries and simulate R2 and R2* imaging experiments. Such a model has already been successful in predicting R2*-iron and R2-iron relationships within tolerable limits of clinical accuracy at 1.5T (3). Here, we extend the model to find relaxivity with respect to iron, or iron-relaxivity calibration, over a range of field strengths. To validate the predictions of the model, we performed R2 and R2* imaging of the liver at 1.5T and 3T in six patients with transfusional iron burden and 11 non–iron-overloaded controls.
METHODS
We modeled the liver architecture as consisting of hepatocytes and sinusoids, ignoring vascular and biliary structures. As described previously (3), realistic liver geometries were simulated as 80-μm blocks consisting of 64 cuboidal hepatocytes. Sinusoids were represented as 18 cylindrical regions with a diameter of 10 μm and a height of 20 μm. Hepatic iron concentration was in the clinically relevant range of 0.5–40 mg/g dry tissue weight, and corresponding volume fractions of iron deposits were determined from prior relationships (4). Spherical iron deposits were distributed in this virtual environment based on gamma distribution functions that represented particle size, interparticle distance, and intercellular iron anisotropy (4). Sinusoidal iron fraction was determined from a previously derived relationship (5). Each iron load geometry was generated independently and represented a virtual patient. The magnetic susceptibility of the impenetrable spherical iron deposits was computed assuming a 4:1 mixture of hemosiderin and ferritin and using literature values of 1.1 × 10⁻⁶ and 1.6 × 10⁻⁶ m3/kgFe, respectively (6,7). A total of 5000 protons performed a random walk [diffusion coefficient = 0.76 μm2/ms (8)] through the magnetic environment, and FIDs were computed from phase accruals, providing R2* estimates. Tissue wet-todry weight ratio was assumed to be 4:1 (9). A single echo experiment with echo times (TE) logarithmically spaced between 0.1 and 30 ms was also simulated to measure R2. Echo times were chosen to maximize the dynamic range of the simulation for the computation time. Protons could not cross hepatocyte boundaries. The model neglected any contact or exchange mechanisms. Details of MRI simulation have been described previously (3).
Monte Carlo simulations were performed at field strengths of 1.5T, 3T, and 10 other field strengths in the range 0.25T–7T. Realistic liver geometry and iron morphology were employed with hepatic iron concentrations in the range of 0.5–40 mg/g. R2* and R2 values were estimated from signal decay curves corresponding to each iron burden. Simulations were subsequently extended up to 60 mg/g hepatic iron concentration for comparison. Bland-Altman analysis was performed with matched pairs of iron-loaded patient and simulation data for R2 and R2* at 3T to determine bias and standard deviation.
In vivo validation scans were performed as part of a prospective, Institutional Review Board–approved study using a phased array coil on 1.5T and 3T GE Signa Twinspeed systems. Consent was obtained from six thalassemia major patients (n = 2 male, n = 4 female; ages 12–44) or their legal guardians and 20 non–ironoverloaded subjects (n = 10 male, n = 10 female; ages 19– 41). Liver R2* was measured in a single midhepatic slice using a multiple-echo gradient echo sequence with 16 equally spaced TEs of 1.2–17.2 ms, flip angle = 20°, repetition time (TR) ≈ 13 ms, bandwidth = 83.3 kHz, number of averaged excitations (NEX) = 6, and matrix size = 128 × 128. In patients in whom signal intensity was completely extinguished by the second echo, the protocol was modified to have a first TE = 0.8 ms, flip angle = 10°, TR = 10 ms, and NEX = 8. The sequence was repeated at the same gain settings using manually incremented initial echo times (ΔTE = 0.1 or 0.2 ms); the first echo time was increased until the liver tissue appeared black. The echoes from each scan were combined and regions of interest manually adjusted to improve sampling of rapid decay. A comprehensive description of the procedure is described by Storey et al. (10). Liver R2 was measured in four slices using a 90°–90° Hahn spin echo sequence with TE = [3,3.5,5,8,12,18,30] ms at 1.5T and TE = [4,5,8,12,18,30] ms at 3T; TR = 300 ms; bandwidth = 62.5 kHz; NEX = 1; and matrix size = 64 × 64 (10). R2 values were computed in 16 regions of interest (four per slice) by fitting the mean signal decay to an (exponential + constant) model (11). R2 imaging was not performed in control subjects.
Relaxation rates at 3T were compared with those at 1.5T for both model and experimental data. Similarly, the variation in relaxivities (defined below) with field strength was investigated and characterized using linear and power law relationships over the range 0.25T–7T. Relaxivity is defined as the increase in the relaxation rate with iron concentration, , at a given field strength in mM−1 · s−1. Relaxivity enhancement (RE), the increase of relaxivity with field strength, was calculated between arbitrary field strengths B0 and 1.5T as follows:
| [1] |
where C represents the iron concentration in mg/g dry weight and R represents either R2 or R2*. To generalize the relationship, relaxivity enhancement was plotted against field strength and fit to linear equations. For R2, log transformation of both RE and field strength was needed to linearize the relationship.
For the purpose of this study, relaxation was modeled as follows:
| [2] |
where R is the relaxation rate (R2 or R2*) of a given tissue sample with iron, Ri is the intrinsic relaxation rate without iron, and R′ is the extrinsic relaxation rate due to iron load.
By applying the RE equation to the relaxation model, we find the following transformation to translate R2 and R2* values from 1.5 Tesla to any arbitrary field strength:
| [3] |
where R is the relaxation rate (R2 or R2*) for a given field strength, Ri is the corresponding intrinsic liver relaxation rate, and E is the relaxivity enhancement for a given field strength. The background relaxation was assumed to be 20 s−1 independent of field strength for the simulations.
RESULTS
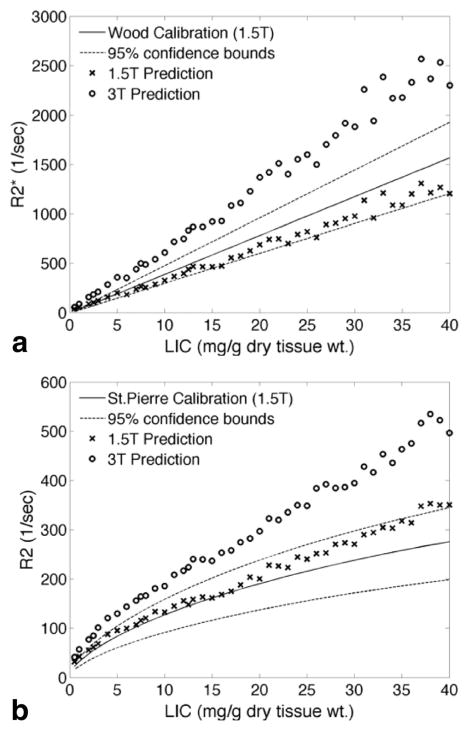
Figure 1 shows simulated R2* and R2 values as a function of iron concentration for both 1.5T and 3T. Simulated R2* (Fig. 1a) rises linearly with iron concentration for both 1.5T and 3T. The ratio of the slopes (i.e., the predicted RE at 3T relative to 1.5T) was 2.01 ± 0.01 (mean ± standard deviation). Simulated 1.5T values fall within the 95% confidence intervals derived from liver biopsy studies in humans (2). Simulated R2 estimates (Fig. 1b) follow a concave downward pattern with increasing iron concentration at both 1.5 and 3T; this curvilinearity results from increased static refocusing at high iron concentrations (3,12). Although simulated R2 is higher at 3T than at 1.5T, the effect is not as large as for R2*. The 1.5T R2-iron calibration falls within the 95% confidence bounds derived from human liver biopsy data (1,2).
FIG. 1.
Comparison between simulated relaxivities (×) and clinical calibration curves at 1.5T for R2* (a) and R2 (b). The clinical calibration curves are reproduced from the literature (1,2) and represent the behavior of in vivo patient data from large clinical trials. Simulated relaxivities at 3T (○) are included for comparison, although no corresponding clinical calibration curves exist. Note that the model predictions for R2* are highly linear and are in agreement with the clinical calibration curves at 1.5T.
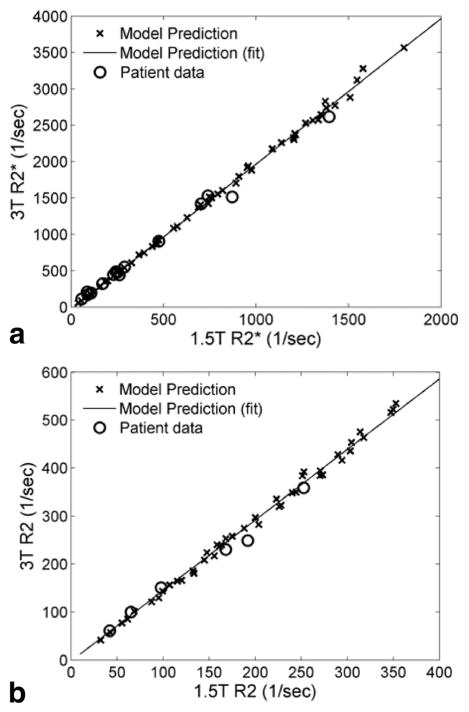
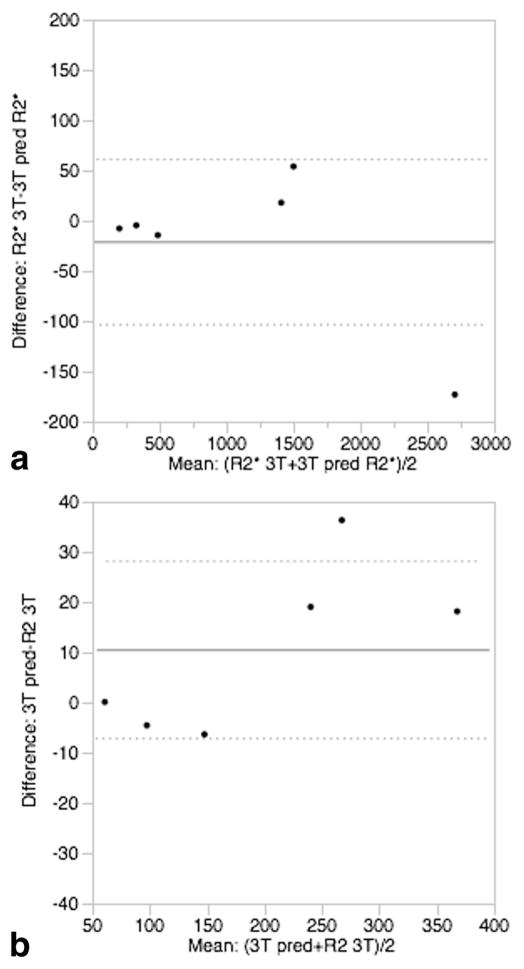
Figure 2a shows the relationship between R2* at 3T and 1.5T for both simulation and patient data. The R2* values are highly correlated with an r2 of 0.999. The slopes of the best fit lines were 2.01 ± 0.01 for the model and 2.00 ± 0.06 for the patient and control data. Thus, within measurement precision, both model and patient data demonstrated a twofold increase in R2* at 3T relative to 1.5T, in agreement with the results reported by Storey et al. (10). Bland-Altman analysis of R2* demonstrated no significant bias between observed and predicted R2* with a standard deviation of 3.6%; predicted R2* was calculated from the best-fit line of the simulated 3T–1.5T relationship. Figure 2b shows R2 at 3T versus 1.5T; the modelpredicted relationship was highly linear (r2 = 0.996). The regression slope of the simulated data was 1.47 ± 0.01, indicating that R2 at 3T averaged 47% higher than measured at 1.5T. For the patient data, the regression slope was 1.34 ± 0.07. Bland-Altman analysis again demonstrated that observed and best-fit predicted R2 was unbiased and had a standard deviation of only 7.2% (Fig. 3).
FIG. 2.
Relationship between relaxation rates at 3T and 1.5T. For both R2* (a) and R2 (b), model predictions (×) were highly linear (R>0.99) across field strengths and were in good agreement with in vivo patient data (○).
FIG. 3.
Bland-Altman plots between matched pairs of 3T simulated and patient data. a: R2* showed no significant bias and a standard deviation of 3.6%. b: R2 also showed no bias and a standard deviation of 7.2%.
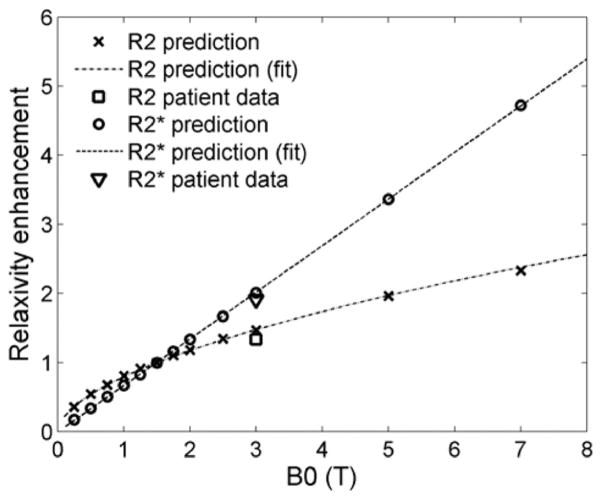
In order to generalize the effect of magnetic field on relaxivity, simulations were repeated for multiple field strengths. Figure 4 shows model-predicted R2* and R2 relaxivities over the range 0.25T–7T, relative to corresponding relaxivities at 1.5T. For R2*, the RE was a linear function of field strength, as expected, but for R2 it represented a power law relationship (linear on a log-log scale). The equations of the best-fit lines are given by
FIG. 4.
Enhancement of R2* and R2 relaxivities with field strength relative to 1.5T. For R2*, the predicted enhancement varied linearly with field strength, whereas it was curvilinear for R2. At 3T, the predicted relaxivity enhancements agreed well with the values calculated from in vivo data.
| [4] |
| [5] |
where B0 is the field strength in units of Tesla. Note that the second equation is very close to the expected relationship:
| [6] |
Equations [4] and [5] predict RE factors of 2.03 and 1.48, respectively, for 3T. If R2 and R2* calibration curves are known at 1.5T, they can be translated to other field strengths using Eq. [3].
DISCUSSION
With the increased migration to 3T scanners, existing calibration curves must be translated to higher fields. 3T MRI scanners offer higher signal-to-noise ratio, which can be traded for improved resolution or speed. Storey et al. (10) established the relationship between R2* at 3T and 1.5T over a wide range of LIC; R2* increased twofold with field strength, in agreement with our model predictions. A recent publication by Meloni et al. also demonstrated doubling of R2* at 3T compared with 1.5T (13). Similar relationships have been shown in cardiac tissue (10,13). In our study, 1.5T simulations were in excellent agreement with in vivo calibration curves (Fig. 1a) and predicted R2* enhancement was linear with static magnetic field strength (Fig. 3). This result is expected, because higher fields proportionally increase the magnetization of the iron particles through the equation
| [7] |
where M is the magnetization, χ is the magnetic susceptibility of the particles, and H is the applied field. At higher iron concentrations, diffusing water protons encounter spatially larger magnetic inhomogeneities, and R2* is primarily determined by magnetic susceptibility (3).
On the other hand, R2 enhancement demonstrated a nonlinear relationship with field strength (Figs. 1b and 3). The higher field strength expands the range of static refocusing, particularly at higher iron concentrations, partially saturating R2 at high iron concentrations. This occurs because the iron-dependent field inhomogeneities grow with field strength. This moves more protons near iron stores into the static refocusing regime, in which the phase accrual can be completely refocused by a spin echo. The increase in size of this regime increases the likelihood that a spin will experience a static increase in field strength over its diffusion window rather than a local field inhomogeneity. Thus, R2 values at 3T were only 47% higher than values at 1.5T. The experimental agreement of these predictions at 3T is excellent (Fig. 3). Previously, the field dependence of R2 had been studied only in the heart over a relatively small range of iron concentrations (13). The R2 enhancement factor between 1.5T and 3T was reported to be approximately 1.55 (14), comparing favorably with our estimate of 1.47. The in vivo estimate for relaxivity enhancement from our liver data showed an estimate of 1.34; we believe that limitations in the spin echo pulse sequence caused the estimates for high-iron decay rates to be less reliable than moderate iron loads and will be corrected with improved pulse sequences. It was not possible for our group to validate our predictions for higher field strengths, but these data establish testable benchmarks. We acknowledge that the calculation of RE depends on assuming that the iron-mediated relaxation dominates that of the base tissue. Our RE values are targeted at patients with moderate to high iron loads; to determine an RE value for lower iron loads, the relationship in Eq. [3] must be applied to account for the nonlinear enhancement in base tissue relaxation rates.
From a practical imaging perspective, these simulations have important consequences. Maximum measurable R2* and R2 are hardware limited by the minimum achievable echo time. Because R2 values scale more slowly with field strength than R2* values, it may be easier to use spin echo measurements to quantify high LIC concentrations at higher fields. R2* estimation at high fields may require specialized techniques, such as the use of free induction decay measurements, center-out radial acquisitions, ramp sampling, half pulse excitations, or other variations of ultrashort echo time imaging (15,16). This study demonstrates how a generalized and validated Monte Carlo model can be used to predict relaxivity-iron behavior at different field strengths. Future extensions of the model could include simulating a different MRI pulse sequence (e.g., the multiecho CPMG sequence). Iron calibration curves have been obtained experimentally for CPMG sequences (17–19) but differ from the spin echo R2 relationships. The model can be used to interrogate complicated CPMG behavior and expose complex interplays among proton diffusion, effective particle size, and interecho spacing. Furthermore, underlying mechanisms of the nonexponential nature of MRI signal in the presence of magnetic inhomogeneities can also be studied (19,20). Finally, accurate values for diffusion coefficient (D) of protons in liver tissue are currently lacking; even the published value of 0.76 (8) has a large standard deviation of 0.27. More recent estimates of the diffusion coefficient show standard deviations of 25%–50% of the estimated ADC (21). The virtual liver model can be used to calculate an “effective D” and test whether there is any systematic dependence on iron concentration. Accurate values of D are critical for structure, motion, and time-sensitive sequences such as CPMG. It would also be interesting to see if field-dependent relaxation enhancement (Fig. 3) is modified by the diffusion coefficient. R2* enhancement should not change, since R2’ is unaffected by D, whereas the effect on R2 enhancement is not clear, since R2 is systematically altered by changes in D (3).
Figures 1 and 2 demonstrate some variability that may appear to be iron load–dependent. Because the iron geometries are generated in an independent manner, the variability in RE with iron load is a result of the stochastic nature of the iron generation process rather than the random proton paths. Each simulated sample represents a single patient and decreasing the variability would require numerous simulations at each iron load for computational efficiency. These iron geometries were reused across the field strengths so some apparent variation is indicative of a single iron distribution’s properties rather than systematic dependence on iron load. This variability could be reduced by performing multiple simulations at each iron load and averaging the results.
This study was limited by modest validation with experimental data. For the field-dependent study, R2* and R2 was measured in only six subjects with significant iron overload. However, these data spanned a wide range of LIC measurements (~3–35 mg/g dry wt) (1) and were in excellent agreement with the model. Since the choice of R2* measurement protocol required a subjective decision, it is possible that a selection bias could be introduced into the high-iron R2* estimates. Ongoing 3T–1.5T comparisons in larger patient populations will provide further validation of the model. We additionally hope to perform scanning at additional field strengths when such a scanner is available to us. At 3T and above, a customized pulse sequence will be required to quantify higher R2* and R2 values than measured in the present study. Additionally, no systematic study into the relationship between the hemosiderin-ferritin ratio and iron load has been conducted; it is conceivable that molar magnetic susceptibility may depend on liver iron burden.
We have demonstrated that a computational model using realistic liver architecture and iron morphology can likely extend iron calibrations to higher magnetic field strengths. Characterization of the R2-iron calibration at 3T is novel and may improve patient access to LIC estimates at centers having only 3T scanners. However, the real power of the model lies in predicting changes to R2* and R2 calibration curves in response to modifications of MRI pulse sequences, field strength, and systemic disturbances in tissue iron distribution. Nonidealities of the imaging sequences can also be easily modeled to determine their impact on iron calibration curves. Understanding key parameters of the relaxivityiron behavior can also help in creating tissue-specific models (through autopsy studies) for organs which iron concentration cannot be probed via biopsy (e.g., heart, kidney, and pancreas). Whereas in silico calibration curves always warrant targeted experimental verification, Monte Carlo simulation can greatly reduce dependence on expensive validation studies, shortening the design cycle for novel techniques.
Acknowledgments
We thank the University of Southern California Center for High-Performance Computing and Communications for performing the computation work for this study.
References
- 1.St Pierre TG, Clark PR, Chua-anusorn W, Fleming AJ, Jeffrey GP, Olynyk JK, Pootrakul P, Robins E, Lindeman R. Noninvasive measurement and imaging of liver iron concentrations using proton magnetic resonance. Blood. 2005;105:855–861. doi: 10.1182/blood-2004-01-0177. [DOI] [PubMed] [Google Scholar]
- 2.Wood JC, Enriquez C, Ghugre N, Tyzka JM, Carson S, Nelson MD, Coates TD. MRI R2 and R2* mapping accurately estimates hepatic iron concentration in transfusion-dependent thalassemia and sickle cell disease patients. Blood. 2005;106:1460–1465. doi: 10.1182/blood-2004-10-3982. [DOI] [PMC free article] [PubMed] [Google Scholar]
- 3.Ghugre NR, Wood JC. Relaxivity-iron calibration in hepatic iron over-load: probing underlying biophysical mechanisms using a Monte Carlo model. Magn Reson Med. 2011;65:837–847. doi: 10.1002/mrm.22657. [DOI] [PMC free article] [PubMed] [Google Scholar]
- 4.Ghugre NR, Gonzalez-Gomez I, Shimada H, Coates TD, Wood JC. Quantitative analysis and modelling of hepatic iron stores using stereology and spatial statistics. J Microsc. 2010;238:265–274. doi: 10.1111/j.1365-2818.2009.03355.x. [DOI] [PubMed] [Google Scholar]
- 5.Ghugre NR, Gonzalez-Gomez I, Butensky E, Noetzli L, Fischer R, Williams R, Harmatz P, Coates TD, Wood JC. Patterns of hepatic iron distribution in patients with chronically transfused thalassemia and sickle cell disease. Am J Hematol. 2009;84:480–483. doi: 10.1002/ajh.21456. [DOI] [PMC free article] [PubMed] [Google Scholar]
- 6.Michaelis J, Coryell C, Granick S. The magnetic properties of ferritin and some other colloidal ferric compounds. J Biol Chem. 1943;148:463–480. [Google Scholar]
- 7.Shoden A, Sturgeon P. Hemosiderin I. A physico-chemical study. Acta Haematol. 1960;23:376–392. [Google Scholar]
- 8.Yamada I, Aung W, Himeno Y, Nakagawa T, Shibuya H. Diffusion coefficients in abdominal organs and hepatic lesions: evaluation with intravoxel incoherent motion echo-planar MR imaging. Radiology. 1999;210:617–623. doi: 10.1148/radiology.210.3.r99fe17617. [DOI] [PubMed] [Google Scholar]
- 9.Zuyderhoudt FM, Hengeveld P, van Gool J, Jorning GG. A method for measurement of liver iron fractions in needle biopsy specimens and some results in acute liver disease. Clin Chim Acta. 1978;86:313–321. doi: 10.1016/0009-8981(78)90387-x. [DOI] [PubMed] [Google Scholar]
- 10.Storey P, Thompson AA, Carqueville CL, Wood JC, de Freitas RA, Rigsby CK. R2* imaging of transfusional iron burden at 3T and comparison with 1.5T. J Magn Reson Imaging. 2007;25:540–547. doi: 10.1002/jmri.20816. [DOI] [PMC free article] [PubMed] [Google Scholar]
- 11.Ghugre NR, Enriquez CM, Coates TD, Nelson MD, Jr, Wood JC. Improved R2* measurements in myocardial iron overload. J Magn Reson Imaging. 2006;23:9–16. doi: 10.1002/jmri.20467. [DOI] [PMC free article] [PubMed] [Google Scholar]
- 12.Yablonskiy DA, Haacke EM. Theory of NMR signal behavior in magnetically inhomogeneous tissues: the static dephasing regime. Magn Reson Med. 1994;32:749–763. doi: 10.1002/mrm.1910320610. [DOI] [PubMed] [Google Scholar]
- 13.Meloni A, Positano V, Keilberg P, et al. Feasibility, reproducibility, and reliability for the T*2 iron evaluation at 3 T in comparison with 1.5 T. Magn Reson Med. 2012;68:543–551. doi: 10.1002/mrm.23236. [DOI] [PubMed] [Google Scholar]
- 14.Guo H, Au WY, Cheung JS, et al. Myocardial T2 quantitation in patients with iron overload at 3 Tesla. J Magn Reson Imaging. 2009;30:394–400. doi: 10.1002/jmri.21851. [DOI] [PMC free article] [PubMed] [Google Scholar]
- 15.Chappell KE, Patel N, Gatehouse PD, Main J, Puri BK, Taylor-Robinson SD, Bydder GM. Magnetic resonance imaging of the liver with ultrashort TE (UTE) pulse sequences. J Magn Reson Imaging. 2003;18:709–713. doi: 10.1002/jmri.10423. [DOI] [PubMed] [Google Scholar]
- 16.Gatehouse PD, Bydder GM. Magnetic resonance imaging of short T2 components in tissue. Clin Radiol. 2003;58:1–19. doi: 10.1053/crad.2003.1157. [DOI] [PubMed] [Google Scholar]
- 17.Bulte JW, Miller GF, Vymazal J, Brooks RA, Frank JA. Hepatic hemosiderosis in non-human primates: quantification of liver iron using different field strengths. Magn Reson Med. 1997;37:530–536. doi: 10.1002/mrm.1910370409. [DOI] [PubMed] [Google Scholar]
- 18.Alexopoulou E, Stripeli F, Baras P, Seimenis I, Kattamis A, Ladis V, Efstathopoulos E, Brountzos EN, Kelekis AD, Kelekis NL. R2 relaxometry with MRI for the quantification of tissue iron overload in beta-thalassemic patients. J Magn Reson Imaging. 2006;23:163–170. doi: 10.1002/jmri.20489. [DOI] [PubMed] [Google Scholar]
- 19.Ghugre NR, Coates TD, Nelson MD, Wood JC. Mechanisms of tissue-iron relaxivity: nuclear magnetic resonance studies of human liver biopsy specimens. Magn Reson Med. 2005;54:1185–1193. doi: 10.1002/mrm.20697. [DOI] [PMC free article] [PubMed] [Google Scholar]
- 20.Jensen JH, Chandra R. Theory of nonexponential NMR signal decay in liver with iron overload or superparamagnetic iron oxide particles. Magn Reson Med. 2002;47:1131–1138. doi: 10.1002/mrm.10170. [DOI] [PubMed] [Google Scholar]
- 21.Li Y, Chen Z, Wang J. Differential diagnosis between malignant and benign hepatic tumors using apparent diffusion coefficient on 1.5-T MR imaging: a meta analysis. Eur J Radiol. 2012;81:484–490. doi: 10.1016/j.ejrad.2010.12.069. [DOI] [PubMed] [Google Scholar]


