. 2016 Jul 19;5:e15034. doi: 10.7554/eLife.15034

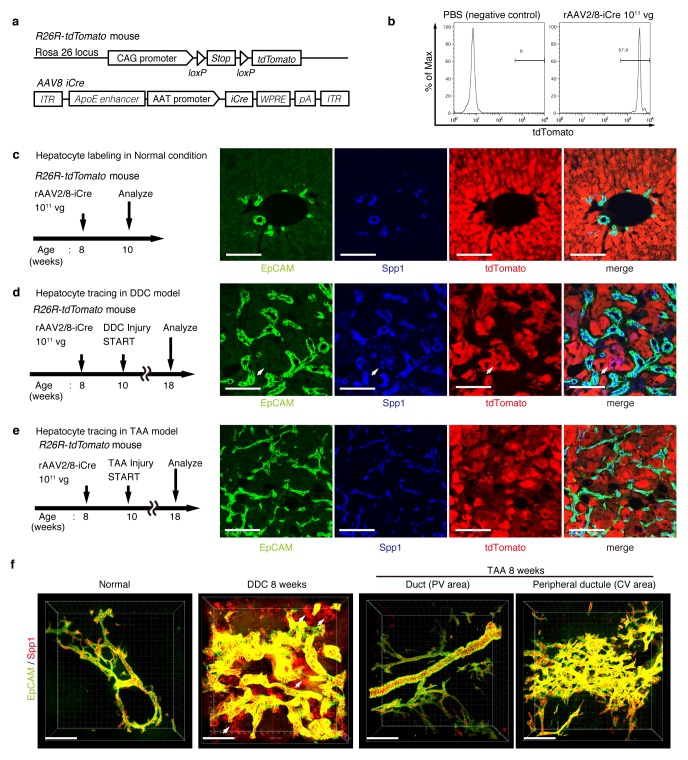
Figure 3. Lineage tracing of hepatocytes.

(a) R26R-tdTomato mice were used in combination with rAAV2/8-iCre for the labeling of hepatocytes. rAAV2/8-iCre is designed to transduce only hepatocytes. (b) Representative image of FACS analysis of hepatocytes labeled by rAAV2/8-iCre. These histogram images show the result of serial purification gates (FSC/SSC, pulse width, DAPI-). (c) Adult R26R-tdTomato mice were injected with rAAV2/8-iCre (1x10¹¹ vg /mouse). 2 weeks after injection, the mice were sacrificed and the livers were stained with anti-EpCAM and anti-Spp1 antibody (scale bar, 100 um). (d and e) Mice were injected with rAAV2/8-iCre (1011 vg /mouse) and then subjected to a 3,5-diethoxycarbonyl-1,4-dihydrocollidine (DDC) or TAA injury model. tdTomato+ Spp1+ EpCAM- cells were only observed in DDC-fed mouse liver sections (white arrows). Analysis was done with 5 mice per each injury model. More than 6 sections were made per mouse. (f) 3D imaging was performed with WT mice (normal state, DDC for 8 weeks, TAA for 8 weeks). Acquired z-stack data is displayed as maximum-intensity projection after contrast adjustment with IMARIS software. In the DDC liver, Spp1+ EpCAM- cells were observed (white arrow) around main biliary tubular structures that were composed of EpCAM+ cells.

DOI: http://dx.doi.org/10.7554/eLife.15034.010

Figure 3.

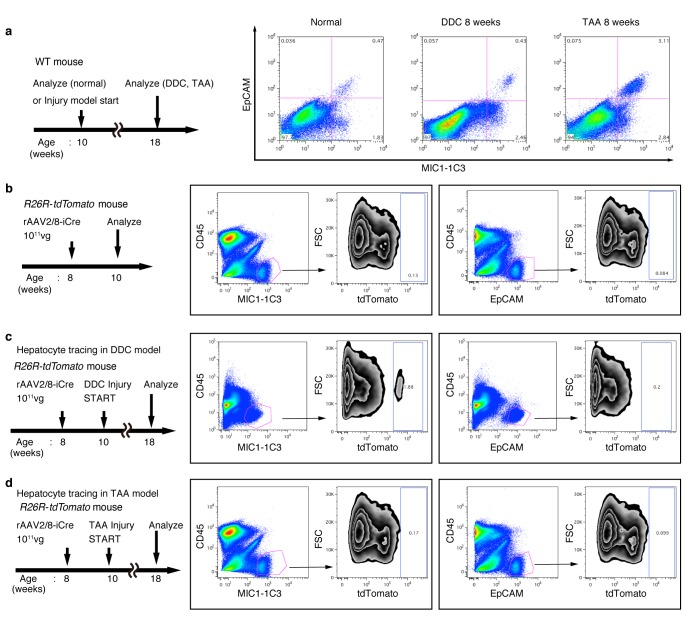
Figure 3—figure supplement 1. FACS analysis of hepatocyte-derived cells in the TAA and DDC models.

Figure 3—figure supplement 1.

The experimental design is described on the left side of the figure. Hepatocytes of R26R-tdTomato mice were labeled with rAAV2/8-iCre. Dissociated liver cells were stained with anti-MIC1-1C3 antibody, anti-EpCAM antibody, anti-CD45 antibody and anti-Prom1 antibody. The results for Prom1 are not shown because they were essentially the same as those for EpCAM. All experiments were done more than three times to confirm reproducibility. Sequential FACS gates were applied; DAPI- (live cells), FSC/SSC, and pulse width. (a) All EpCAM+ cells were included in the MIC1-1C3+ cell population. (b) Before injury, almost no MIC1-1C3+ or EpCAM+ cells were labeled. (c) After DDC injury, a tdTomato+ population emerged in the MIC1-1C3+ population. Meanwhile almost no labeled cells emerged in the EpCAM+ population. (d) After TAA injury, almost no tdTomato+ cells appeared in MIC1-1C3+ population or in the EpCAM+ population. Experiments were performed with three biological replicates and representative results are shown.
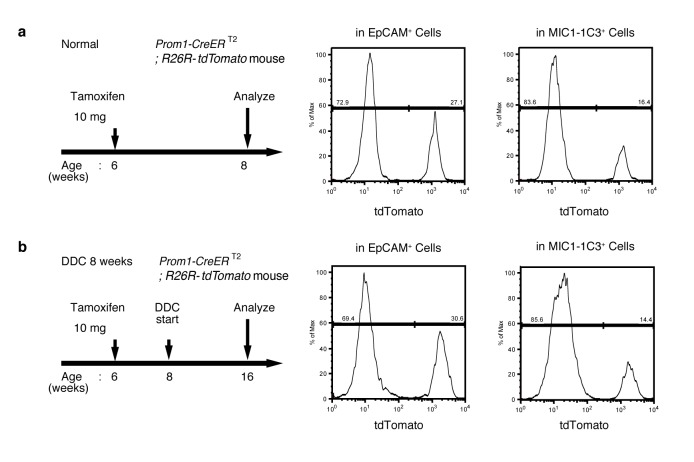
Figure 3—figure supplement 2. FACS quantification of labeled ratio in the Prom1-CreERT2; R26R-tdTomato mice before/after DDC injury.

Figure 3—figure supplement 2.

(a and b) Labeling ratio in EpCAM+or MIC1-1C3+ cell populations in the Prom1-CreERT2;R26R-tdTomato mice was evaluated by FACS. The panels on the left show the experimental design. The mice were subjected to analysis DDC injury. Non-parenchymal cells were collected from the dissociated liver and stained with anti-EpCAM antibody or anti-MIC1-1C3 antibody. FACS gates were applied sequentially as follows: DAPI- (live cells), FSC/SSC, pulse width, CD45-, and EpCAM+ or MIC1-1C3+.